CropWatch Pro User Manual - PRODUCED BY CROPWATCH TEAM V 20200804 2020 - United Nations ESCAP
←
→
Page content transcription
If your browser does not render page correctly, please read the page content below
2020

CropWatch Pro User
Manual

PRODUCED BY
CROPWATCH TEAM
V 20200804
Contents
1.     CropWatch Pro ....................................................................................................................... 2
     1.1.   CropWatch processing levels ........................................................................................... 2
     1.2.   The CropWatch Indicators................................................................................................ 2
     1.3.   CropWatch Indicators Processing..................................................................................... 5
       1.3.1. System registration .................................................................................................... 5
       1.3.2. System login .............................................................................................................. 5
       1.3.3. System Management.................................................................................................. 6
       1.3.4. Agro-climatic Indices: includes three indices ............................................................ 8
       1.3.5. Data composition ....................................................................................................... 9
       1.3.6. Crop condition ......................................................................................................... 10
     1.4.   Thematic map for country analysis (for every CropWatch Bulletin analyst) ................. 11
       1.4.1. NDVI profile ........................................................................................................... 12
       1.4.2. Rainfall profile......................................................................................................... 15
       1.4.3. Temperature profile ................................................................................................. 15
       1.4.4. VCIx ........................................................................................................................ 16
       1.4.5. NDVI departure clustering ...................................................................................... 17
       1.4.6. Proportion of NDVI anomaly categories compared with 5YA ................................ 17
       1.4.7. Potential Biomass Departure ................................................................................... 18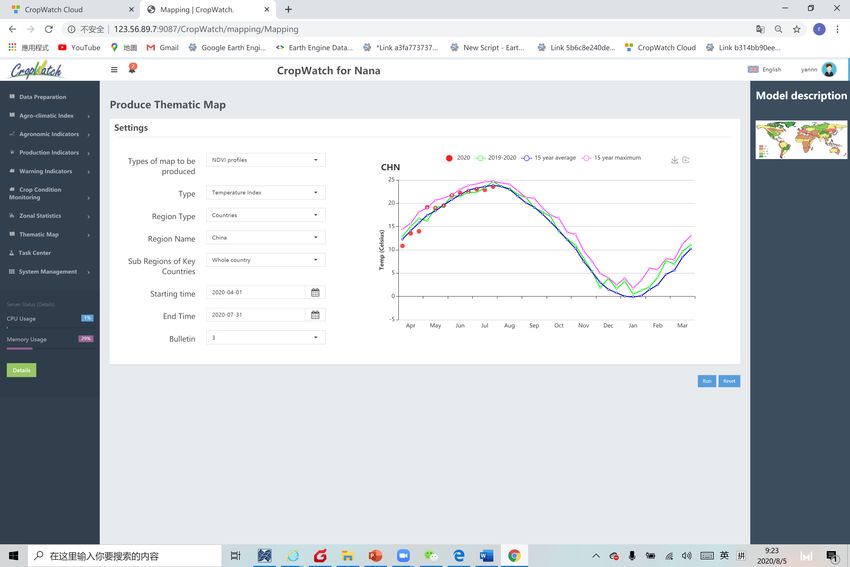
1. CropWatch Pro
       In this document, all components of “CropWatch Pro” and how to process all CropWatch indictors,
       at different scales, have been introduced to help the users to produce the thematic maps, graphs, and
       statistics needed for CropWatch analysis.

1.1.      CropWatch processing levels
        All CropWatch indicators can be processed and generated at four different levels:
         a) Global level
         b) Major production zones (MPZs) level: includes West Africa, North America, South America,
              South and Southeast Asia, Western Europe, Central Europe to Western Russia.
         c) National level: All indicators for 173 countries/regions, and production estimation for 42 key
              countries
         d) Subnational level: Agro-ecological zones for 43 key countries and provincial/state level for all
              173 countries/regions

1.2.      The CropWatch Indicators
   CropWatch indicators The CropWatch indicators are designed to assess the condition of crops
   and the environment in which they grow and develop; the indicators—RAIN (for rainfall),
   TEMP (temperature), and RADPAR (photosynthetically active radiation, PAR)—are not
   identical to the weather variables, but instead are value-added indicators computed only over
   crop growing areas (thus for example excluding deserts and rangelands) and spatially weighted
   according to the agricultural production potential, with marginal areas receiving less weight
   than productive ones.
   The indicators are expressed using the usual physical units (e.g., mm for rainfall) and were
   thoroughly tested for their coherence over space and time. CWSU are the CropWatch Spatial
   Units, including MRUs, MPZ, and countries (including first-level administrative districts in
   select large countries). For all indicators, high values indicate "good" or "positive."

 Biomass accumulation potential (BIOMSS)
                                            Biomass is presented as maps by pixels, maps
    An estimate of biomass that could      showing average pixels values over CropWatch
   potentially be accumulated over the  spatial units (CWSU), or tables giving average values
  reference period given the prevailing  for the CWSU. Values are compared to the average
   rainfall and temperature conditions.             value for the last 15 years, with
                                                  departures expressed in percentage.
 Cropped arable land and cropped arable land fraction (CALF)
    The area of cropped arable land as   The value shown in tables is the maximum value of
       fraction of total (cropped and    the 8 values available for each pixel; maps show an
    uncropped) arable land. Whether a    area as cropped if at least one of the 8 observations
     pixel is cropped or not is decided  is categorized as "cropped." Uncropped means that
   based on NDVI twice a month. (For       no crops were detected over the whole reporting
    each four-month reporting period,     period. Values are compared to the average value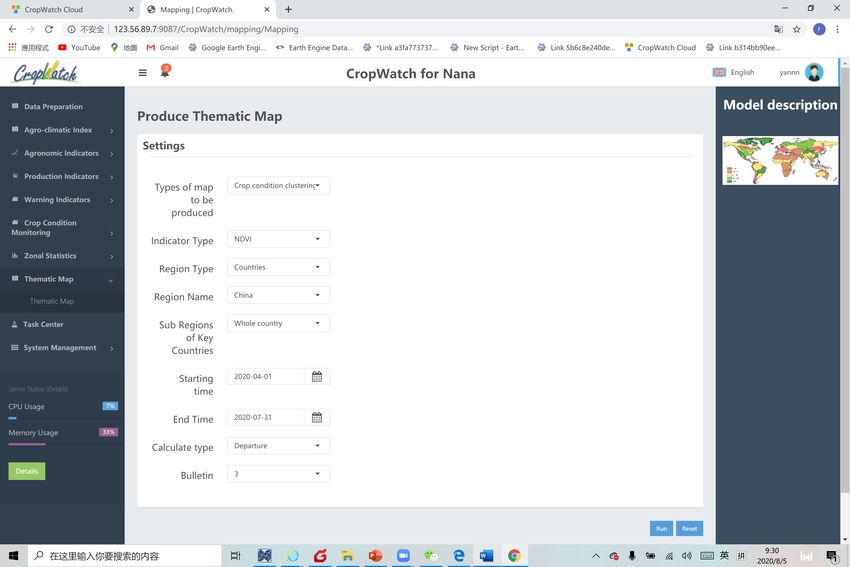
each pixel thus has 8 cropped/           for the last five years (2012-2016), with departures
          uncropped values).                                 expressed in percentage.

Cropping intensity Index
 Cropping intensity index describes the        Cropping intensity is presented as maps by pixels
extent to which arable land is used over         or spatial average pixels values for MPZs, 43
  a year. It is the ratio of the total crop     countries, and 7 regions for China. Values are
area of all planting seasons in a year to        compared to the average of the previous five
      the total area of arable land.            years, with departures expressed in percentage.

Normalized Difference Vegetation Index (NDVI)
                                                NDVI is shown as average profiles over time at
                                                   the national level (cropland only) in crop
                                                 condition development graphs, compared with
     An estimate of the density of living      previous year and recent five-year average, and as
               green biomass.                            spatial patterns compared to the
                                                 average showing the time profiles, where they
                                               occur, and the percentage of pixels concerned by
                                                                   each profile.
CropWatch indicator for Photosynthetically Active Radiation (PAR), based on pixel-based PAR
(RADPAR)
    The spatial average (for a CWSU) of        RADPAR is shown as the percent departure of the
    PAR accumulation over agricultural        RADPAR value for the reporting period compared
     pixels, weighted by the production                 to the recent fifteen-year average
CropWatch indicator for rainfall, based on pixel-based rainfall (RAIN)
                                                         RAIN is shown as the percent departure of the
                                                       RAIN value for the reporting period, compared to
      The spatial average (for a CWSU) of
                                                               the recent fifteen-year average, per
     rainfall accumulation over agricultural
                                                       CWSU. For the MPZs, regular rainfall is shown as
       pixels, weighted by the production
                                                        typical time profiles over the spatial unit, with a
                    potential.
                                                         map showing where the profiles occur and the
                                                         percentage of pixels concerned by each profile.
CropWatch indicator for air temperature, based on pixel-based temperature (TEMP)
                                                 TEMP is shown as the departure of the average
                                                   TEMP value (in degrees Centigrade) over the
   The spatial average (for a CWSU) of the        reporting period compared with the average of
        temperature time average over          the recent fifteen years, per CWSU. For the MPZs,
     agricultural pixels, weighted by the               regular temperature is illustrated as
             production potential.               typical time profiles over the spatial unit, with a
                                                  map showing where the profiles occur and the
                                                  percentage of pixels concerned by each profile.
Maximum vegetation condition index (VCIx)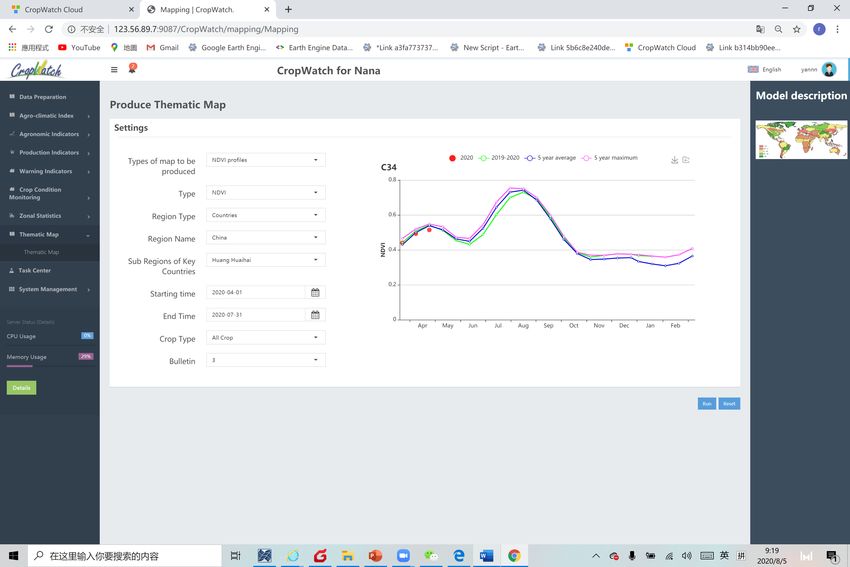
Vegetation condition of the current             VCIx is based on NDVI and two VCI values are
      season compared with historical data.           computed every month. VCIx is the highest VCI
       Values usually are [0,1], where 0 is           value recorded for every pixel over the reporting
     "NDVI as bad as the worst recent year"            period. A low value of VCIx means that no VCI
       and 1 is "NDVI as good as the best             value was high over the reporting period. A high
       recent year." Values can exceed the            value means that at least one VCI value was high.
      range if the current year is the best or        VCI is shown as pixel-based maps and as average
                     the worst.                                       value by CWSU.
Vegetation health index (VHI)
           The average of VCI and the
    temperature condition index (TCI), with
                                                        Low VHI values indicate unusually poor crop
           TCI defined like VCI but for
                                                         condition, but high values, when due to low
        temperature. VHI is based on the
                                                      temperature, may be difficult to interpret. VHI is
      assumption that "high temperature is
                                                          shown as typical time profiles over Major
        bad" (due to moisture stress), but
                                                      Production Zones (MPZ), where they occur, and
      ignores the fact that low temperature
                                                         the percentage of pixels concerned by each
      may be equally "bad" (crops develop
                                                                           profile.
      and grow slowly, or even suffer from
                       frost).
Minimum Vegetation health index (VHIn)
    VHIn is the lowest VHI value for every           Low VHIn values indicate the occurrence of water
     pixel over the reporting period. Values          stress in the monitoring period, often combined
      usually are [0, 100]. Normally, values         with lower than average rainfall. The spatial/time
         lower than 35 indicate poor crop            resolution of CropWatch VHIn is 16km/week for
                    condition.                                     MPZs and 1km/dekad fo
Leaf Area Index (LAI)
                                                     LAI is an important structural property of
It is defined as the one-sided green leaf area per
                                               vegetation. Leaf surfaces are the primary controller
    unit ground surface area (LAI = leaf area / of energy and mass exchange, important processes
ground area, m2 / m2). LAI ranges from 0 (bare   such as canopy interception, evapotranspiration,
    ground) to over 10 (dense conifer forests).and gross photosynthesis. The higher the LAI value,
                                                             the higher the final yield.
Fractional of Absorbed Photosysthetic Radiation (fAPAR)

FAPAR is the fraction of the incoming solar
radiation in the Photosynthetically Active
                                                          FAPAR is directly related to the primary
Radiation spectral region that is absorbed by a
                                                     productivity and can also be used as an indicator of
photosynthetic organism, typically describing
                                                       the state and evolution of the vegetation cover
the light absorption across an integrated plant
canopy.

          Evaportransperation (ET)

     Evapotranspiration (ET) is the sum of           Evapotranspiration is a significant water loss. Types
  evaporation and plant transpiration from the          of vegetation and land use significantly affect
     Earth's land and ocean surface to the             evapotranspiration, and therefore the amount of
                  atmosphere.                            water leaving the ground to the atmosphere.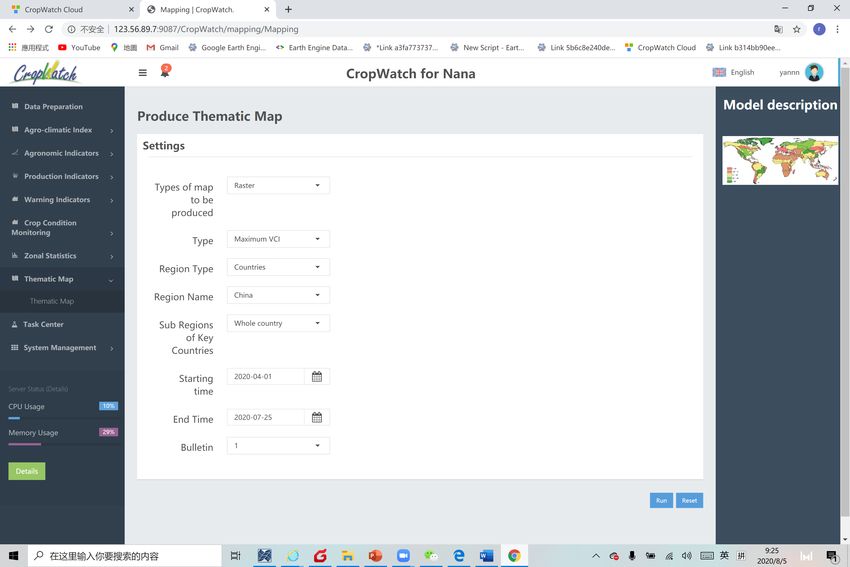
Normalized Difference of Water Index
                     (NDWI)
                                                         NDWIs sensitive to changes in vegetation
                                                      canopy water content. It is computed using the
 The Normalized Difference Water Index
                                                      near infrared (NIR) and the short-wave infrared
 (NDWI) is a remote sensing derived index
 estimating the leaf water content at canopy level.    (SWIR) reflectance’s. The value of this index
                                                        ranges from -1 to 1. The common range for
                                                               green vegetation is 0.02 to 0.6.

1.3.     CropWatch Indicators Processing
1.3.1. System registration
First, you need to have an account to log into the CropWatch Cloud website
(http://cloud.cropwatch.com.cn/) to start producing different CropWatch Indicators. In case you
don’t have an account, try to register via http://cloud.cropwatch.com.cn/user/register and send an
email to cropwatch@radi.ac.cn. Remember to copy to zhangmiao@radi.ac.cn

After type in your user name, email address and set your password as left graph, click the green
button to finish the registration
!!Do remember your username!!
1.3.2. System login

After you successfully registered and activate your account, please login via CropWatch Cloud
website (http://cloud.cropwatch.com.cn/).

After login, please use ‘CropWatch Pro’ Component (blue box below)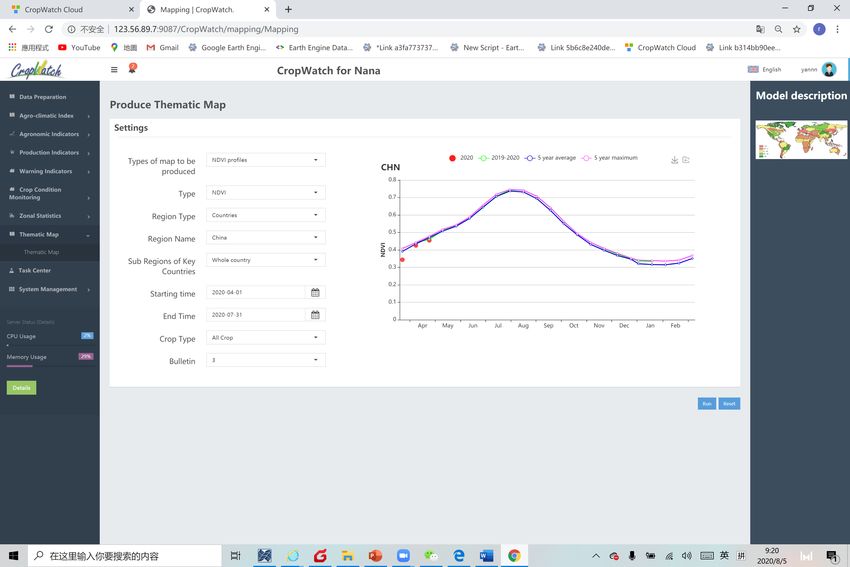
By clicking on one of CropWatch components (e.g. Rainfall index), the page of defining the
parameters for processing this component is opened with side Menu showing again all
CropWatch components for easy reaching.

1.3.3. System Management
For the users who login for the first time, you may define the system interface according to your
own interests. After clicking CropWatch Pro component, there will be a popup window to ask
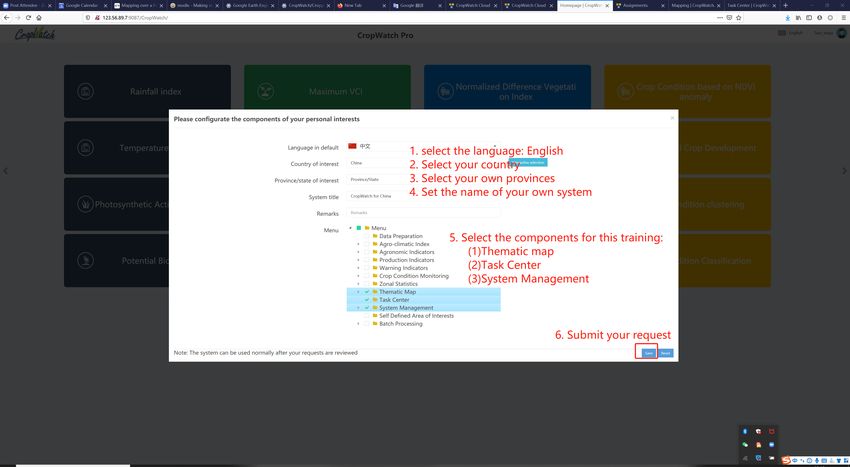
you to configurate your own interface. Following the steps in the below photo to finish the
configuration.

In case you close this popup and did not submit configuration request, just refresh the page and
this popup will show again.
If you already finish the configuration some time ago, but you want to redo the configuration.
Just click on your user name on right top corner of the website and select My Profile option, you
will be able to see the may profile page as follows. You can change the settings according to
your own perferance.

                                                       1.   Define the language
                                                       2.   2.Define the region of interest
                                                       3.   Define the name of region of
                                                            interest
                                                       4.   Give a name for your system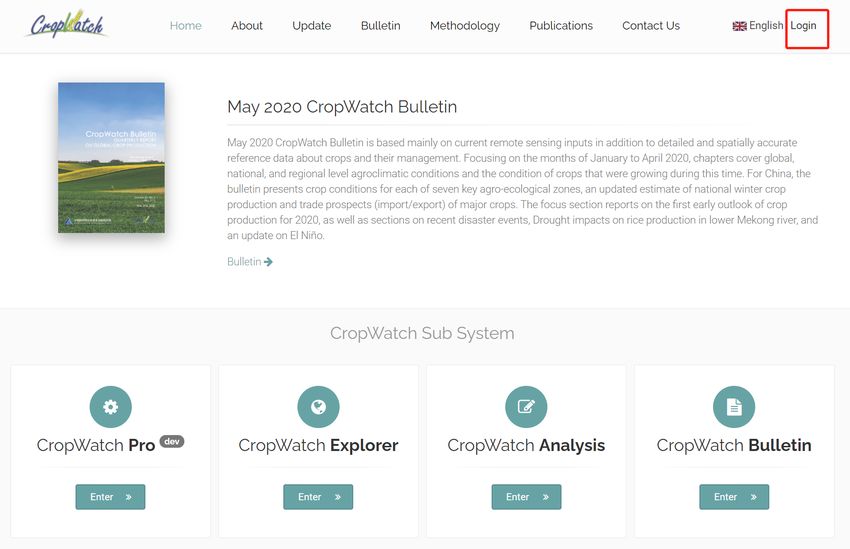
1.3.4. Agro-climatic Indices: includes three indices
1.3.4.1.  Rainfall Index

1.3.4.2.   Temperature Index

1.3.4.3.   Photosynthetic Active Radiation (PAR) Index
1.3.5. Data composition
1.3.5.1.   Agroclimatic index composite
To process the Agroclimatic index composite, follow the link:

1.3.5.2.   Biomass
To process the Biomass composite, follow the link:
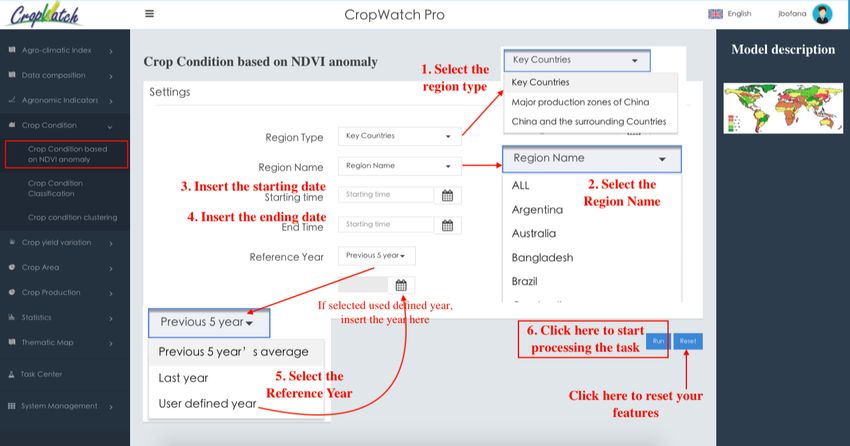
1.3.6. Crop condition
1.3.6.1.   Crop Condition based on NDVI anomaly
To process the Crop Condition based on NDVI anomaly, follow the link:

1.3.6.2.   Crop Condition Classification
To process the Crop Condition Classification, follow the link:
1.3.6.3.   Crop condition clustering
To process the Crop condition clustering, follow the link:

1.4.   Thematic map for country analysis (for every CropWatch Bulletin analyst)
After approved by the super admin, you are able to access ‘CropWatch Pro’ from home page of
cloud.cropwatch.com.cn.
The ‘Thematic Map’ component is most commonly used to produce the maps for the analysis.

Country analysis (analysis focusing on recent four months, 2020 April to July for August
Bulletin)
   For each country, several national maps will be produced for each country by the authors:

1.4.1. Phenology graph of major crops

   Type of Map: Phenology map
   Region name: Each country analyzer will select the one you are responsible for;
   Set the Starting Month and End Month according to the crop calendar of the current season in your
   country or region of interests.
1.4.2. NDVI profile
   For each country, the country analysts shall produce both country profiles and profiles for each
   AEZs .
   Type of Map: NDVI profiles
   Type: NDVI;
   Region Type: Countries
   Region name: Region name can be changed to other key country
   Set the Starting time and End time according to the crop calendar of the current season in your
   country or region of interests.
   Crop Type: All crop (or you could select rice or other major crops)
   Bulletin: could be set to 1, 2, 3, or 4 depending on the time of the bulletin.
   Set to 1 when working for February Bulletin,
   Set to 2 when working for May Bulletin,
   Set to 3 when working for August Bulletin,
   Set to 4 when working for November Bulletin,

   NDVI profile should also be produced for AEZs for each country, however for those AEZs with few
   agriculture outputs, you can ignore them.
NOTE: Subnational NDVI profiles are mandatory; If abnormal pattern happens in some
subnational regions, rainfall or temperature profiles can also be added;

 Set the Starting time and End time according to the crop calendar of the current season in your
 country or region of interests.
 Type: NDVI;
 Region Type: Countries
 Region name: Region name can be changed to other key country
 Subregion of key countries: AEZs can be chosen in specific country
 Bulletin: could be set to 1, 2, 3, or 4 depending on the time of the bulletin.
 Set to 1 when working for February Bulletin, Set to 2 when working for May Bulletin,
 Set to 3 when working for August Bulletin, Set to 4 when working for November Bulletin,

 All the profiles (NDVI profiles, rainfall profiles and temperature profiles) should be stored into
 database manually (See the graph below). Users can also download the map to local disk.
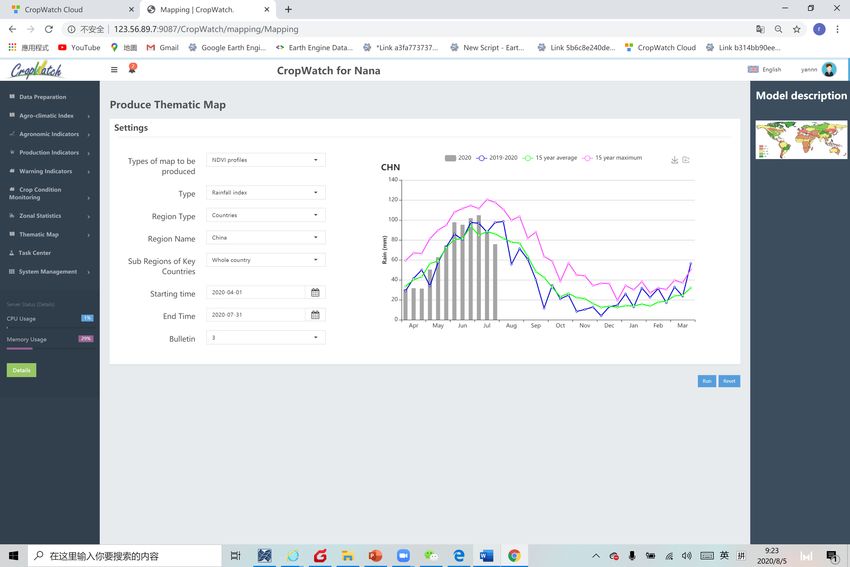
1.4.3. Rainfall profile
   For each country, the country analysts shall produce national rainfall profiles. Rainfall profiles for
   AEZs is optional.
   Set the Starting time and End time according to the crop calendar of the current season in your
   country or region of interests.
   Crop type: All crops;
   Bulletin: could be set to 1, 2, 3, or 4 depending on the time of the bulletin.
   Set to 1 when working for February Bulletin, Set to 2 when working for May Bulletin,
   Set to 3 when working for August Bulletin, Set to 4 when working for November Bulletin,

1.4.4. Temperature profile
   For each country, the country analysts shall produce national temperature profiles. Temperature
   profiles for AEZs is optional.
   Set the Starting time and End time according to the crop calendar of the current season in your
   country or region of interests.
   Crop type: All crops;
   Bulletin: could be set to 1, 2, 3, or 4 depending on the time of the bulletin.
   Set to 1 when working for February Bulletin, Set to 2 when working for May Bulletin,
   Set to 3 when working for August Bulletin, Set to 4 when working for November Bulletin,
1.4.5. VCIx
   Settings are as follows:
   Set the Starting time and End time according to the crop calendar of the current season in your
   country or region of interests.
   Bulletin: could be set to 1, 2, 3, or 4 depending on the time of the bulletin.
   Set to 1 when working for February Bulletin, Set to 2 when working for May Bulletin,
   Set to 3 when working for August Bulletin, Set to 4 when working for November Bulletin,
1.4.6. NDVI departure clustering
   Settings are as follows:
   Set the Starting time and End time according to the crop calendar of the current season in your
   country or region of interests.
   Calculate type: Departure;
   Bulletin: could be set to 1, 2, 3, or 4 depending on the time of the bulletin.
   Set to 1 when working for February Bulletin, Set to 2 when working for May Bulletin,
   Set to 3 when working for August Bulletin, Set to 4 when working for November Bulletin,
   Each country analyzer will select the one you are responsible for.

1.4.7. Proportion of NDVI anomaly categories compared with 5YA
   Settings are as follows:
   Type of Map: Crop Condition Classification
   Type: NDVI
   Region type: Country
   Region name: Each country analyzer will select the one you are responsible for;
   Set the Starting time and End time according to the crop calendar of the current season in your
   country or region of interests.
   Calculate type: Departure;
   Bulletin: could be set to 1, 2, 3, or 4 depending on the time of the bulletin.
   Set to 1 when working for February Bulletin, Set to 2 when working for May Bulletin,
   Set to 3 when working for August Bulletin, Set to 4 when working for November Bulletin,
1.4.8. Potential Biomass Departure

   Settings are as follows:
   Type of Map: Raster
   Type: Biomass departure
   Region type: Country
   Region name: Each country analyzer will select the one you are responsible for;
   Set the Starting time and End time according to the crop calendar of the current season in your
   country or region of interests.
   Bulletin: could be set to 1, 2, 3, or 4 depending on the time of the bulletin.
   Set to 1 when working for February Bulletin, Set to 2 when working for May Bulletin,
   Set to 3 when working for August Bulletin, Set to 4 when working for November Bulletin,
You can also read