Soil Properties of Yolo Loam - Caltrans Earth Pressure Project
←
→
Page content transcription
If your browser does not render page correctly, please read the page content below
CIVIL & ENVIRONMENTAL ENGINEERING, UC BERKELEY

           Soil Properties of Yolo
                   Loam
                     Caltrans Earth Pressure Project
                                   Nathaniel Wagner, Jeffrey Zayas
                                             Summer 2011

This document details the characterization of various material properties of Yolo Loam soil obtained near
Davis, California for the purposes of rendering a numerical model in FLAC.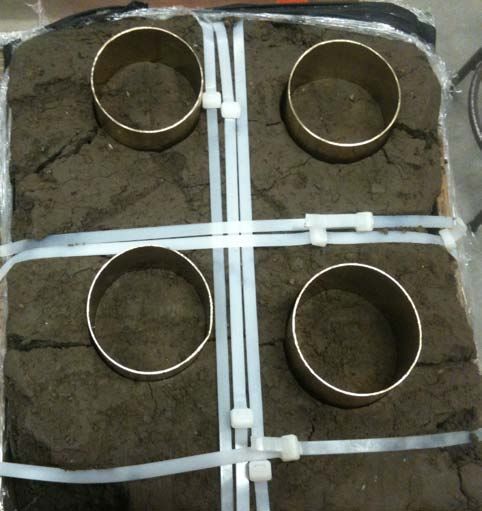
Caltrans Earth Pressure Project – Yolo Loam                                      Summer 2011

Introduction

       The scope of this document details the laboratory testing of Yolo Loam soil obtained
from the area near the Center for Geotechnical Modeling on the University of California, Davis
campus. The purpose is to determine various soil properties for use in a numerical model to
emulate the observed and measured response from the centrifuge tests.

Particle-Size Distribution

        The particle-size distribution was determined according to ASTM D-422. The sample
was initially oven-dried, then dispersed using a solution of sodium hexametaphosphate.
Following the hydrometer test, the sample was wet-sieved over a No. 200 sieve. The retained
solids were oven-dried before the mechanical sieving process. The particle-size distribution
curve is displayed in Figure 1.

                               Figure 1: Particle-Size Distribution Curve

                                                                                            2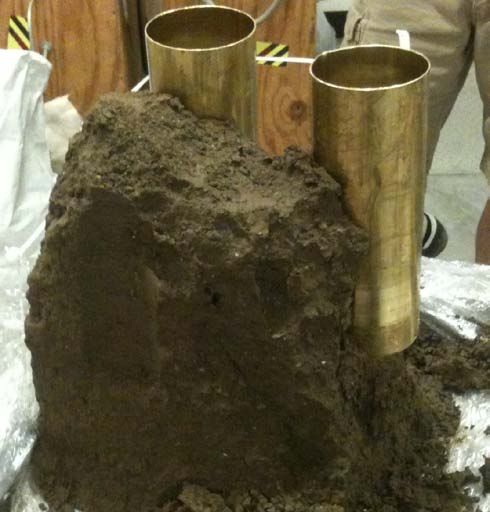
Caltrans Earth Pressure Project – Yolo Loam                                           Summer 2011

Atterberg Limits

        Atterberg Limits were determined according to ASTM D-4318. The Liquid Limit was
29.5%, the Plastic Limit was 18.2%, and the Plasticity Index was 11.3%. Combined with the
particle-size distribution analysis, the final classification of the soil was a low plasticity, lean
clay (CL). The Flow Curve is displayed in Figure 2, and the Plasticity Chart is displayed in
Figure 3.

                                        Figure 2: Flow Curve

                                                                                                  3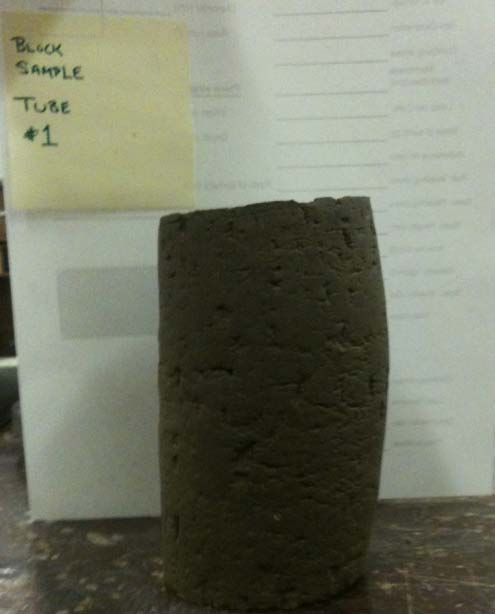
Caltrans Earth Pressure Project – Yolo Loam                                       Summer 2011

                                      Figure 3: Plasticity Chart

Compaction Curves

        Compaction curves were determined with both the Standard Proctor Method (ASTM D-
698) and the Modified Proctor Method (ASTM D-1557). Method A was used for both tests
(
Caltrans Earth Pressure Project – Yolo Loam Summer 2011
Figure 4: Compaction Curves
Triaxial Compression Tests
Unconsolidated-undrained triaxial (UUTX) compression tests were performed according
to ASTM D-2850. In total, five tests were performed; four were samples obtained from a larger
block sample excavated from the centrifuge box during disassembly of the model (Illustration 1),
the fifth one was a remolded sample that had previously been used in a resonant column test,
which is to be discussed later. Although the excavated block was fairly large, only four samples
were obtained to minimize the disturbance due to driving the sampling tubes. Confinement was
provided during sampling via plywood restrained by zip-ties. The sampling tubes were made of
brass and had a beveled edge to reduce disturbance during sampling. The remolded sample was
compacted with an air-hammer into one of the brass sampling tubes.
5Caltrans Earth Pressure Project – Yolo Loam Summer 2011
All tests were performed under a constant strain rate of 0.020in/min and continued until a
strain exceeding 15% was achieved. Confining pressure was allowed to slightly compress the
samples for approximately 8 minutes prior to initiating the test. This allowed the block samples
to return to the stress environment experienced during centrifuge testing at various depths. Each
confining pressure (0.5atm, 1.0atm, 1.5atm, and 2.0atm) corresponded to a different depth level
in the soil profile. The moisture content for all five samples was determined to be between 15.5
and 16.25%; still above optimum moisture, but with some drying of the samples during testing.
Illustration 1: Block Sample and Tube Extraction
All samples exhibited ductile failure by bulging in the middle section of the sample; a
typical sample after testing is displayed in Illustration 2. This corresponds to the placement
method of the soil in both the excavated block and the remolded tube sample because they were
all compacted above optimum moisture to achieve a dispersed soil fabric.
6Caltrans Earth Pressure Project – Yolo Loam Summer 2011
Illustration 2: Typical Sample after UUTX Test
From the measured axial load and deformation, the shear stress, τ, and the axial strain,
εaxial, were determined using Equations 1 and 2, respectively, where L is the axial load, ΔH is the
axial deformation, H0 is the initial sample height, and A0 is the initial sample cross-sectional
area. Then, stress-strain curves were determined for each sample; the 1atm confining pressure
results are displayed in Figure xx. Again, the ductile failure mode is apparent by the shape of the
curve. All tests resulted in similar curves with strength increasing with confining stress.
εaxial = ΔH / H0 (1)
τ = (L / (A0 / (1-εaxial))) /2 (2)
7Caltrans Earth Pressure Project – Yolo Loam Summer 2011
Figure 5: Typical Stress-Strain Curve
The results for the tests were compiled, displayed in Table 1, and prepared as a series of
failure envelopes for different strain levels (0.5%, 1%, 2%, 4%, 8%, 15%), displayed in Figure 6.
Failure based on strain levels are appropriate because the soil did not exhibit a peak stress
followed by residual stress, and because the soil the centrifuge model was able to withstand
major earthquake motions without large-scale failure. The remolded sample exhibited slightly
lower strength than the samples from the excavated block (at the same 2atm confining pressure),
but the same failure mechanism was observed. Additionally, the 1.5atm confining pressure
sample had been damaged during sampling, so the measured strength was significantly less than
the 1.0atm confining pressure sample. As such, neither the remolded sample at 2.0atm confining
pressure data nor the excavated sample at 1.5atm confining pressure data was included in the plot
of the failure envelopes.
8Caltrans Earth Pressure Project – Yolo Loam Summer 2011
Percent Strain
0.50% 1.00%
Confining Pressure
Deviatoric Avg Tot Shear Deviatoric Avg Tot Shear
(atm)
0 0.12 0.06 0.06 0.28 0.14 0.14
0.5 0.32 0.66 0.16 0.47 0.74 0.24
1 0.51 1.26 0.26 0.70 1.35 0.35
1.5 0.35 1.67 0.17 0.59 1.79 0.29
2 (remolded) 0.53 2.27 0.27 0.67 2.34 0.34
2 0.50 2.25 0.25 0.77 2.38 0.38
Percent Strain
2.00% 4.00%
Confining Pressure
Deviatoric Avg Tot Shear Deviatoric Avg Tot Shear
(atm)
0 0.54 0.27 0.27 0.84 0.42 0.42
0.5 0.65 0.82 0.32 0.83 0.92 0.42
1 0.88 1.44 0.44 1.08 1.54 0.54
1.5 0.86 1.93 0.43 1.01 2.50 0.50
2 (remolded) 0.82 2.41 0.41 1.09 2.05 0.55
2 1.03 2.51 0.51 1.24 2.62 0.62
Percent Strain
8.00% 15.00%
Confining Pressure
Deviatoric Avg Tot Shear Deviatoric Avg Tot Shear
(atm)
0 0.99 0.50 0.50 0.00 0.00
0.5 1.05 1.03 0.53 1.16 1.08 0.58
1 1.31 1.65 0.65 1.49 1.75 0.75
1.5 1.25 2.62 0.62 1.44 2.72 0.72
2 (remolded) 1.31 2.16 0.66 1.48 2.24 0.74
2 1.49 2.74 0.74 1.72 2.86 0.86
Table 1: Stress-Strain Data for Failure Envelopes
9Caltrans Earth Pressure Project – Yolo Loam Summer 2011
Figure 6: Failure Envelopes
10Caltrans Earth Pressure Project – Yolo Loam Summer 2011
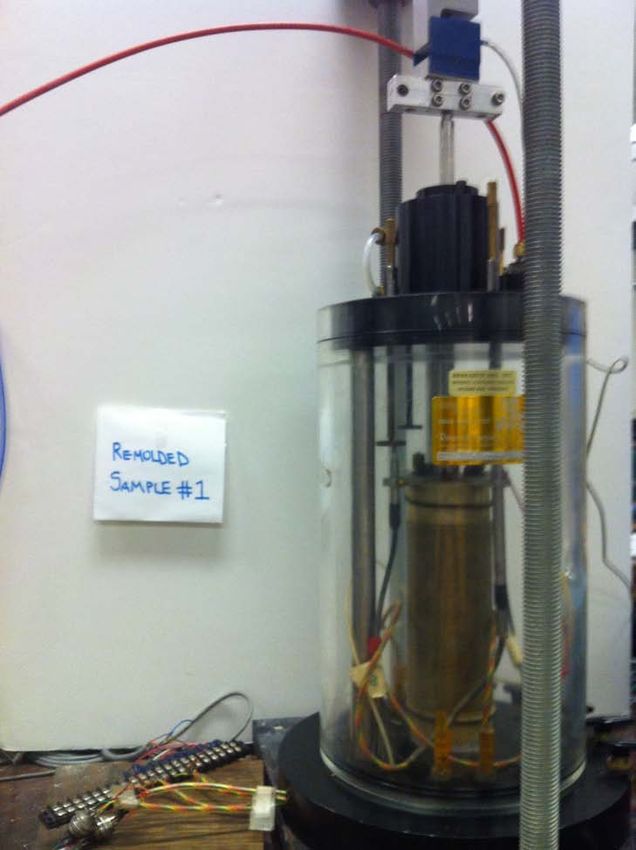
Shear Modulus
Because the centrifuge tests were ultimately concerned with the dynamic response of the
soil-structure model to earthquake loading, a resonant column test (ASTM D-4015) was
performed to evaluate the shear modulus that could be expected in the field. The setup for this
test is displayed in Illustration 3.
Illustration 3: Resonant Column and Cyclic Triaxial Test Setup
11Caltrans Earth Pressure Project – Yolo Loam Summer 2011
Shear wave travel times were measured using an oscilloscope with both active and
passive excitation of the sample. In the active mode, a large-voltage signal was sent to a bender
element embedded in the base of the sample and the arrival was received in another bender
element embedded in the top. The travel time was estimated on the oscilloscope by measuring
the peak-to-peak time increment between the sent and received signals. In the passive mode, a
rubber implement was used to tap the outside of the base of the testing apparatus, which would
induce a shear wave that could be recorded on both bender elements. The travel time was
estimated on the oscilloscope in the same manner as before. The travel times were drastically
different depending on the excitation mode, perhaps due to the possibility that the passive
excitation method could have produced waves that progressed through the testing apparatus
faster than through the soil. Another possible explanation is that the passive excitation could
have created body waves in the sample, which would travel significantly faster than shear waves.
Thus, the active excitation method was preferred and used as the standard for the remainder of
the test.
From the travel times and the distance between the tips of the bender elements, the shear
wave velocity was estimated at each of the confining stresses used during the UUTX testing.
Then, the maximum shear modulus, Gmax, was determined using Equation 3, where ρ is the
sample moist density and Vs is the estimated shear wave velocity.
Gmax = ρVs2 (3)
Using the aforementioned equation, a sample density of 2.08 g/cc, and an active
excitation shear wave velocity of 207 m/s, Gmax was determined to be 88.6 MPa.
To compare the measured Gmax to what could be expected in a larger strain scenario, a
series of cyclic loadings were performed by manually moving the loading rod by hand to
produce a measurable, but not damaging, strain of the sample. This was done at a confining
pressure of 1atm. From the measurements of axial load and displacement, the axial stress and
strain were determined. Then, the shear stress and strain were computed using Equations 4 and
5, where σdev is the deviatoric axial stress, εaxial is the axial strain, τ is the shear stress, and γ is the
shear strain. Equation 5 is based on the assumption that Poisson's ratio, υ, for the soil is 0.5 at
small strains, for which the cyclic load testing was controlled.
τ = σdev / 2 (4)
γ = 1.5 εaxial (5)
12Caltrans Earth Pressure Project – Yolo Loam Summer 2011
Hysteresis loops were plotted for each series of cyclic loads, and from these the strain
amplitude and shear modulus were estimated. A typical hysteresis loop plot is displayed in
Figure 7.
Figure 7: Typical Hysteresis Loops from Cyclic Loading Test
As a last comparison, the ratio of G to Gmax can be plotted against the strain amplitude of
the corresponding cyclic load test, then compared to the typical G/Gmax curves developed in
Vucetic and Dobry (1988). It was suggested by Professor Sitar that the results of the cyclic
loading tests would not match exactly with those given by Vucetic and Dobry because the
samples were remolded as opposed to naturally deposited, upon which the characteristic curves
are based. The plot of the measured G/Gmax values and the Vucetic and Dobry curves is
displayed in Figure 8. The test numbers in the legend correspond to different series of cyclic
loadings that were performed, and are merely for convenience for recording the data.
13Caltrans Earth Pressure Project – Yolo Loam Summer 2011
Figure 8: G/Gmax vs. log γ Plot
14Caltrans Earth Pressure Project – Yolo Loam Summer 2011
Acknowledgements
We would like to thank Professor Riemer and Maggie Parks for their assistance with
instructing and performing the laboratory testing, and Professor Sitar for his guidance in
preparing the overall scope of the project. Additionally, we would like to thank Roozbeh Grayeli
and Gabriel Candia for providing reference material for the background theory of the testing.
15Caltrans Earth Pressure Project – Yolo Loam Summer 2011
References
ASTM Standard D422, 63 (2007), "Standard Test Method for Particle-Size Analysis of Soils,"
ASTM International, West Conshohocken, PA, 2003, DOI: 10.1520/D0422-63R07,
www.astm.org
ASTM Standard D698, 07e1, "Standard Test Method for Laboratory Compaction Characteristics
of Soil Using Standard Effort (12,400 ft-lbf/ft3 (600 kN-m/m3))," ASTM International,
West Conshohocken, PA, 2003, DOI: 10.1520/D0698-07E01, www.astm.org
ASTM Standard D1557, 09, "Standard Test Method for Laboratory Compaction Characteristics
of Soil Using Modified Effort (56,000 ft-lbf/ft3 (2,700 kN-m/m3))," ASTM International,
West Conshohocken, PA, 2003, DOI: 10.1520/D1557-09, www.astm.org
ASTM Standard D2850, 03a (2007), "Standard Test Methods for Unconsolidated-Undrained
Triaxial Compression Test on Cohesive Soils," ASTM International, West
Conshohocken, PA, 2003, DOI: 10.1520/D2850-03AR07, www.astm.org
ASTM Standard D4015, 07, "Standard Test Methods for Modulus and Damping of Soils by
Resonant-Column Method," ASTM International, West Conshohocken, PA, 2003, DOI:
10.1520/D4015-07, www.astm.org
ASTM Standard D4318, 10, "Standard Test Methods for Liquid Limit, Plastic Limit, and
Plasticity Index of Soils," ASTM International, West Conshohocken, PA, 2003, DOI:
10.1520/D4318-10, www.astm.org
Vucetic, M. and Dobry, R. (1991) “Effect of Soil Plasticity on Cyclic Response”, Journal of
Geotechnical Engineering, ASCE, Vol. 117, No. 1, pp. 89-107
16You can also read