Exploring Census Data Webinar Series: Webinar #4 - How Americans Spend Leisure Time - July 22nd, 2021 2:00-3:30pm, ET - Census ...
←
→
Page content transcription
If your browser does not render page correctly, please read the page content below
Exploring Census Data
         Webinar Series:
          Webinar #4 –

How Americans Spend Leisure Time

          July 22nd, 2021 2:00-3:30pm, ET

    Presented by: Adam Grundy and Melvenia Browne
                  U.S. Census Bureau

                                                    1
Exploring Census Data
Webinar Series
•   Monthly webinars on key topics
•   Follows real-life use cases
•   Presented by Census subject matter experts
•   Includes Q&A                                            https://www.census.gov/data/academy.html

•   Recorded and posted for later reference
•   Learn more at: https://www.census.gov/academy
•   View 2020 webinar series materials
    at: https://www.census.gov/data/academy/webinars.html

                                                                                              2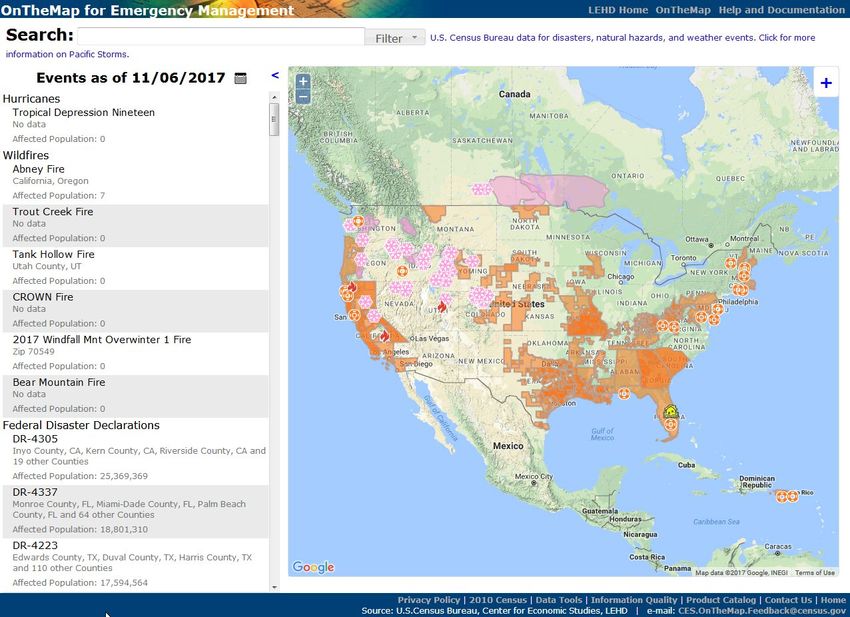
Outline                                                               census.gov

I. About the Census Bureau                                     • To obtain an archived
II. Common Leisure Activities and the Census Data                copy, visit census.gov /
     We Have on the Topic                                        Explore Data / Census
III. Data Sources                                                Academy
   •   County Business Patterns and Nonemployer Statistics
       (CBP and NES)                                           • Find stories and free
   •   Economic Census                                           visualizations under
        • Data.census.gov
                                                                 ‘Library’
   •   The Annual Business Survey (ABS)
   •   Spotlight Survey: Annual Survey of Manufactures (ASM)
IV. Accessing These Statistics
   •   Census Business Builder (CBB) - DEMO
   •   Other data tools
V. Summary and Q&A

                                                                                         3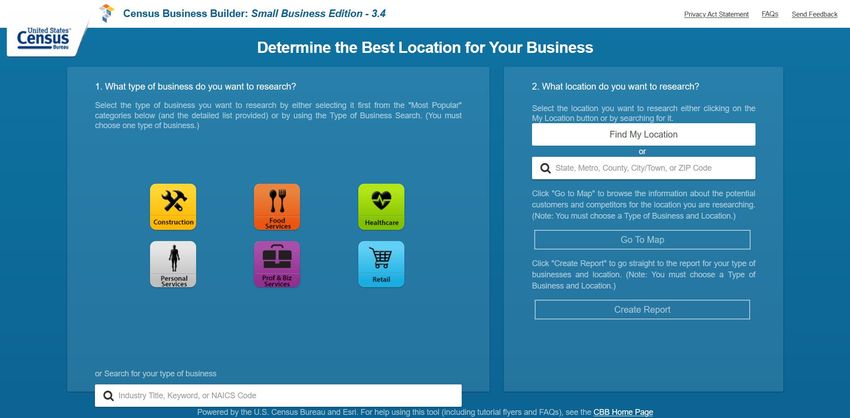
About the Census Bureau
                                                                                               Decennial Population
                                                                                               and Housing Census
• The U.S. Census Bureau is the federal government’s                                              Every 10 years
  largest statistical agency.
                                                                                                Economic Census
• We conduct more than 130 censuses and surveys each                                              Every 5 years
  year, including                                                                             Census of Governments
  -   The Decennial Census – the once-a-decade population and housing count of the                Every 5 years
      United States
                                                                                           American Community Survey
  -   The American Community Survey – the ongoing annual survey of the nation’s                      Annual
      population
  -   The Economic Census – the official five-year measure of American business                 Annual Retail Trade
                                                                                                     Annual
  -   The Census of Governments – the official five-year measure of the nation's state
      and local government sector
                                                                                               Plus more than 130
  - Our mission is to serve as the leading source of quality data                        demographic and economic surveys
    about America’s people, places, and economy.                                                    every year

                                                                                                                      4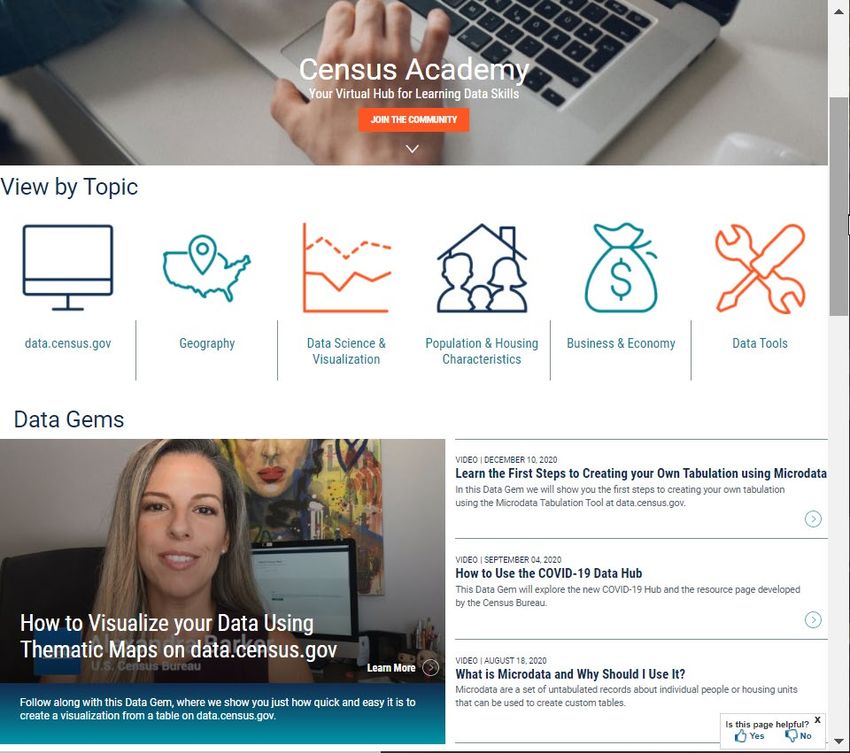
Monthly
                                                                                                  and Quarterly
                                                                                                     Surveys

                                                                                                  Annual Surveys

                                                                                          Economic Census – Every 5 years

           Census Economic Surveys
•   Census Bureau Economic Surveys are a key source for official statistics companies can use:
     – Monthly and Quarterly are small sample surveys that provide the most TIMELY data available
     – Annual surveys have larger samples and provide the most up-to-date TREND data available
     – Every 5 years, the Economic Census measures all businesses and provides the most COMPREHENSIVE data
       available
•   These surveys set the standard for U.S. economic statistics, and are fueled by the data provided by individual businesses

                                                                                                                                5
Selected Ways to Access Data
 • QuickFacts
 • My Congressional District
 • My Tribal Area
 • OnTheMap for Emergency Management
 • Census Business Builder
 • TIGER/Line Shapefiles w/ Selected
   Demographic Data
 • Application Programming Interface
   (API)
 • COVID-19 Data Hub
 • data.census.gov

                                       census.gov/data/data-tools.html   6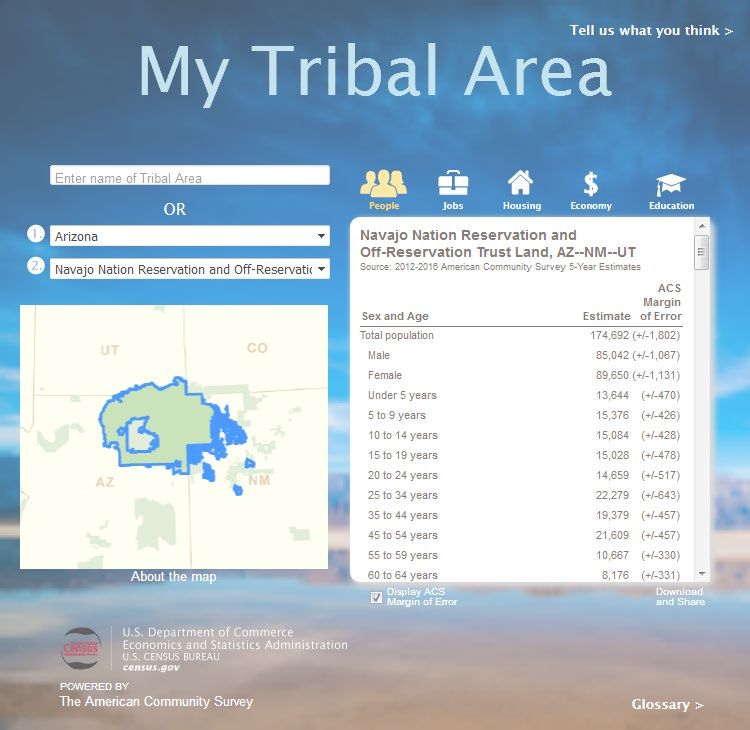
Steps to Start a Small Business

                 Step 2:           Step 3:
   Step 1:                                       Step 4:
              Conduct Market   Secure Funding,
   Ideation                                      OPEN!
                 Research       Location, etc.

                                                           7
Business                                    Who are my customers?

 Types         Will it be a business that
                     caters to other             Who are my
                       businesses?              competitors?
                       (B-to-B)

    Step 1:                                 Who are my suppliers,
                                              complementary
    Ideation                                  businesses, etc.

               Will it be a business that
                caters to the general        (The same questions as
                         public?                     above)
                       (B-to-C)

                                                                      8
How Americans Spend Their Leisure Time

                                         9
Case Study Introduction

                          10
AMERICAN TIME USE SURVEY-2019 RESULTS (bls.gov)
11Example My customers primarily will be athletes,
parents, and young adults that are in my
county and the surrounding counties.
My secondary customers will be the
consumers who frequent these
businesses.
Will it be a B-to-C?
YES My competitors are other sporting goods
stores and wholesalers in my area.
I want to open a Sporting
Goods Store or Bicycle Shops
(NAICS 451110)
My suppliers are sporting goods and
Will it be a B-to-B? bicycle parts manufacturers.
NO Complementary businesses include bike
parts wholesalers, etc.
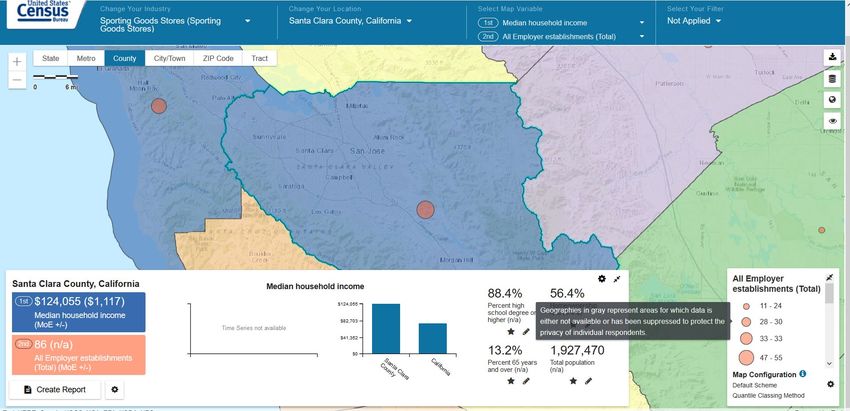
12Which Physical Location Should The
Entrepreneurs Target?
Should the couple
decide to move outside
of the DMV (DC, MD,
VA) to other cities
based upon this
information?
13https://cbb.census.gov/sbe/#
14• After the couple looks at similar data from different geographies using
the Census Business Builder, they do a deeper dive into County
Business Patterns and Nonemployer Statistics.
• They compared geographies in the DMV metro area to counties and
metro areas in California.
15Census Business Builder
Demo
16County Business Patterns (CBP)
&
Nonemployer Statistics (NES)
17CBP
General information about County Business Patterns (CBP)
• This program covers Employer Businesses in the U.S.
• Is published annually
• Latest data available (as of July 2021) is for calendar year 2019
• 2019 data have recently been released
• Includes statistics on the number of establishments, employment, and annual payroll for nearly
every 2- thru 6-digit NAICS code - please add first quarter payroll and specify somewhere that
employment is specific to the pay period including March 12.
• Data are published at the national, state, metropolitan/micropolitan statistical area (MSA), county,
congressional district, and ZIP Code levels
• CBP also covers the 5 US territories at the state and county equivalent levels
• Data are also shown by employment size of the establishment and by Legal Form of Organization
(LFO)
• Other facts about CBP:
• https://www.census.gov/programs-surveys/cbp.html for more information about this program
• The data are available on data.census.gov, CBB, the CBP web site (for download), the Census
API, etc.
18CBP
A Deeper dive into CBP
• CBP data can be used by entrepreneurs and existing business owners
to better understand their potential customers (for B-to-B businesses),
competitors, and suppliers
• The Employment Size data can be used to better understand the
distribution of businesses in the industry by their size and potentially
identify the “optimal” final business size
• The LFO data can help entrepreneurs plan for which legal form might
be best for their type of business
https://www.census.gov/programs-surveys/cbp.html
19CBP
Sporting Goods Stores (NAICS 451110) in the U.S.
First-
Annual
quarter Number of
Meaning of Legal form of organization code Meaning of Employment size of establishments Year Number of establishments payroll
payroll employees
($1,000)
($1,000)
All establishments All establishments 2019 20,416 5,455,523 1,292,621 239,004
C-corporations and other corporate legal forms of
All establishments 2019 5,320 2,666,963 627,861 122,669
organization
S-corporations All establishments 2019 9,224 1,644,617 383,492 61,326
Individual proprietorships All establishments 2019 2,542 173,308 39,534 8,034
Partnerships All establishments 2019 3,079 748,230 172,215 35,590
Other noncorporate legal forms of organization All establishments 2019 208 212,273 67,336 11,002
All establishments Establishments with less than 5 employees 2019 10,162 554,572 112,809 18,004
All establishments Establishments with 5 to 9 employees 2019 4,313 722,273 172,326 28,150
All establishments Establishments with 10 to 19 employees 2019 3,144 952,052 231,423 42,879
All establishments Establishments with 20 to 49 employees 2019 1,856 1,357,396 325,718 61,206
All establishments Establishments with 50 to 99 employees 2019 738 1,077,317 250,836 51,746
All establishments Establishments with 100 to 249 employees 2019 173 566,658 136,512 26,883
All establishments Establishments with 250 to 499 employees 2019 29 214,489 59,622 9,595
https://data.census.gov/cedsci/table?q=451110&tid=CBP2019.
CB1900CBP
20NES
General information about Nonemployer Statistics (NES)
• This program covers Nonemployer Businesses (self-employed persons) in the U.S.
• Is published annually
• Latest data available (as of July 2021) is for calendar year 2018
• Includes statistics on the number of firms and revenue for most 2- thru 6-digit NAICS codes
• Data are published at the national, state, MSA, and county levels
• NES does not cover the 5 US territories
• Data are also shown by revenue size of the firm and by Legal Form of Organization (LFO) (but only
at the national and state level)
• Other facts about NES:
• See https://www.census.gov/programs-surveys/nonemployer-statistics.html for more
information about this program
• The data are available on data.census.gov, CBB, the NES web site (for download), the Census
API, etc.
21NES
A Deeper dive into NES
• NES data can be used by entrepreneurs and existing business owners
to better understand their potential customers (for B-to-B businesses),
competitors, and suppliers
• The Revenue Size data can be used to better understand the
distribution of businesses in the industry by their size and potentially
identify the “optimal” final business size
• The LFO data can help entrepreneurs plan for which legal form might
be best for their type of business
https://www.census.gov/programs-surveys/nonemployer-statistics.html
22NES
Sporting Goods, Hobby, and Musical Instrument Stores (NAICS 4511) in the U.S.
Nonemployer
Number of
sales, value of
Meaning of Legal form of organization code Meaning of Sales, value of shipments, or revenue size of establishment code Year nonemployer
shipments, or
establishments
revenue ($1,000)
All establishments All establishments 2018 63,965 2,952,226
All establishments Establishments with sales, value of shipments, or revenue less than $5,000 2018 17,702 N
All establishments Establishments with sales, value of shipments, or revenue of $5,000 to $9,999 2018 10,295 N
All establishments Establishments with sales, value of shipments, or revenue of $10,000 to $24,999 2018 13,252 N
All establishments Establishments with sales, value of shipments, or revenue of $25,000 to $49,999 2018 8,151 N
All establishments Establishments with sales, value of shipments, or revenue of $50,000 to $99,999 2018 6,395 N
All establishments Establishments with sales, value of shipments, or revenue of $100,000 to $249,999 2018 5,648 N
All establishments Establishments with sales, value of shipments, or revenue of $250,000 to $499,999 2018 2,012 N
All establishments Establishments with sales, value of shipments, or revenue of $500,000 to $999,999 2018 510 N
C-corporations and other corporate legal
All establishments 2018 849 95,122
forms of organization
S-corporations All establishments 2018 3,530 397,042
Individual proprietorships All establishments 2018 55,673 2,041,840
Partnerships All establishments 2018 3,913 418,222
https://data.census.gov/cedsci/table?q=4511&tid=NONEMP2018
.NS1800NONEMP
23Why should the potential business owners use the Economic Census data?
What useful information can be found?
• The survey is the foundation for the measurement of U.S. businesses and
their Economic impact
• The survey shows what data has been released by state, metro area, county,
economic place levels, and national-level geographies
24Economic Census
25Economic Census
General information about the Economic Census (EC)
• This survey covers all Employer Businesses in the U.S.
• Is published every 5 years (ending in “2” and “7”)
• Latest data available (as of June 2021) is for calendar year 2017
• 2017 are being released through this Fall 2021
• Includes statistics on the number of establishments; employment; payroll; and value of sales,
receipts, revenue, or shipments for establishments of firms with paid employees for individual
industries
• Data are published at the state, metro area, county, economic place levels, and national-level
• ECON Census of Island Areas (ECIA) also covers the 5 US territories
• Other facts about the Economic Census:
• See https://www.census.gov/programs-surveys/economic-census.html for more information
about this survey
• The data are available on data.census.gov, CBB, the EC website (for download), the Census API,
etc.
26Economic Census
Economic Census Data in Action: Opening a New Small
Business – A Bike Shop in Santa Clara County, California
27Studying Who the Other Business Owners Are
• Bike stores, bike parts and sporting good stores and their business
owners
• What is the annual gross for some of these similar businesses?
• How much will they need to pay their employees?
• How many businesses (of sporting goods or specifically bike shops) are in the
vicinity of the new potential location?
28Annual Business Survey
program
29ABS
General information about the Annual Business Survey (ABS) Program
• The ABS program covers Employer Businesses in the U.S.
• The annual Nonemployer Demographic Statistics (NES-D) covers the Nonemployers
• Is published annually
• Latest data available (as of July 2021) is for data year 2018
• 2019 year data are scheduled for release by the end of 2021
• Includes statistics on the number of firms, employment, annual payroll, and sales, shipments,
receipts, or revenue for nearly every 2- thru 6-digit NAICS code (for data year 2018)
• Data are published at the national, state, county, and place levels (for data year 2019)
• Data for the 2019 ABS will be available at the national, state and MSA geography levels.
• Nation and state: full NAICS; County and place: just NAICS 00
• ABS does not cover the 5 US territories
30ABS
A Deeper dive into ABS
• Data are also shown by race, ethnicity, sex, and veteran status of the business owners and by other
characteristics of the business and the owner(s)
• ABS data can be used by entrepreneurs and existing business owners to better understand the
demographic characteristics of their industry as well as information about potential customers,
competitors, and suppliers
• NES-D provides annual data on nonemployer business demographics (e.g.; sex, ethnicity, race, and
veteran status) from administrative records and Census data
• Other facts about ABS and NES-D:
• See: https://www.census.gov/programs-surveys/abs.html for more information about this
program
• The data are available on data.census.gov, CBB (ABS only), the ABS/NES-D web sites (for
download), the Census API, etc.
31ABS
Sporting Goods Stores (NAICS 451110) in the U.S.
Annual
Meaning of Race, Ethnicity, Sex, and Veteran Status
Year Number of employer firms Sales, value of shipments, or revenue of employer firms ($1,000) Number of employees payroll
code
($1,000)
Total 2017 16,402 43,501,080 239,282 5,185,170
Classifiable 2017 16,220 19,867,533 122,411 2,841,673
Unclassifiable 2017 182 23,633,547 116,871 2,343,498
White 2017 15,591 18,807,596 117,923 2,711,503
Black or African American 2017 80 39,653 217 5,640
American Indian and Alaska Native 2017 64 44,828 338 7,129
Asian 2017 460 693,721 2,922 88,159
Native Hawaiian and Other Pacific Islander 2017 S S 20 to 99 employees S
Minority 2017 1,133 1,159,238 6,093 150,396
Equally minority/nonminority 2017 321 522,742 2,542 62,907
Nonminority 2017 14,766 18,185,554 113,776 2,628,369
Hispanic 2017 568 401,901 2,702 51,629
Equally Hispanic/non-Hispanic 2017 80 91,890 611 13,793
Non-Hispanic 2017 15,571 19,373,742 119,098 2,776,250
Female 2017 1,881 1,948,547 12,013 277,433
Male 2017 10,776 14,389,815 88,653 2,049,606
Equally male/female 2017 3,563 3,529,171 21,744 514,634
Veteran 2017 1,142 1,182,429 6,955 166,832
Equally veteran/nonveteran 2017 837 646,417 4,242 91,499
Nonveteran 2017 14,240 18,038,687 111,213 2,583,342
https://data.census.gov/cedsci/table?q=451110&tid=ABSCS201
7.AB1700CSA01 32Spotlight Survey: ASM
33ASM
Annual Survey of Manufactures (ASM)
• Overview
• Established in 1949
• Produces timely economic information about the manufacturing sector
between Economic Census years
• Furnishes benchmarks for current business indicators and measures of
industrial production and productivity
• Frequency
• Published annually, except in years ending in “2” and “7,” at which time the
data are included in the manufacturing sector of the Economic Census
34ASM
Annual Survey of Manufactures (cont.)
• Business Type Coverage
• Sample of approximately 50,000 establishments, drawn every 5 years
• Sample begins two years after the Econ Census year (most recent 2019)
• Establishment-based survey
• Provides sample estimates for all U.S. manufacturing establishments with one
or more paid employees
• Geographic Coverage
• U.S. and states
• Sectors and NAICS Coverage
• Manufacturing Sector NAICS 31-33
• 360 NAICS Industries
35ASM
Annual Survey of Manufactures (cont.)
• Data Variables Collected and Published
• Statistics for Industry Groups and Industries and Geographic Area Statistics:
Employment, payroll, hours, benefits, receipts, costs, inventories, capital
expenditures
• Value of Product Shipments (Survey years starting with 2018 include NAPCS
product data)
36ASM
Motorcycle, bicycle, and parts manufacturing (NAICS 336991) in the U.S.
Annual
2017 NAICS payroll Number of
Geographic Area code Meaning of NAICS code Year Sales, value of shipments, or ($1,000) employees
Name (NAME) (NAICS2017) (NAICS2017_LABEL) (YEAR) revenue ($1,000) (RCPTOT) (PAYANN) (EMP)
Motorcycle, bicycle, and
United States 336991 parts manufacturing 2018 6,610,926 542,975 9,373
Motorcycle, bicycle, and
United States 336991 parts manufacturing 2019 6,216,801 531,459 9,274
https://data.census.gov/cedsci/table?q=336991&tid=ASMAREA2017.
AM1831BASIC01
37Other tools to access key data
38Other Tools
39Case Study Wrap-Up
40Summary
I. The Census Bureau does so much more than count the US population every 10
years!
II. These Census data can help entrepreneurs and small business owners research their
markets and grow their business
III. The CBP, NES, EC, ABS, and the ASM provide data that help address key market
aspects
IV. Merging Census data with other data paints the most complete picture
V. Data.census.gov gives full access to nearly all of these data and so much more.
CBB provides access to key statistics in a user-friendly platform.
41Q & A and Thank You!
Contact Information:
Adam Grundy
301-763-7592
Adam.P.Grundy@census.gov
Melvenia Browne
301-763-7427
Melvenia.J.Browne@census.gov
To schedule additional training with a Census Data Dissemination
Specialist in your area, please call 844-Ask-Data
Or email us at: census.askdata@census.gov
42Reference Materials
43Key Census Bureau Business Data Terms
• NAICS (North American Industry Classification System)
• Our primary data dimension
• Establishments (vs. Companies, Firms, etc.)
• Our collection/tabulation level
• Employers (vs. Nonemployers)
• Most programs only cover employer businesses
• Nonemployers: self-employed individuals
• U.S. Code Title 13 and 26
• Protects business privacy and confidentiality
44North American Industry Classification System (NAICS)
www.census.gov/naics
• A hierarchical classification system that groups establishments into industries based on
the business activities in which they are primarily engaged.
• A comprehensive system covering the entire field of business activities.
• Used to collect, tabulate, analyze, and disseminate statistics.
• A common language used among the United States, Canadian, and Mexican statistical
agencies
• Updated every five years
45NAICS Hierarchy
Level Code Description
Sector 51 Information
Subsector 515 Broadcasting (except Internet)
Industry Group 5151 Radio and Television Broadcasting
Industry 51511 Radio Broadcasting
U.S. Industry 515112 Radio Stations
46You can also read