INNOVATIONS IN BRAZIL'S PRIVATE SECTOR - HSR CONFERENCE, LIVERPOOL, ENGLAND MAUREEN LEWIS PHD, CEO OCTOBER 11, 2018 - ACESO ...

Page created by Alex Moss
 
CONTINUE READING
INNOVATIONS IN BRAZIL'S PRIVATE SECTOR - HSR CONFERENCE, LIVERPOOL, ENGLAND MAUREEN LEWIS PHD, CEO OCTOBER 11, 2018 - ACESO ...
Maureen Lewis PhD, CEO
                                           October 11, 2018

Innovations in Brazil’s Private Sector
HSR Conference, Liverpool, England
INNOVATIONS IN BRAZIL'S PRIVATE SECTOR - HSR CONFERENCE, LIVERPOOL, ENGLAND MAUREEN LEWIS PHD, CEO OCTOBER 11, 2018 - ACESO ...
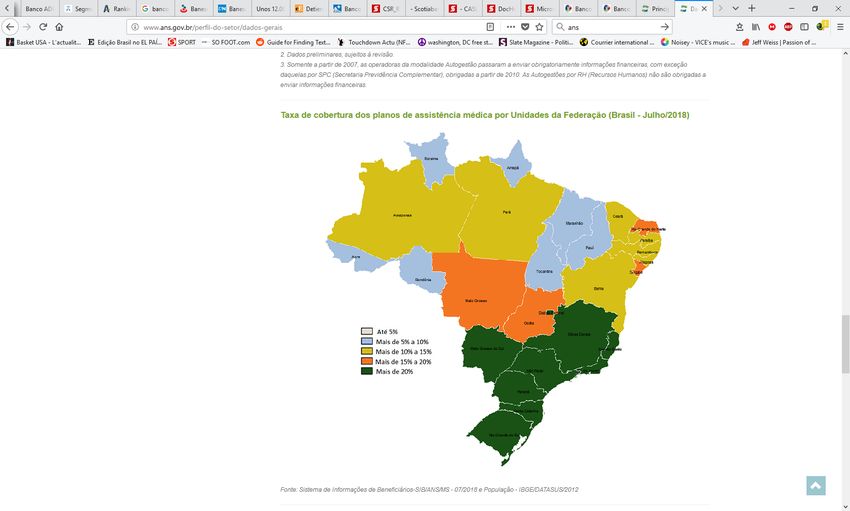
Brazil’s private sector is large and
innovating – public sector, not so much

This presentation covers:
• Challenges of SUS - public sector system
• Overview of the private sector
• Data on the size, coverage of the insurance sector
• Selected data on private providers
• Major innovators in the private sector

     © Aceso Global. All rights reserved.              2
Challenges in both public and private healthcare

• The two are linked but largely function separately
• The public sector serves low income households, as does the public
  sector, reflecting constraints in public healthcare
• Innovation in public healthcare limited and changes few since the launch
  of SUS in 1988
• Private healthcare has faced a sharp cost spiral, a recession and a
  retrenchment of enrollees – the response includes both stasis but also
  innovation to broaden the market, raise efficiency and control costs

      © Aceso Global. All rights reserved.                                   3
Organization of SUS Today
        without networks, coordination of care or accepted standards of quality

                                                                    Hospitals

                                                    FHP

                                                                    Tertiary
                                          Doctors         Clinics   Hospitals   PHC

   © Aceso Global. All rights reserved.                                               4
SUS – Public Sector Weaknesses

• Federal, state and municipal responsibilities
  fragmented
• Lack of autonomy at the local level                          Drives Private
• Rigidity in rules                                            Spending and
• Quality culture and quality priority missing                     Private
• Low productivity                                               Insurance
• No oversight of performance
• Data systems separate by function
• Lack of patient focus in service delivery
                                                  Source: Consocial 2017; Personal interviews 2018

      © Aceso Global. All rights reserved.                                                      5    5
Overview of Private Sector

• 56.6% of health care spending is          • Both for-profit and non-profit
  private
                                            • Providers unregulated
• 26% of the population has private
                                            • Fewer than 8% of providers
  health insurance
                                              accredited by national or
• Only 12 health insurers with over           global accreditation bodies
  100,000 enrollees
                                            • Insurance and providers target
• Providers run the gamut from                all income segments with
  basic and informal to high quality          different products for different
  quaternary care                             income groups
                                                                          Source: ANS

     © Aceso Global. All rights reserved.                                               6
Brazil’s private health insurance market is one of the
largest globally
                                                                        Number of Health and Dental Insurance
• Almost 50 million people covered
                                                                                 Enrollees per year
  by private health insurance
                                                               60

                                            Millions of Enrollees
    – 26% of the population
                                                               50
• Over 23 million people have dental
                                                               40
  insurance
                                                               30
• US$110 billion market
                                                               20
• Over 54,000 insurance suppliers
                                                               10
• 757 managed care organizations
                                                                    0
• Insurers regulated by ANS (Agência                                    2000 2002 2004 2006 2008 2010 2012 2014 2016 2018
  Nacional de Saúde Suplementar)                                        Health Insurance Only    Dental Insurance Only
                                                                                                             Source: ANS 2018

     © Aceso Global. All rights reserved.                                                                                       7
Extent of
Health
Insurance
Coverage by                                Up to 5%

State, 2018                                >10%

                                           >10-15%

                                           >15-20%

                                           >20%

                                                      Source: ANS 2018, IBGE 2018

    © Aceso Global. All rights reserved.                                        8
Characteristics of Private Health Insurers
              Type of Health Insurance                                                                Growth in Annual Premiums for
                                                                                                     Private Health Insurance (in 2017
                                                                                                                   US$)
                                                     Corporate In-house

                                                                               US$ Billions
                                                     Services                                 50
                                                                                              45
                                                     Physician Cooperative
                                                                                              40
                                                                                              35
                                                     Philanthropic Providers                  30
                                                                                              25

                                                     HMO                                      20
                                                                                              15
                                                                                              10
                                                     Contract-out Services                    5
                                                                                              0

                                                                                                   2001
                                                                                                          2002
                                                                                                                 2003
                                                                                                                        2004
                                                                                                                               2005
                                                                                                                                      2006
                                                                                                                                             2007
                                                                                                                                                    2008
                                                                                                                                                           2009
                                                                                                                                                                  2010
                                                                                                                                                                         2011
                                                                                                                                                                                2012
                                                                                                                                                                                       2013
                                                                                                                                                                                              2014
                                                                                                                                                                                                     2015
                                                                                                                                                                                                            2016
                                                                                                                                                                                                                   2017
Source: ANS 2018                                                                                                         Exchange Rate: US$ 1 = BR 3.198; Source: ANS 2018

              © Aceso Global. All rights reserved.                                                                                                                                                                        9
Private Health Insurance Service Coverage and Cost
          Distribution
         Private Health Insurance by Type of Service                                                     Distribution of Medical Care Spending by Private
                    Coverage, Dec 2017                                                                               Health Insurers, Dec 2017
                                                                                                  100%
                                                                                                                             Other - 5.4%
                                                                          572                     90%
Ambulatory and
                                                                  510
  Hospital                                                                                        80%
                                                                473                                                           Inpatient -
                                                                                                  70%                           39.8%

                    66
                                                                                                  60%
   Hospital Only   38                                                                                                        Outpatient -
                       65                                                                         50%                        Therapies
                                                                                                                                5.1% -
                                                                                                                                5.7%
                                                                                                  40%
                                 170                                                                                          Diagnostic
Ambulatory Only             95                                                                    30%                        Tests - 25.5%
                                 157
                                                                                                  20%

                                                                                                  10%                         Outpatient
                   0                   200                 400                  600
                                                                                                                             Visits - 18.5%
    Corporate health plan        Association health plan       Individual or family health plan    0%
                                                                                                                                              Sources: ANS 2018

                        © Aceso Global. All rights reserved.                                                                                                 10
60

                                             US$ Billions
                                                            50

Total Revenues
                                                            40
of Private
Health Insurers                                             30

by Year,
                                                            20
2001-2017
(2017 US$)                                                  10

                                                             0

                                                                 2001
                                                                 2002
                                                                 2003
                                                                 2004
                                                                 2005
                                                                 2006
                                                                 2007
                                                                 2008
                                                                 2009
                                                                 2010
                                                                 2011
                                                                 2012
                                                                 2013
                                                                 2014
                                                                 2015
                                                                 2016
                                                                 2017
                                                                  Exchange Rate: US$ 1 = BR 3.198; Source: ANS 2018

      © Aceso Global. All rights reserved.                                                                            11
Top 7 Health Insurers in Brazil by Number of Beneficiaries,
Type of Organization and Market Share 2018
                                                                                      # of          % change in
                                                                  % total market
            Health insurer                         Type of org.                    beneficiaries   beneficiaries,
                                                                  share 6/2018
                                                                                     6/2018        2014 to 2018
AMIL Health Insurance International                   HMO             7.5%          3,537,284           -2%
                                                    Indemnity
Bradesco Health                                                       7.1%          3,349,249          -13%
                                                    Insurance
Hapvida Health Insurance                              HMO             4.8%          2,274,990          +32%
Notre Dame Intermédica Health
                                                      HMO             4.3%          2,034,151          +50%
Insurance
                                                    Indemnity
Sul America Health Insurance                                          3.8%          1,773,914          +5%
                                                    Insurance
                                                     Physician
National UNIMED Center                                                3.1%          1,449,608           -7%
                                                   Cooperative
                                                    Physician
UNIMED - Belo Horizonte Cooperative                                   2.6%          1,237,972           -2%
                                                   Cooperative
                                                                                                     Source: ANS 2018

            © Aceso Global. All rights reserved.                                                                    12
Summary of Innovative Practices of Private Providers
                             Target low-           Integrated     Quality        IT for    IT performance   Efficient for     Insurance
                            income pop.            care model   measurement   management     monitoring       patients         Payment

   Amil/UHG                                            X            X             X                              X              HMO

 Bradesco Health                                                                                                 X               FFS

   Sul America                                                                                                   X               FFS

   UNIMED
                                                       X            X             X              X                              HMO
Minas Gerais/ NE

    HAPVIDA                         X                  X            X             X                              X              HMO

 Prevent Senior                     X                  X            X             X              X               X              HMO

N. D. Intermédica                   X                  X                          X                                          HMO/PPO

  Dr. Consulta                      X                                             X                              X          Provider - FFS
                                                                                                                              Provider -
ANAPHE Hospitals                                                    X             X                              X
                                                                                                                            Insurance/FFS

            © Aceso Global. All rights reserved.                                                                                          13
Prevent Senior – Greater São Paulo

•   Patient centered organization with defined objectives,
    processes and support to physicians
•   Risk stratification of patients and designated care givers    Value of Prevent Senior:
•   Integrated, comprehensive IT and data system                 Model of care emphasizing
    encompassing EHRs, and hospitals, clinic and physician          integrated care and
    performance                                                  prevention, clear incentives
•   Strong management across the system                           and strong management
•   Services based on team structure and coordinated               based on data analytics
    patient care
•   Protocols and continuous education for physicians
•   Just-in-time clinical back up to reduce wait times for
    patients
                                                                   Sources: Fagundes Parrillo 2018; HBS 2016

        © Aceso Global. All rights reserved.                                                              14   14
UNIMED – Belo Horizonte
•   Physician-run cooperative and insurance company
    with >1.2 million beneficiaries and network of 350
    providers
•   Pioneered pay-for-performance (P4P) programs in              Value of UNIMED-BH:
    their network in 2005                                      Continuous experimentation
                                                                with incentives to improve
•   First health insurer in Brazil to apply DRGs for           quality and efficiency across
    management in 2007                                                 levels of care
•   GUIA initiative (Management and Service Delivery
    Indicators) has used data for management since 2015
•   UNIMED Pleno, insurance product launched in 2013,
    links patient to PCP responsible for patient
    coordination and tracking

                                                          Sources: Borem et al. 2010; Morato de Castilho 2016

        © Aceso Global. All rights reserved.                                                               15   15
Hapvida – Northeast, Amazonas, Pára

•   Managed care chain targeting (lower) middle class in the
    poorest states in the NE, Amazonas and Pará, offering medical
    and dental plans
•   Exclusive network of hospitals, clinics, and emergency           Value of Hapvida:
                                                                      Rapidly growing
•   Fully EHRs – and electronically obtained from external network
                                                                       HMO in poorer
    providers
                                                                     states with EHR/IT
•   Patients can schedule follow-up appointments online               and data driven
•   Focus on quality - dedicated team to review surgical standards      management
    using electronic analytics platform

          © Aceso Global. All rights reserved.                                            16
Dr. Consulta – São Paulo, Rio de Janeiro, Belo
Horizonte
• Chain of “one-stop shop” outpatient clinics with
  on-site lab, diagnostics, and and specialty care
• Target low-income earners
• Located in poor neighborhoods and high-end              Value of Dr. Consulta:
  neighborhoods to be near employers of the poor       Fast-growing low-cost, high-
• Providers paid on a fee-for-service basis               volume delivery model
• Patients pay out-of-pocket at flat-rate fees         focused on accessibility and
• Digital patient records, and online patient portal     affordability for patients
  app for patients for results and feedback
• Harnessing technology (e.g. cloud, AI) to manage
  costs and supply chain, and moving toward
  utilizing machine learning algorithms and
  predictive analytics

      © Aceso Global. All rights reserved.                                        17
DRG Brazil

•   Developed DRGs for Brazilian private sector
    based on US/CMS DRGs and their algorithms
•   Major tool for quality assurance, management
    data, and only source of Brazilian data on hospital        Value of DRG Brazil:
    adverse events                                        Only reliable national source
                                                             of data on performance,
•   Implemented DRG for managed care company                costs and adverse events;
    (UNIMED) as a tool for quality, management, data      highly effective management
    control and cost containment                                       tool
•   Adapters have raised performance, reduced costs
    and improved outcomes in service delivery
•   Working with Belo Horizonte municipal Heatlh
    Secretary on adapting to public hospitals
                                                                              Source: Grilli 2018

        © Aceso Global. All rights reserved.                                                   18   18
Analysis of 2017 DRG data reveals opportunities for
substantive efficiency gains in private health care
 Reduce Length of                        Reduce Avoidable
      Stay                                  Admissions
• Private: 28% of cases               • In private sector, 5%
  above median ALOS                     of total inpatient days
• Public: 80% of cases                  due to avoidable            Combined,
  above median ALOS                     readmissions               could reduce
                                                                  waste in health
  Increase Hospital                      Reduce Avoidable           system by
       Safety                             Hospitalization
                                                                      42.3%
• Adverse events in                   • 26% of
  private hospitals cost                hospitalizations in
  R$10.9-15.6 billion                   private sector
• Adverse events                        avoidable
  increase patient                    • Account for 23% of
  ALOS by 6.9 days                      total inpatient days
                                                                             Source: Couto 2018

         © Aceso Global. All rights reserved.                                                19
Conclusions

• The private sector is driving             • Providers unregulated and not
  innovation in the Brazilian health          accredited --undermining
  sector                                      quality and performance
• Multiple models for delivery and          • Data on providers scarce
  finance that target different
                                            • Payer regulation would
  delivery challenges
                                              benefit from restructuring to
• Payers target all income groups;            promote efficiency and
  plans and benefits vary                     quality, and reduce number of
• Regulation of payers important              insurers
  for consumers and the industry                                         Source: ANS

     © Aceso Global. All rights reserved.                                              20
Thank you.
mlewis@acesoglobal.org
You can also read