Coffee Break: Commercial Auto Loss Trends - Liberty Mutual ...
←
→
Page content transcription
If your browser does not render page correctly, please read the page content below
Coffee Break:
  Commercial Auto Loss Trends
  Recharge your Knowledge, Refresh your Business

© 2014 Liberty Mutual Insurance. These materials may contain confidential information. Do not copy or disclose without prior permission from Liberty Mutual Insurance.
Agent Notice

                This presentation is general in nature. Every agent and broker
                is responsible for knowing the guidelines and laws that govern
                the business of insurance in the states where they are
                licensed. If any statement in this training conflicts with the
                policy language it describes, the policy language prevails.

Liberty Mutual Insurance Coffee Break                                            2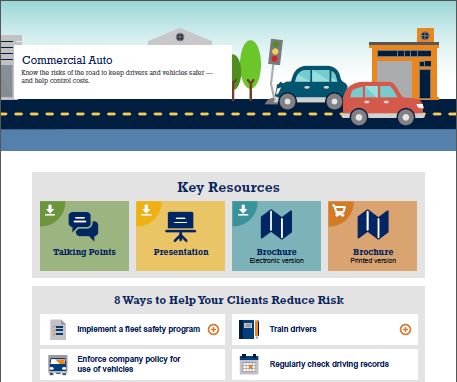
Antitrust Statement

              The purpose of this training is for Liberty Mutual Insurance to
              share helpful information with insurance agents and
              brokers. It is imperative that participants avoid any
              discussions, including informal conversations, which may
              violate antitrust laws on topics such as pricing, promotional
              policies, market allocation, supplier costs, conduct that could
              be construed as boycott, and any company-specific trends,
              expenses, or profit. You should consult your legal counsel if
              you have any questions regarding antitrust laws.

Liberty Mutual Insurance Coffee Break                                           3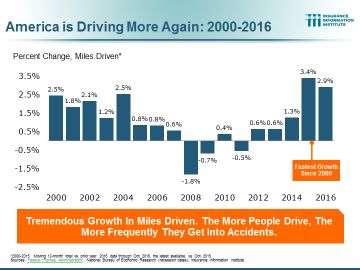
Commercial Auto Loss Trends
  Today’s Agenda

                                                           Future Commercial Auto
                                                           Trends
         What’s Driving the Poor Loss Results?
             • Vehicle Miles Driven Continue to Increase
                                                           Tips for Your Clients:
                                                           8 Ways to Lower Risk
             • Distracted Driving is a Growing Concern
             • Motor Vehicle Fatalities are Increasing     How Can We Help Make
                                                           the Roads Safer?
             • Increase in Vehicle Repair Costs            Resources to Share with
                                                           Your Clients

                                        ?!

Liberty Mutual Insurance Coffee Break                                                4
What’s Driving the Poor Loss Results?
MOTOR
?! VEHICLE
FATALITIES
REPAIR
DISTRACTED COSTS
DRIVING
MILES
DRIVEN
ADDITIONAL FACTORS
MEDICAL INCREASED LOW INCREASING NEW
INFLATION LITIGATION GAS PRICES VEHICLE SALES
higher severity longer development increased driving newer fleets
Liberty Mutual Insurance Coffee Break 5Vehicle Miles Driven
MILES
Continue to Increase
DRIVEN
Recent analysis of miles driven statistics by Insurance Information Institute:
• Miles driven decreased during the recession but have
increased steadily over the past few years during recovery –
correlated with employment.
• Miles driven started increasing much faster in 2015 and 2016.Source: Insurance Information Institute
Liberty Mutual Insurance Coffee Break 6?! Distracted Driving
is a Growing Concern
DISTRACTED
DRIVING
It’s hard to measure the exact impact of distracted driving,
but many sources show that it’s becoming a bigger issue.
SURVEY: “What We Do Behind The Wheel”
STUDY: Florida Distracted Driving
“During rush hour one February evening,
analysts filmed 20 minutes of traffic on I-95's
northbound lanes from the Clyde Moore Talking Less…
Overpass in Boca Raton. During that time,
2,151 cars passed through. Of those 2,151 65% Typing More
drivers, it was later revealed that more than
8 percent were driving distracted.” 51%
36%
31% 29%
13%
Talk on Phone Text Surf the Net
2009 2015
Source: SR-22 Agency, Broward Palm Beach New Times (left),
Insurance Information Institute (right)
Liberty Mutual Insurance Coffee Break 7Motor Vehicle Fatalities
MOTOR
VEHICLE
FATALITIES
are Increasing
Year-over-Year Change in Fatalities
2016 vs. 2014
Total US = +14%
Legend
Less than
10%
10% - 20%
Greater than
20%
• The number of motor-vehicle deaths in 2016 totaled 40,200 up 6% from
2015 and +14% from 2014. 2016 marks the first time the annual
fatality total has exceeded 40,000 since 2007.
Source: http://www.nsc.org/NewsDocuments/2016/mv-fatality-report-
• The estimated cost of motor-vehicle deaths, injuries, and property
1215.pdf
damage in 2016 was $432B an increase of 12% from 2015.
Liberty Mutual Insurance Coffee Break 8REPAIR Increase in
COSTS
Vehicle Repair Costs
Newer technologies and safety features
Sedan with Minor Front End Damage provide benefits, but also significantly
increase repair costs.
Part Description 2014 Model 2016 Model
Front Bumper
O/H Front Bumper $110 $110
Bumper Cover $528 $528
Add Clear Coat $53 $53
Grille Features such as LED headlights,
Grille w/adaptive cruise $240 $205 adaptive cruise control, backup
Distance sensor - $1,216 cameras and other safety aids can
Front Lamps significantly increase the physical
Headlamp Assembly $394 $918 damage cost of even low speed
Aim Headlamps $18 $18 impacts
Fender
Fender $450 $450
Add for Clear Coat $44 $44
Add for Edging $22 $22
Deduct for overlap ($13) ($13)
Estimate Totals Parts $1,224 $2,818
Body Labor
Paint Labor
$273
$348
$277
$348
Almost 2x the cost to repair
Mechanical Labor - $108
due to more expensive parts
Total Cost of Repairs $1,844 $3,551
Source: internal Liberty Mutual Analysis. Vehicle model: Acura ILX
Liberty Mutual Insurance Coffee Break 9Future Commercial Auto Trends
The trends driving auto losses are expected to continue into the near future, which means we must
exercise underwriting and pricing discipline and accept that rate increases will be the new norm.
Industry Outlook – Conning View
FREQUENCY
Expected to increase low single digits from 2016-2018, driven in part by increasing vehicle miles traveled (3% increase in latest year)
SEVERITY
Expected to increase low-to-mid single digits through 2018 driven by increasing repair costs and rising medical costs
ADDITIONAL CONSIDERATIONS:
1. Percent of vehicles with collision avoidance systems
continues to grow. It will be a while before the
technology saturates the market to the point where
crashes decline.
a) Crash severity will actually increase in the short-term,
meaning higher repair costs1.
b) The average age of vehicles on the road is 11.6 years
and continues to increase2, which will only delay
collision avoidance system saturation.
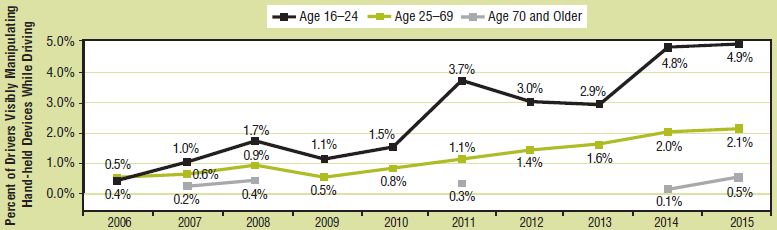
2. Distracted driving continues to increase despite
known risks and the increase in laws banning the
behavior3
Sources:
1http://www.repairerdrivennews.com/2015/08/26/iihs-in-just-2-years-percentage-of-vehicles-with-front-crash-protection-has-crossed-50/ |
2http://www.autonews.com/article/20161122/RETAIL05/161129973/average-age-of-vehicles-on-road-hits-11.6-years |
3https://www.nhtsa.gov/sites/nhtsa.dot.gov/files/documents/driver_electronic_device_use_in_2015_0.pdf
Liberty Mutual Insurance Coffee Break 10Tips for Your Clients: 8 Ways to Lower Risk
Implement a fleet safety program
Document the program and communicate expectations to all employees.
Enforce company policy for use of vehicles
Follow practices such as limiting personal use and monitoring who can use
company vehicles.
Hire qualified drivers
Document standards and call for medical evaluations, references, and road tests.
Use a company fleet
Be aware of extra risks when drivers use personal vehicles on the job.
Train your drivers
Cover these essential topics: break-downs, distracted driving, driving under the
influence, rest, speeding.
Regularly check driving records
Set a schedule for checking employee records and stick to it.
Monitor drivers with telematics
Focus on controlling risky practices like speeding and other aggressive behaviors.
Review every crash
Learn how to help prevent repeat incidents.
Liberty Mutual Insurance Coffee Break 11How Can We Help Make the Road Safer?
USE OUR RESOURCES
Educate your clients about
the increased risks and
costs so they and their
employees can become
safer drivers.
Visit helpingyousucceed-libertymutual.com/commercial-auto-trends
to access resources you can share with your clients.
Liberty Mutual Insurance Coffee Break 12Questions?
Liberty Mutual Insurance Coffee Break Proprietary & Confidential Information
13America is Driving More Again: 2000-2016
Percent Change, Miles Driven*
3.4%
3.5% 3.1%
2.5% 2.5%
2.5% 2.1%
1.8%
1.5% 1.2% 1.3%
0.8% 0.8%
0.6% 0.6% 0.6%
0.4%
0.5%
-0.5%
-0.7% -0.5%
-1.5% Fastest Growth
Since 2000
-1.8%
-2.5%
2000 2002 2004 2006 2008 2010 2012 2014 2016
Tremendous Growth In Miles Driven.
The More People Drive,
The More Frequently They Get Into Accidents.
*2000-2015: Moving 12-month total vs. prior year. 2016 data through July 2016, the latest available, vs. July 2015.
Sources: Federal Highway Administration; National Bureau of Economic Research (recession dates); Insurance Information Institute.
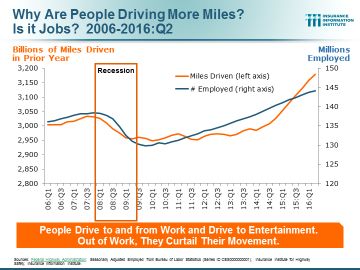
Liberty Mutual Insurance Coffee Break 14Why Are People Driving More Miles?
Is it Jobs? 2006-2016:Q2
Billions of Miles Driven in Prior Year MILLIONS
EMPLOYED
3,200 RECESSION 150
Miles Driven (left axis) # Employed (right axis)
3,150
145
3,100
140
3,050
3,000 135
2,950
130
2,900
125
2,850
2,800 120
06:Q1
06:Q3
07:Q1
07:Q3
08:Q1
08:Q3
09:Q1
09:Q3
10:Q1
10:Q3
11:Q1
11:Q3
12:Q1
12:Q3
13:Q1
13:Q3
14:Q1
14:Q3
15:Q1
15:Q3
16:Q1
People Drive to and from Work and Drive to Entertainment.
Out of Work, They Curtail Their Movement.
Sources: Federal Highway Administration; Seasonally Adjusted Employed from Bureau of Labor Statistics (Series ID CES0000000001); Insurance
Institute for Highway Safety; Insurance Information Institute.
Liberty Mutual Insurance Coffee Break 15You can also read