PLANNING FOR THE RECOVERY - Adam Sacks President Tourism Economics December 2020
←
→
Page content transcription
If your browser does not render page correctly, please read the page content below
PLANNING FOR THE RECOVERY

Adam Sacks
President
Tourism Economics
adam@tourismeconomics.com

                            December 2020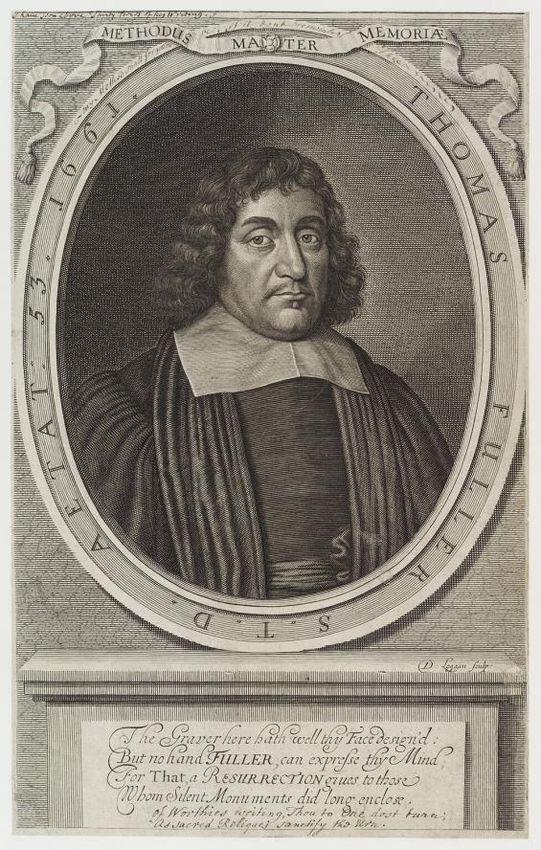
“It is said that the darkest hour of the
night comes just before the dawn.”

Thomas Fuller, 1608-1661
English churchman and historian

Penned within a travelogue of the Holy Land

Died at age 53 of epidemic infectious disease
The worst of times
US COVID Deaths and Hospitalizations
Deaths                                                                           Hospitalized
2,500                                                                                    100,000
                                                                                         90,000
                                                Deaths (7-day MA)
2,000                                                                                    80,000
                                                Hospitalized (right)                     70,000
1,500                                                                                    60,000
                                                                                         50,000
1,000                                                                                    40,000
                                                                                         30,000
 500                                                                                     20,000
                                                                                         10,000
   -                                                                                     -
         3/1     4/1     5/1      6/1     7/1      8/1      9/1    10/1   11/1    12/1

       Source: The Atlantic, The COVID Tracking Project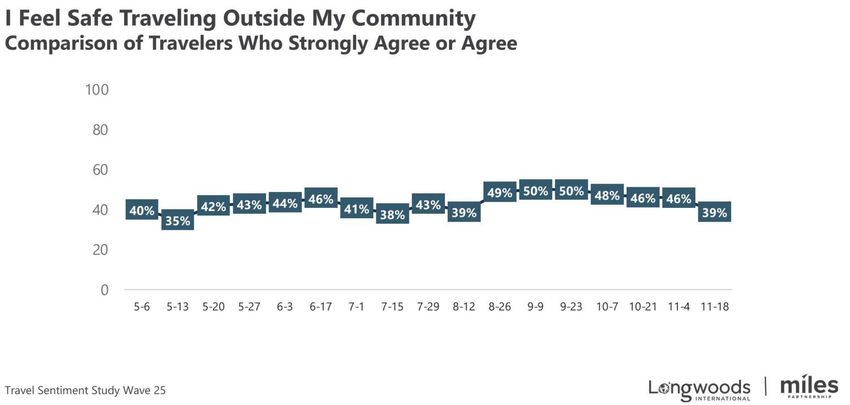
…but the best of times may be in sight
Travel improvement through the summer, then weakening

 Virginia monthly travel spending
 $ millions, year-over-year change

  $400                                                                               20%
                          Change from last year             Percent change
    $0                                                                               0%

 -$400                                                                               -20%
 -$800
                                                                                     -40%
-$1,200                                               -40%     -39%   -41%   -40%
                                           -45%
           -48%                                                                      -60%
-$1,600                             -54%

-$2,000
                                                                                     -80%
                            -78%
                   -86%
-$2,400                                                                              -100%
           Mar     Apr      May     Jun     Jul       Aug      Sep    Oct     Nov
                                                                             (thru
                                                                             28th)
 Source: Tourism
 Source: U.S.     Economics
              Travel Association, Tourism Economics
Three snapshots of the travel landscape

Travel performance
Year-over-year % change

  40%

  20%

   0%

 -20%                                                                          Auto trips (-23%)
                                                                               Hotel room demand (-30%)
 -40%

 -60%                                                                          Air pax (-58%)

 -80%

-100%
        Jan   Feb    Mar       Apr   May   Jun   Jul   Aug   Sep   Oct   Nov

Source: TSA, Arrivalist, STR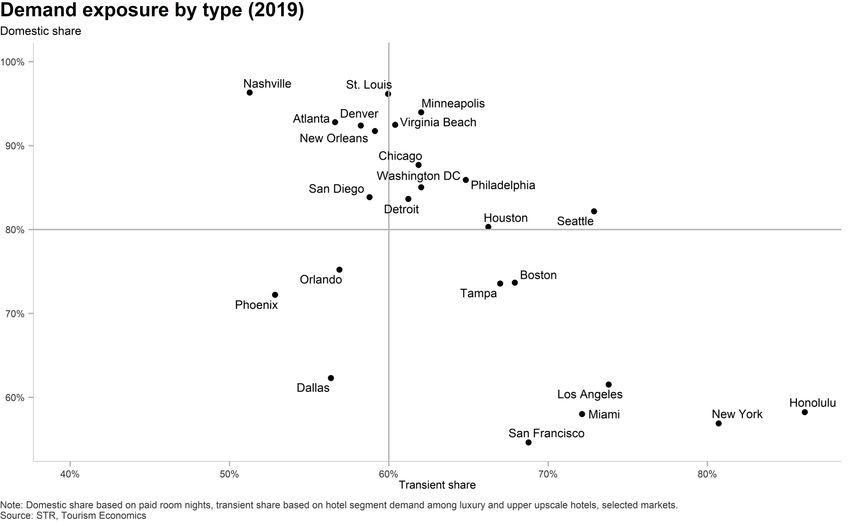
The more rural, the better

 Travel spending losses by state                                                 RevPAR by hotel category
 Year-over-year % change, March-Nov. 728h                                        US, YTD September, total room inventory basis
   0%
                                                                                                   -50%                US

                                                                                                                       Chain scale
  -20%
                                                                                               -65%                    Luxury
                                                                                               -65%                    Upper upscale
                                                                                                  -54%                 Upscale
  -40%                                                                                               -45%              Upper midscale
                                                                                                        -35%           Midscale
                        Best 10 markets                                                                    -23%        Economy
                                                                                                     -44%              Independents
  -60%
                                                                                                                       Location
                                                                                               -66%                    Urban
  -80%                                                        Worst 10 markets                    -53%                 Airport
                                                                                                   -49%                Resort
                                                                                                    -46%               Suburban
                                                                                                       -34%            Small Metro/Town
 -100%                                                                                                 -33%            Interstate
                                                                                    -100%             -50%        0%
 Source: Tourism Economics                                                       Source: STR
         Source: U.S. Travel Association, Tourism Economics
Travel confidence remains low… and is trending down
How will the economy influence the travel recovery?
Half of jobs restored; the other half will be harder
Unemployment rate still near recession peaks

US: U3 unemployment rate
     %
16                                                             Apr:
                                                               14.7%
14

12                          10.8%
                                                       10.0%
10                 9.0%
                                      7.8%
 8   7.1%
              6.1%                              6.3%                     Oct:
                                                                         6.9%
 6

 4

 2                                                             Average of 6
                                                               prior recessions

 0
  1960      1970          1980      1990     2000      2010        2020

Source: Oxford Economics/Haver Analytics
Participation rate at its lowest since the 1970s US: Labor force participation rate % 69 67 65 63 Lowest since 1977 61 59 57 1949 1959 1969 1979 1989 1999 2009 2019 Source: Oxford Economics/Haver Analytics
US economic recovery scenarios

                                   Scenario            Headline            Probability
                                                Scientific advances           15%
                                 Rapid upturn   produce dramatic boost

                                                Vaccine in 2021Q1,            60%
                                   Baseline     economy accelerates in
                                                2021
                                                W-shaped recovery as          25%
                                  Return to     global infections spike,
                                 lockdowns      reversing economic gains
The importance of fiscal aid
US: The income risk from expiring fiscal aid
Total personal income, change relative to February, $bn
4,000
Includes tax rebates
Transfers to households (other)
($1,200 checks) Unemployment benefits
Other income
3,000 Compensation
Total
2,000 Forecast
Includes federal UI
top-up ($600/week)
1,000
0
-1,000 Lost Wage
Supplements
Payment
(5-weeks)
-2,000
Jan-20 Mar-20 May-20 Jul-20 Sep-20 Nov-20
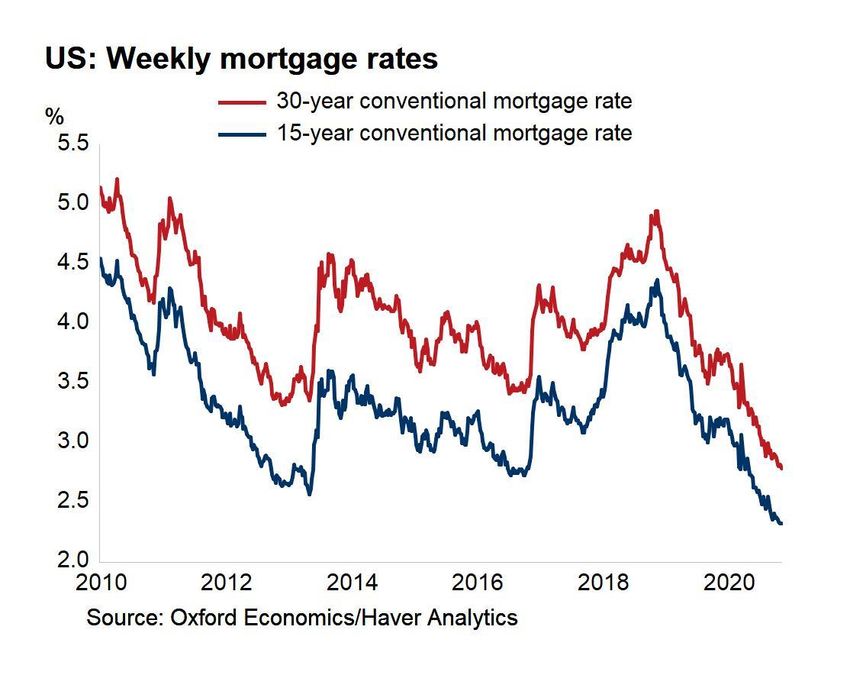
Source: Oxford Economics/Haver AnalyticsFed policy acting as wind in the sails
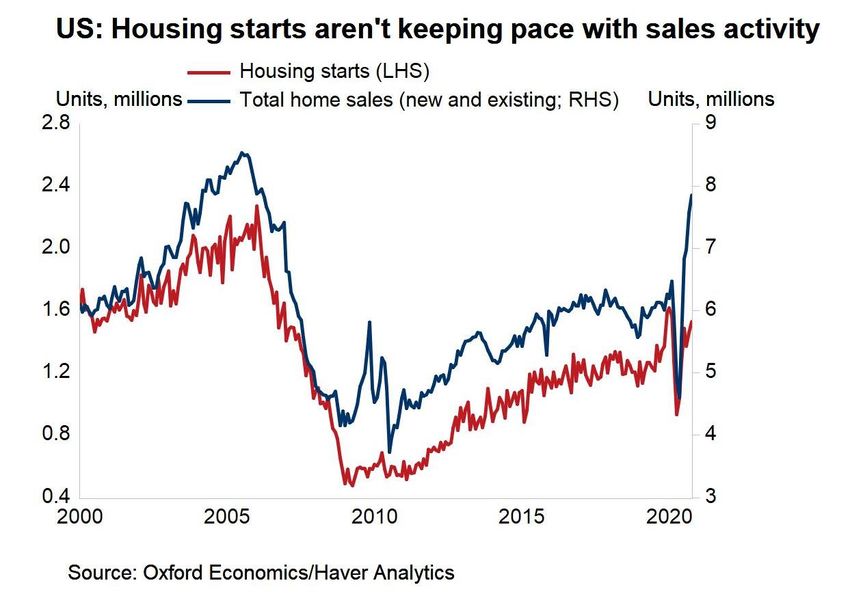
Housing activity remains very buoyant
Savings still elevated, providing temporary buffer
When will travel recover?
Assumptions: Baseline

• 2021 Q1
  • Difficult start to year. Concerted efforts to get disease under control
  • Vaccine distribution accelerates in earnest
• 2021 Q2
  • Vaccination programs make a meaningful impact
  • Through ramp-up of vaccination programs, compliance with public health guidance, and improved testing,
    disease prevalence declines, immunity rises, and cases decline
  • Assume by the end of 2021 Q2, Covid-19 infection rates are low
  • Leisure travel picks up headed into summer
• 2021 Q3
  • Post-Labor Day, context for business travel and group events has normalized substantially. Corporate travel
    restrictions are eased. Group events are permitted in most areas, though certain restrictions continue.
  • With US perceived as substantially “safe from COVID”, group and business travel returns strongly (group
    demand recovering to about 20%-30% below 2019 levels in 2021Q4)
Will higher income households support recovery?
Share of leisure lodging spending by
income
40%
39%
Households earning $100k+
account for 24% of
households… but 59% of
leisure spending on lodging
21%
20%
Unemployment rate (October):
14% 15%
13% 14%
13% • High school grad: 8.1%
11%
• Bachelor’s or higher: 4.2%
Less than $40k $40k to $70k $70k to $100k $100k to $150k $150k and
more
Share of households Share of spending
Note: Lodging spending is based on recent three-year average (2015 to 2018). Consumer
spending represents leisure trips. Pre-tax annual income, in thousands.
Source: BLS; Tourism EconomicsHigh income earners least impacted by the crisis
US: Share of workers who can telework by wage
level, in %
Earnings greater than the 75th
61.5
percentile
Earnings from 50th to 75th
37.3
percentiles
Earnings from 25th to 50th
20.1
percentiles
Earnings less than or equal to the
9.2
25th percentile
0 25 50 75 100
Source: Bureau of Labor Statistics/Oxford EconomicsRebound in consumer spending driven by low-income families
US: Consumer credit and debit card spending
% difference from January 2020
10
5
0
-5
-10
-15
-20 Low Income
-25 Middle Income
-30 High income
-35
-40
J F M A M J J A S O N
Source: Oxford Economics/Opportunity Insights/Haver AnalyticsGroup demand recovery factors
Positive factors Impediments
• Pent-up demand (postponed events, • Uncertain planning horizons
desire to reconnect) • Event and travel restrictions related to
• Importance of meetings to disease containment
organizations such as associations • Risk aversion by participants
(primary revenue source, required
organizational duties) • Organization travel policies and legal
considerations that restrict travel
• Potential to host some events in
modified formats (e.g., hybrid, • International travel policies
reduced attendance) • Economic uncertainty and budget
• Flexibility on the part of venues constraints (particularly exhibitors and
seeking to facilitate professionally participants)
managed events where safe and • Dislocation in airlift
legally permitted • Potential for hybrid events to reduce
• Many events are already scheduled physical attendance levels during
for 2022 transition periodMarket exposures will impact recovery
Greatest group exposure
Most resilient
Greatest international exposure
Least resilientLeisure travel will fuel the recovery
Business and leisure trips
Index (2019=100)
120
100
100 100 101
105
99
108
Leisure back to 2019 levels
93
80 90
85 in 2022
76
60
40 49 Business nearly back in
40
2024
20
0
2019 2020 2021 2022 2023 2024
Business Leisure
Note: Only domestic trips
Source: Tourism
Source: Economics
U.S. Travel Association, Tourism EconomicsApproximately three years to recover room demand levels
Room demand: US
Quarters relative to trough, level relative to prior peak
20%
8 quarters to
10% recover prior peak
Prior peak level
0% Room revenue is
12 quarters to
-10% recover prior peak
expected to recover
Next year: 2021 Q4 to its prior peak level
-20%
in early 2024, about
-30% four years after prior
peak.
-40% Today: 2020 Q4
-50%
-60% 2020 Q2
-70%
-4 -2 Trough 2 4 6 8 10 12 14 16 18
◼ Global Financial Crisis ◼ Global Coronavirus Recession
Source: STR; Tourism Economics…but the second half of next year will look very different
Room demand
Quarterly, relative to 2019
10% 2023 Q2
0% 1% 0%
0%
0% 0%
-3% -3%
-10% -5% -4%
-9%
-12%
-14%
-20%
-23%
-30%
-32%-33% Strong recovery in 2021H2 to
-34%
-40% demand levels about 10%
below 2019
-50%
-60% -57%
-70%
Q4 Q1 Q2 Q3 Q4 Q1 Q2 Q3 Q4 Q1 Q2 Q3 Q4 Q1 Q2 Q3 Q4
2020 2021 2022 2023
Source: STR; Tourism Economics
* Total room inventory RevPAR is calculated without removing temporarily closed hotels. On a
standard RevPAR basis, growth is forecasted as -47.0% in 2020 and 25.0% in 2021.Forecast has remained quite stable
STR-TE Forecast evolution
Total-room-inventory RevPAR relative to 2019, US
March May June August November
We still expect 2021 RevPAR
will be down about one-third
relative to 2019.
-20.8%
-30.5%
-34.3% -34.2%
-37.1%
-50.6% -49.5%
-52.3%
-58.0% -57.5%
2020 2021
Note: Graph shows the STR-TE forecast releases since March 2020. The March 2020 forecast did not include a forecast of
RevPAR on a total-room-inventory basis and the forecast room revenue decline has been shown as a proxy.
Source: STR and Tourism EconomicsDomestic trips nearly back in 2022, international will take longer
Domestic and international trips
Index (2019=100)
120
100 106
100 100 102
98 96
80 85
82
60 69 66
40
42
20 24
0
2019 2020 2021 2022 2023 2024
Domestic International
Source: Tourism
Source: U.S. TravelEconomics
Association, Tourism EconomicsLeisure spending returns by 2024
Travel expenditures – return to peak
Index (2019=100)
120
100
100 100 101
95
90
80 88 87
78
74
60
60
52
40
42
20
0
2019 2020 2021 2022 2023 2024
Business Leisure
Note: Domestic and international travel expenditures
Source: U.S.
Source: Tourism
TravelEconomics
Association, Tourism EconomicsRecovery after a pandemic: 14-17 months
2003 SARS outbreak in Hong Kong 2003 SARS outbreak in Singapore
International arrivals (thousands) International arrivals (thousands)
1,500 800
14 months from crisis to recovery 12 Month Average 17 months from crisis to recovery 12 Month Average
1,362,000 lost arrivals Lost Arrivals 1,472,000 lost arrivals Lost Arrivals
700
1,000
600
500
500
0 400
Jan-02 Jul-02 Jan-03 Jul-03 Jan-04 Jul-04 Jan-05 Jul-05 Jan-06 Jan-02 Jul-02 Jan-03 Jul-03 Jan-04 Jul-04 Jan-05 Jul-05 Jan-06
Source: Tourism Economics Source: Tourism Economics80% of travellers indicate return within six months of virus containment
How long to return to travel 'as usual' after the pandemic has subsided?
50% 47%
February Survey April Survey June survey September survey
45%
40%
34%
35% 32%
30% 28%
25%
20%
15% 15%
14%
15%
10% 8%
5%
4%
5%
0%
Not wait at all Wait 1-2mths Wait ~6mths Wait ~1yr Not travel in foreseeable
Source: IATA futureHow do we advocate for
the industry during this
crisis?Reminder: the travel sector was a leader of VA job growth
L&H employment in Virginia
Index (2010=100)
125
VA L&H
+20%
120
115
+11%
110
VA
105
100
2010 2011 2012 2013 2014 2015 2016 2017 2018 2019
Source: BLSIndustry in crisis: no sector has been hit as hard at travel
Virginia employment loss by industry
% of industry lost since February
Leisure & hospitality 18%
Mining & logging 9%
Education & health services 7%
Manufacturing
Information
Government
Professional & business services
Other services
Financial activities
Trade, transportation, and utilities
Construction
-5% 0% 5% 10% 15% 20%
Source: BLSEnormous impact on government finances
Virginia tax revenue losses on travel spending
$ millions, year-over-year change
$0
-$100
-$200
-$203
-$300
-$312
-$400
$515 mn and counting
-$500
Mar-Jun
Jul
-$600
Aug
Sep
-$700
Oct
-$708
Nov (thru 28th)
-$800
Federal State Local
Source: Tourism EconomicsTravel must be our focus for an economic recovery
Virginia employment share of employment loss
% of all jobs lost since February
Leisure & hospitality 38%
Education & health services 19%
Government 14%
Professional & business services
Manufacturing
Trade, transportation, and utilities
Financial activities
Other services
Information
Mining & logging
Construction
-10% 0% 10% 20% 30% 40% 50%
Source: BLSWill there be an enduring
legacy of this crisis?
Gratitude.THANK YOU!
Adam Sacks
President
Tourism Economics
adam@tourismeconomics.com
December 2020You can also read