Measuring and managing odours: Technical and practical issues
←
→
Page content transcription
If your browser does not render page correctly, please read the page content below
Measuring and
managing odours:
Technical and practical issues
Nick Jones, OdourNet UK Ltd
Scope
Provide a technical definition of ‘odour nuisance’ and describe the key
factors that contribute to its development.
Describe how each of these factors can be considered and how the
risk of odour nuisance impact can be assessed in practical terms.
Briefly explain how data obtained from such assessments can be used
to assist legal cases, and in defining odour management and control
solutions.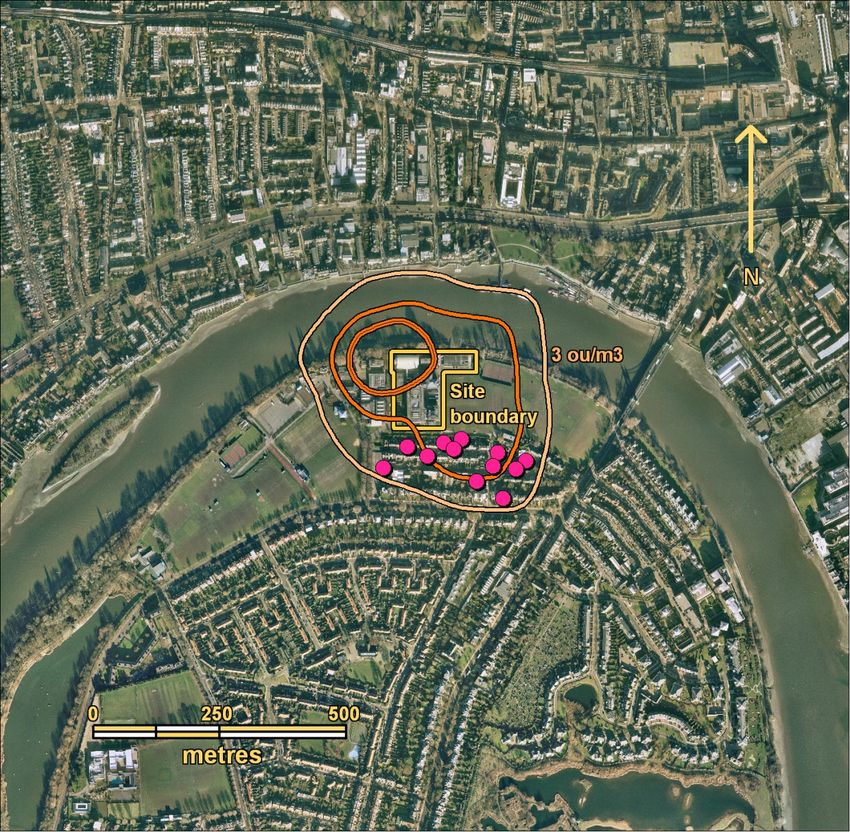
What is ‘odour nuisance’?
In technical terms, the commonly applied definition
for odour nuisance is:
‘…the cumulative effect on humans, of repeated events
of annoyance caused by exposure to odours, over an
extended period of time, that leads to modified or
altered behaviour.’
Important points to take from that definition are:
Odour nuisance is not a push button reaction.
Exposure generates a negative reaction.
Behavioural changes elicited by nuisance can be
passive or active.
Factors that influence development
In practical terms, the main factors that determine the development
of nuisance can be usefully summarised by the acronym FIDOL.
Frequency of exposure.
Intensity (or strength) of exposure.
Duration of exposure.
Offensiveness or character of odour.
Location sensitivity.
Development of nuisance is therefore directly influenced by:
Characteristics of the odours released from a given source.
The effects of atmospheric dispersion and dilution as odours travel
from the source to the point of detection.
The characteristics of the person or persons exposed.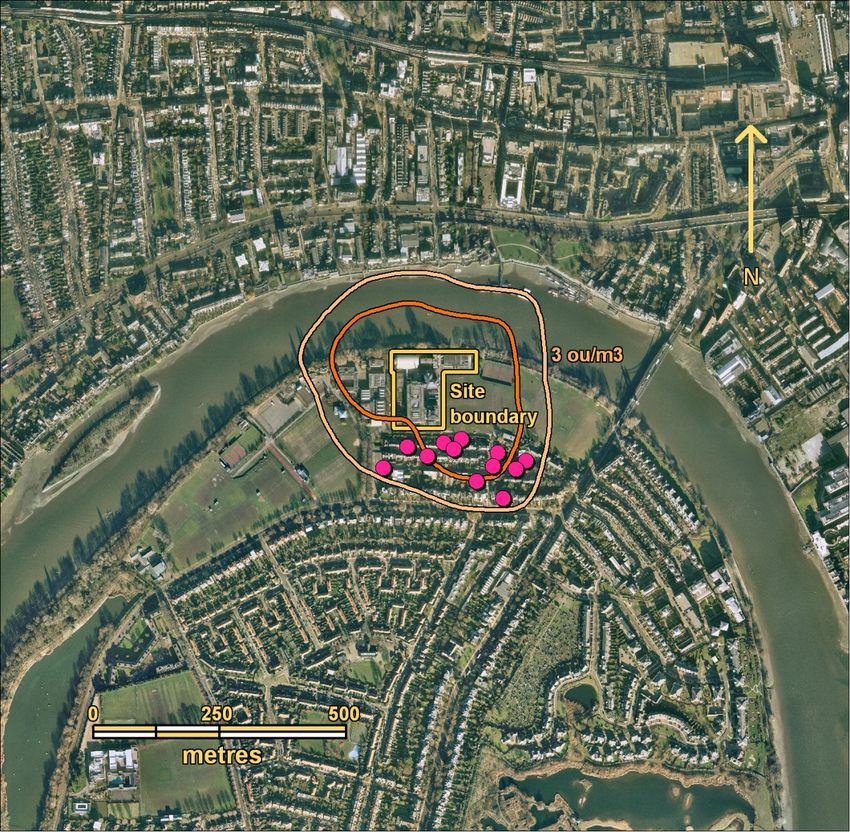
Factors to consider during assessment
Source characteristics Atmospheric dispersion Receptor sensitivity
Nature of each activity Wind speed and direction Type (residential / industrial)
The type of odour released Atmospheric turbulence Context
The quantity of odour Distance to receptor Exposure history
released
Perception towards source
Frequency and duration of
release
Identification of odour sources
The first step to assessment is to identify specific
operations or activities that have the potential to
generate odours that will be detectable offsite.
Define the physical characteristics of the source and
mechanism for release (e.g. location, dimensions,
source type, etc).
Define the operational factors that influence odour
generation and release e.g.
Operational hours.
Processing rates.
Start-up and shut down.
Process variability.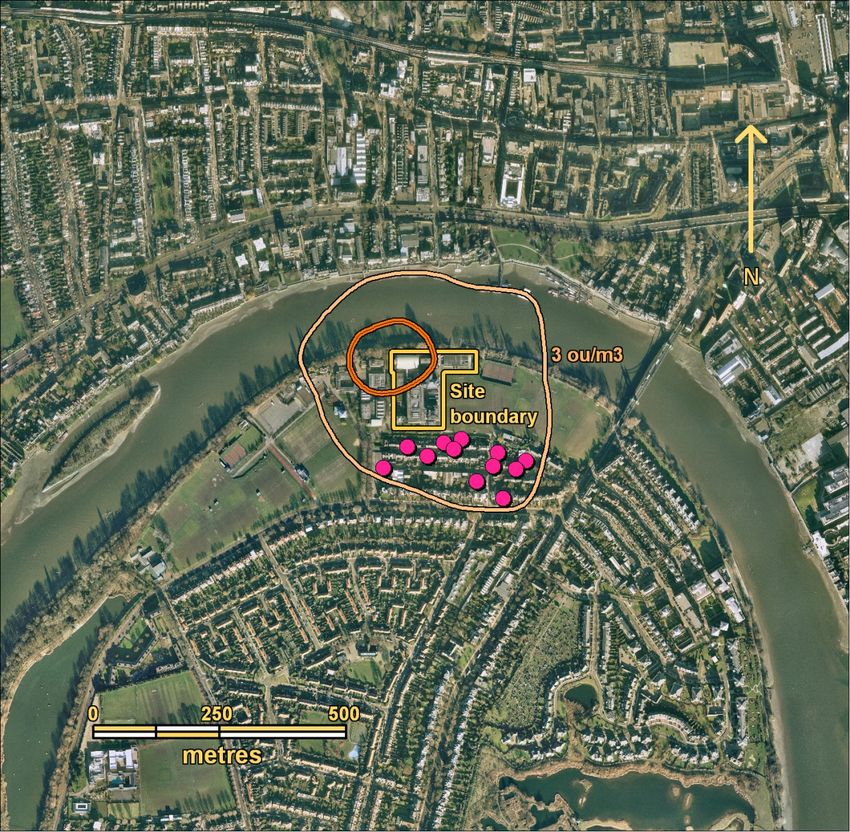
Source characterisation
Once the basic characteristics of each source have been defined, it is then
necessary to quantify and characterise the odorous emissions released.
Our primary interest is to characterise the odours in terms that are
relevant to human impact. i.e.
Source strength (concentration and mass emission rate).
Character of the odour and potential offensiveness.
It is also important to define the physical and chemical characteristics of
each source (e.g. flow rate of air; temperature and moisture content;
chemical composition) as these factors have an influence on dispersion
and provide important information that can greatly assist in the
development of odour management and treatment solutions.
Measurement of source strength
The preferred method for determining source strength is
a sensory technique know as olfactometry (BSEN13725).
This is an ‘at source’ measurement technique that is
applicable to a broad range of source types.
Olfactometry involves the determination of the overall
concentration of an odour sample by presentation to a
panel of observers with known acuity to odour in
laboratory conditions.
The odour concentration is expressed in multiples of
European Odour Units (ouE), which is similar in concept
to a ‘dilution to threshold’.
Once the concentration of the odour is defined, a mass
emission rate can be determined by multiplying it by the
flow rate of air released from the source.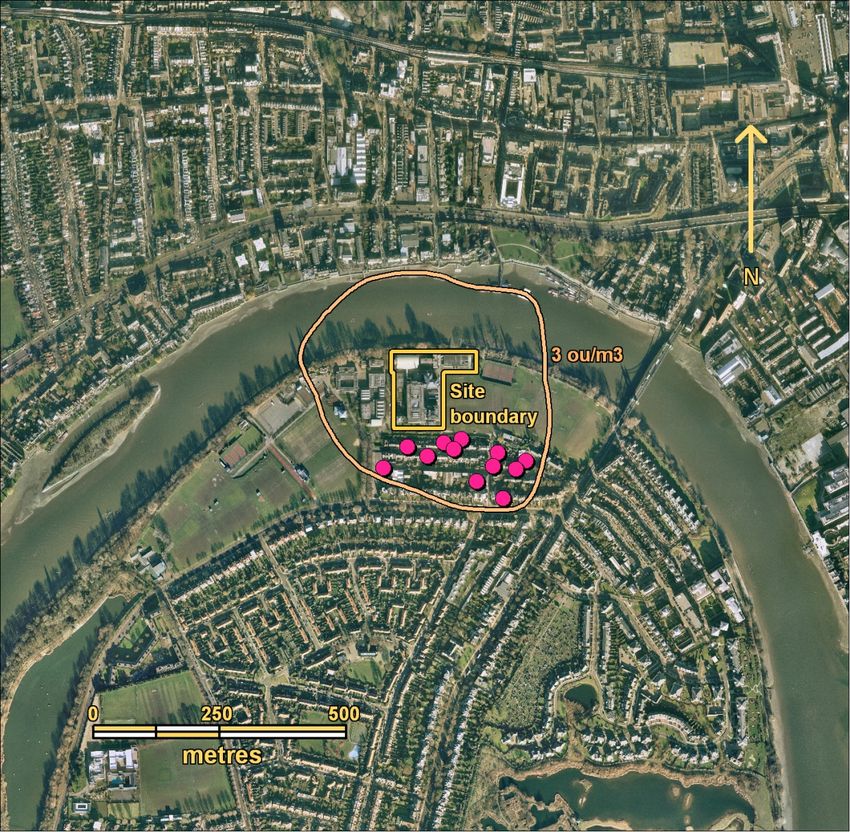
Odour character and offensiveness
The fundamental principals of olfactometry (i.e. the use of trained panellists
to appraise odours) can also be applied to good effect to obtain data on the
character and potential offensiveness of source odours.
The most commonly applied techniques from this perspective are:
Odour quality analysis, which describes odours by reference to a set of
standardised descriptors.
Hedonic tone analysis, which describes the relative unpleasantness or
pleasantness of an odour by reference to a neutral gas.
It should be noted that it is often possible to obtain a sufficient level of
understanding of the character and offensiveness of the odours released
through the application of common sense and by reference to published
literature.
Analysis only tends to be required for unusual or particularly complex
odour sources (e.g. food processes).
Alternative techniques
In some circumstance, it is not possible to measure odours directly using
olfactometry (e.g. where access is restricted or for inherently diffuse
sources such as land-filling operations).
In these cases, source strength can be estimated remotely by use of field
assessment techniques.
This approach involves direct monitoring of the plume of odour generated
by the source to determine its extent of detection down wind under defined
meteorological conditions. This data is then used to back calculate an
emission term using a dispersion model.
The main practical drawback of the approach is that many different
conditions need to be considered to arrive at robust source estimates, and a
fully standardised approach for conducting assessment is not currently
available. A CEN standard is however under development.
Assessment of atmospheric dispersion
Once odour emissions generated from the facility have
been characterised, this data can be used to
investigate the level of odour exposure that is likely to
occur around the site over the long term.
This is achieved by use of mathematical models that
simulate the effect of atmospheric dispersion that
occurs as odours travel from the point of release to the
receptor.
In order to ensure all potential meteorological
conditions are considered, dispersion modelling is
typically conducting using between 3 to 5 years of
actual meteorological data.
It is clearly important to ensure that the data chosen is
representative of the study site.
Odour impact assessment
The assessment of the impact risk is conducted by comparing the
outputs of the dispersion model to a suitable odour impact criterion.
Odour impact criteria essentially define a statistical dose of odour at
which there is a risk of development of nuisance.
This dose is typically described using the technical notation
C98, 1-hour = x ouE/m3 where:
x is the limit concentration (in European odour units);
The subscript ‘1-hour’ refers to the averaging time over which the
concentration is calculated.
The subscript 98 refers to the statistical basis which should be used to
derive concentration values from modelled data (percentile).
When applied to the model output, the area where odour exposure
levels have the potential to generate ‘nuisance’ is defined.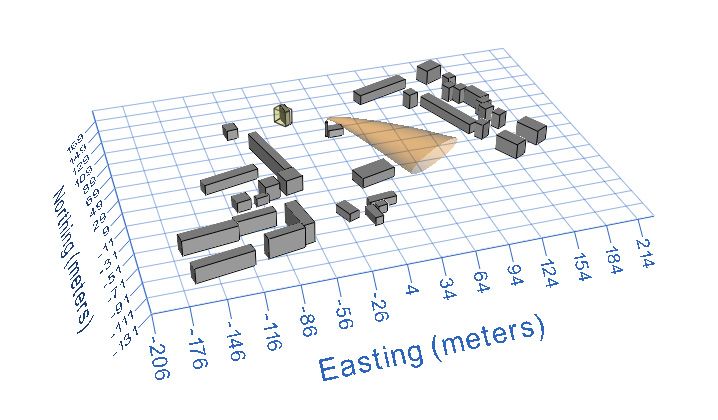
Odour impact criteria and FIDOL
All five elements of FIDOL are reflected within the odour impact criterion to
some extent.
The Frequency and Duration of exposure elements of FIDOL are
represented by the percentile element of the criterion.
The Intensity, Offensiveness and Location sensitivity elements are
represented by the concentration element of the criterion.
Variations in the offensiveness of odours and in receptor sensitivity can
therefore be reflected by varying the concentration element of the criterion.
However, it is important to note that impact criteria tend to be derived from
empirical studies which consider the potential for impact to the most
sensitive members of the population. As a result adjustments to reflect
receptor sensitivity tend to be rare.
Examples of impact criteria
Criterion Application Source
C98, 1hour = 5 ouE/m3 ‘Complaints’ criterion for sewage odours UK planning
3
C98, 1hour = 1.5 ouE/m Indicative criterion for highly offensive odours UK EA
3
C98, 1hour = 3 ouE/m Indicative criterion for moderately offensive odours UK EA
C98, 1hour = 6 ouE/m3 Indicative criterion for low offensive odours UK EA
UK criteria compare favourably with criterion from other European states that
tend to fall within the range of C98, 1hour = 0.5 ouE/m3 to C98, 1hour = 10 ouE/m3.
What’s the use?
The obvious application of this assessment approach from a legal
perspective is to assist in determining whether adverse impact or ‘nuisance’
has occurred.
From this perspective, it is however important to note that technical
assessments of odour impact risk may not be directly or fully compatible
with regulatory or legal requirements.
The outputs of such assessment should therefore be used to inform such
decisions, but conclusions should be drawn by consideration of evidence as
a whole (e.g. officer observations; complaints data, etc).
A more important application of odour surveys is to gain an understanding
of the problem; since once we understand it we have the ability to solve it.
Example 1: Problem definition
Emission hierarchy
Source Nature ouE/s %
Material Odour A / B 12,000 8%
reception
Process A1 Odour A 36,000 24%
Process A2 Odour A 39,000 26%
Process B1 Odour B 25,500 17%
Process B2 Odour B 30,000 20%
Packaging Odour C 7,500 5%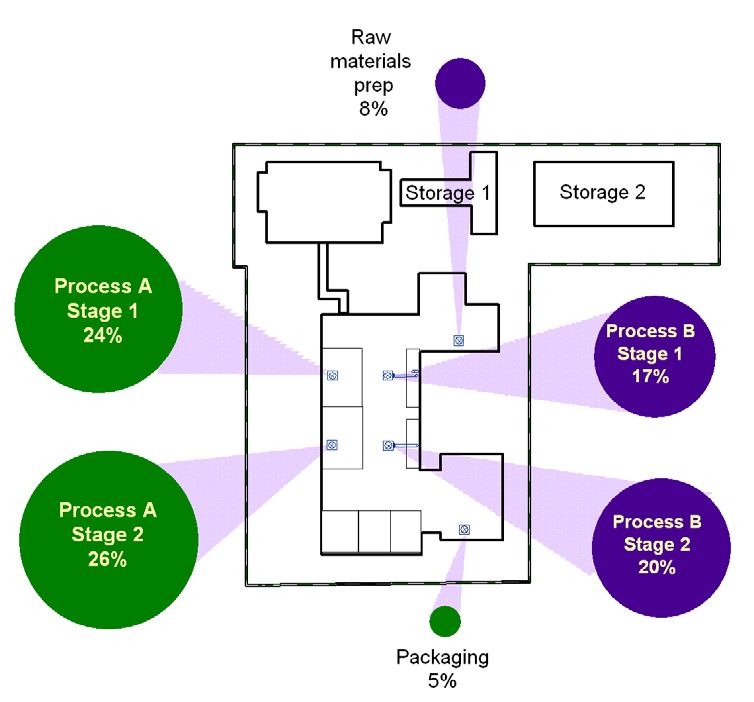
Example 1: Problem definition
                     Emission hierarchy
                     Source          Nature                ouE/s     %

                     Material        Odour A / B           12,000    8%
                     reception
                     Process A1      Odour A               36,000    24%
                     Process A2      Odour A               39,000    26%

                     Process B1      Odour B               25,500    17%
                     Process B2      Odour B               30,000    20%
                     Packaging       Odour C               7,500     5%

                     Complaint Log
                     Date                          Observation

                     22/5/2010                     Odour D
                     27/05/2010                    Odour A all day
                     01/6/2010                     Odour A
                     02/06/2020                    Odour A
                     03/06/2010                    Odour D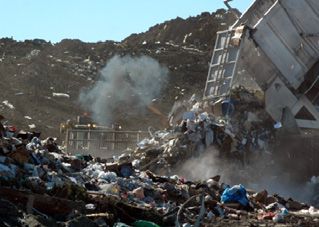
Example 2: Nuisance impact assessment
                         Assessing / predicting
                         extent of nuisance risk.

                                Location of
                                complaints

Example 2: Nuisance impact assessment
                         Assessing / predicting
                         extent of nuisance risk.
                         Figure presents the isopleths (i.e
                         lines of equal odour exposure)
                         which correlate to:

                         C98, 1-hour = 1.5 ouE/m3 (green)
                         C98, 1-hour = 3 ouE/m3 (orange)
                         C98, 1-hour = 6 ouE/m3 (blue)
Example 3: Impact assessment
Assessing / predicting
extent of nuisance risk.
Area of potential
impact
In this example it can be seen
that complaints correlate well with
predicted exposure levels of C98,
1-hour > 3 ouE/m
3
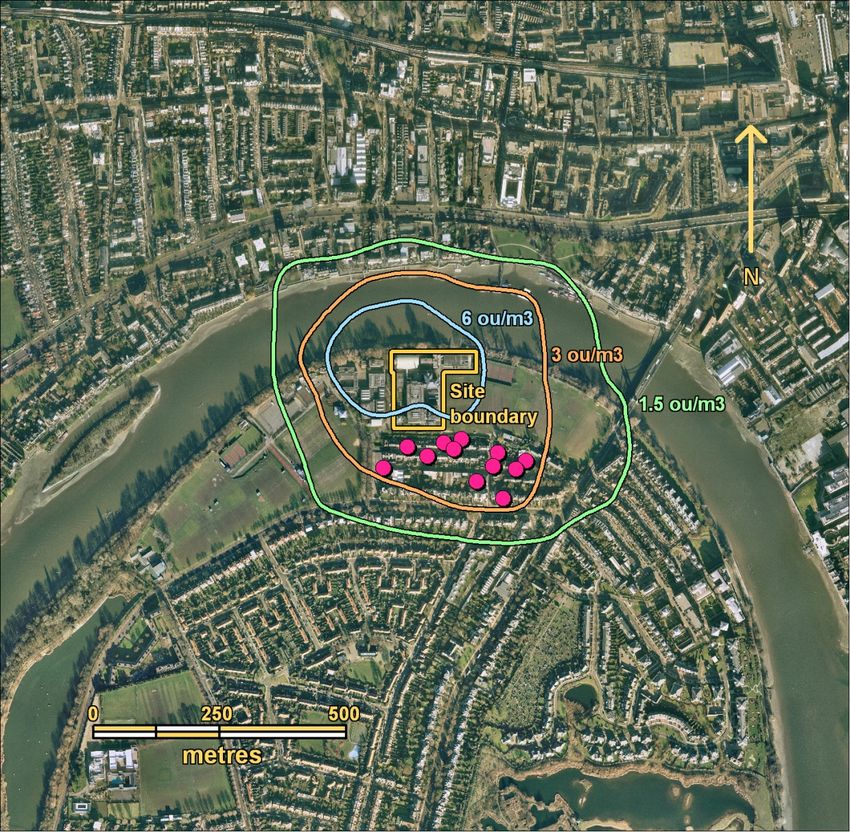
Example 3: Investigating control options
Option 1
Increase stack
height
Pale orange colour represents
C98, 1-hour = 3 ouE/m3 isopleth for
baseline scenario
Deep orange colour represents
C98, 1-hour = 3 ouE/m3 isopleth for
Option 1Example 3: Investigating control options
Option 2
Treat emissions
from Process A
Pale orange colour represents
C98, 1-hour = 3 ouE/m3 isopleth for
baseline scenario
Deep orange colour represents
C98, 1-hour = 3 ouE/m3 isopleth for
Option 2
Example 3: Solution appraisal (impact)
Comparison of options
Treat emissions
from Process B
Figure presents C98, 1-hour = 3
ouE/m3 for baseline, Option 1 and
Option 2.
Option 1 is clearly the preferred
optionExample 4: Selecting treatment options
Characteristics of odour source
Component Assumption
Emission concentration Approx. 20,000 ouE/m3
Flow rate to treatment Approx. 15 Nm3/s
Moisture content Approx. 70% relative humidity
Temperature Up to 100 oC
Chemical components Insoluble organic compounds
Options appraisal
Technique Odour Flow? Chemical Physical Overall
concentration? composition? characteristic? suitability
Carbon filter
Chemical scrubbing
Biofiltration
Incineration
Example 4: Selecting treatment options
Characteristics of odour source
Component Assumption
Emission concentration Approx. 20,000 ouE/m3
Flow rate to treatment Approx. 15 Nm3/s
Moisture content Approx. 70% relative humidity
Temperature Up to 100 oC
Chemical components Insoluble organic compounds
Options appraisal
Technique Odour conc? Flow? Chemical Physical Overall
composition? composition? suitability
Carbon filter √
Chemical scrubbing √
Biofiltration √
Incineration √Example 4: Selecting treatment options
Characteristics of odour source
Component Assumption
Emission concentration Approx. 20,000 ouE/m3
Flow rate to treatment Approx. 15 Nm3/s
Moisture content Approx. 70% relative humidity
Temperature Up to 100 oC
Chemical components Insoluble organic compounds
Options appraisal
Technique Odour conc? Flow? Chemical Physical Overall
composition? composition? suitability
Carbon filter √ √
Chemical scrubbing √ √
Biofiltration √ √
Incineration √ X
Example 4: Selecting treatment options
Characteristics of odour source
Component Assumption
Emission concentration Approx. 20,000 ouE/m3
Flow rate to treatment Approx. 15 Nm3/s
Moisture content Approx. 70% relative humidity
Temperature Up to 100 oC
Chemical components Insoluble organic compounds
Options appraisal
Technique Odour conc? Flow? Chemical Physical Overall
composition? composition? suitability
Carbon filter √ √ √
Chemical scrubbing √ √ √
Biofiltration √ √ X
Incineration √ XExample 4: Selecting treatment options
Characteristics of odour source
Component Assumption
Emission concentration 20,000 ouE/m3
Flow rate to treatment 30 Nm3/s
Moisture content 70% relative humidity
Temperature Up to 100 oC
Chemical components Insoluble organic compounds
Options appraisal
Technique Odour conc? Flow? Chemical Physical Overall
composition? composition? suitability
Carbon filter √ √ √ X
Chemical scrubbing √ √ √ √
Biofiltration √ √ X X
Incineration √ X √ √
Example 4: Selecting treatment options
Characteristics of odour source
Component Assumption
Emission concentration Approx. 20,000 ouE/m3
Flow rate to treatment Approx. 15 Nm3/s
Moisture content Approx. 70% relative humidity
Temperature Up to 100 oC
Chemical components Insoluble organic compounds
Options appraisal
Technique Odour conc? Flow? Chemical Physical Overall
composition? composition? suitability
Carbon filter √ √ √ X X
Chemical scrubbing √ √ √ √
Biofiltration √ √ X X X
Incineration √ X √ √ XSummary
The technical definition of nuisance provides us with a foundation from
which to objectively assess odour impact risk that is independent of
regulatory / operator / complainant opinion.
The techniques offer a valuable approach for investigating the cause of
nuisance; identifying and evaluating solutions, and defining effective odour
management strategies.
Care must be exercised by applying the techniques for legal purposes.You can also read