Quantitative Evaluation of Perfume Fleuressence Samples using the zNose
←
→
Page content transcription
If your browser does not render page correctly, please read the page content below
http://www.estcal.com/TechPapers/TestingPerfumes.doc
Quantitative Evaluation of Perfume Fleuressence
Samples using the zNose
Edward J. Staples, Electronic Sensor Technology
Electronic Noses
Conventional electronic noses (eNoses) produce a recognizable response pattern
using an array of dissimilar but not specific chemical sensors. Electronic noses have in-
terested developers of neural networks and artificial intelligence algorithms for some
time, yet physical sensors have limited performance because of overlapping responses
and physical instability. eNoses cannot separate or quantify the chemistry of aromas.
A new type of electronic nose, called the zNose, is based upon ultra-fast gas
chromatography, simulates an almost unlimited number of specific virtual chemical sen-
sors, and produces olfactory images based upon aroma chemistry. The zNose is able
to perform analytical measurements of volatile organic vapors and odors in near real time
with part-per-trillion sensitivity. Separation and quantification of the individual chemi-
cals within an odor is performed in seconds. Using a patented solid-state mass-sensitive
detector, picogram sensitivity, universal non-polar selectivity, and electronically variable
sensitivity is achieved. An integrated vapor preconcentrator coupled with the electroni-
cally variable detector, allow the instrument to measure vapor concentrations spanning 6+
orders of magnitude. In this paper a portable zNose, shown in Figure 1, is shown to be
a useful quality control tool for quantifying the concentration of chemicals used in 25 ba-
sic fleuressence aromas as well as a perfumery mixture or designer perfume. A ‘good’
perfume aroma as determined by a trained perfumery technician can be easily quantified
in near real time. The ‘good’ chemical signature once defined allows for objective and
quantitative quality control testing with zNose analyzers integrated into the perfume
production process.
Figure 1- Portable zNose technology incorporated into a handheld instrument.
1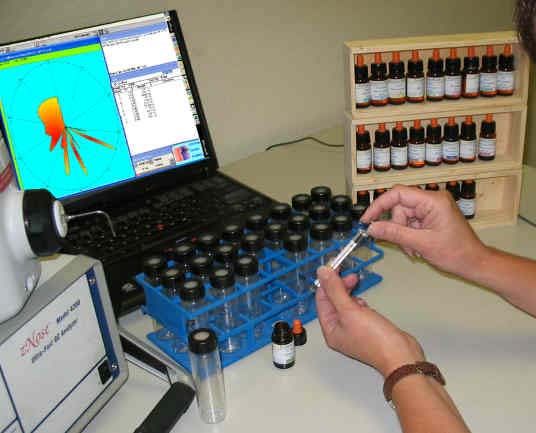
http://www.estcal.com/TechPapers/TestingPerfumes.doc

How the zNose™ Quantifies the Chemistry of Aromas
       A simplified diagram of the zNose™ system shown in Figure 2 consists of two
parts. One section uses helium gas, a capillary tube (GC column) and a solid-state de-
tector. The other section consists of a heated inlet and pump, which samples ambient air.
Linking the two sections is a “loop” trap, which acts as a preconcentrator when placed in
the air section (sample position) and as an injector when placed in the helium section (in-
ject position). Operation is a two step
process. Ambient air (aroma) is first sam-
pled and organic vapors collected (precon-
centrated) on the trap. After sampling the
trap is switched into the helium section
where the collected organic compounds are
injected into the helium gas. The organic
compounds pass through a capillary column
with different velocities and thus individual
chemicals exit the column at characteristic
times. As they exit the column they are
detected and quantified by a solid state de-
tector.
      An internal high-speed gate array mi-
croprocessor controls the taking of sensor      Figure 2- Simplified diagram of the zNose™
data which is transferred to a user interface   showing an air section on the right and a he-
                                                lium section on the left. A loop trap precon-
or computer using an RS-232 or USB con-         centrates organics from ambient air in the
nection. Aroma chemistry, shown in              sample position and injects them into the he-
Figure 3, can be displayed as a sensor          lium section when in the inject position.
spectrum or a polar olfactory image of odor
intensity vs retention time. Calibration is accomplished using a single n-alkane vapor
standard. A library of retention times of known chemicals indexed to the n-alkane re-
sponse (Kovats indices) allows for machine independent measurement and compound
identification.

           Figure 3- Sensor response to n-alkane vapor standard, here C6-C14, can be
            displayed as sensor output vs time or its polar equivalent olfactory image.

                                                  2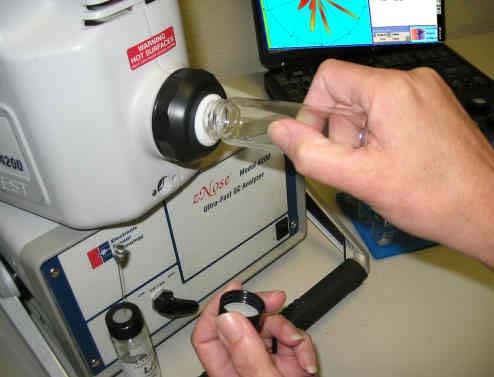
http://www.estcal.com/TechPapers/TestingPerfumes.doc

Chemical Analysis (Chromatography)
       The time derivative of the sen-
sor spectrum (Figure 3) yields the
spectrum of column flux, commonly
referred to as a chromatogram. The
chromatogram response (Figure 4) of
n-alkane vapors (C6 to C14) pro-
vides an accurate measure of reten-
tion times. Graphically defined re-
gions shown as red bands calibrate
the system and provides a reference
time base against which subsequent
chemical responses are compared or
indexed. As an example, a response
midway between C10 and C11 would             Figure 4 - Chromatogram of n-alkane vapors C6 to C14).
have a retention time index of 1050.

Flueressence Samples
      A set of primary odor perfume compound bases containing one or more aroma
chemicals can act as a set of basic fleuressence groups useful for perfume compounding.
Fleuressence bases are prime olfactory notes from which complex perfume aromas can be
created. A perfumery training kit with 25 fleuressence bases representing a set of prime
notes was obtained from Perfumers World http://www.perfumersworld.com). The bases
and their aroma note descriptor or names are listed in Table I.

               Table I- Fleuressence Bases

          A   Aldehyde      N   Narcotic
          B   Iceberg       O   Orchid
          C   Citrus        P   Phenolic
          D   Dairy         Q   Balsamic
          E   Edible        R   Rose
          F   Fruits        S   Spice
          G   Green         T   Tar/Smoke
          H   Herb          U   Animalic
          I   Iris          V   Vanilla
          J   Jasmine       W   Wood
          K   Konifer       X   Musk
          L   Linalool      Y   Yeast/Mossy               Figure 5- Perfumery training kit
          M   Muguet        Z   Zolvent

                                                 3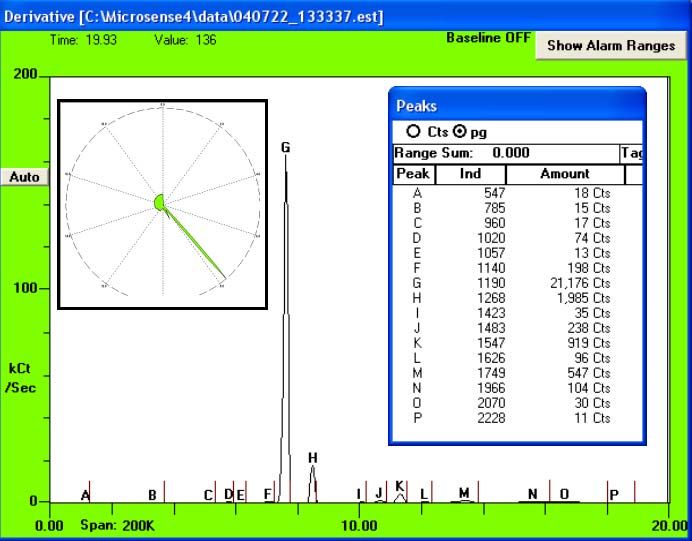
http://www.estcal.com/TechPapers/TestingPerfumes.doc
Aroma Testing Methods
Injecting a small amount of
fleuressence base into a septa-sealed
vial produces a known concentration
of vapor, which can then be sampled
by the zNose vapor analyzer.
Internal temperatures of the analyzer
are set to 160oC and 200oC for the
vapor inlet. A short one-second
sample time (0.5 mL) is best when
using undiluted base materials.
Figure 6- Testing materials are 40 mL septa sealed
vials, a 1-10 µL syringe, fleuressence samples, and a
zNose vapor analyzer.
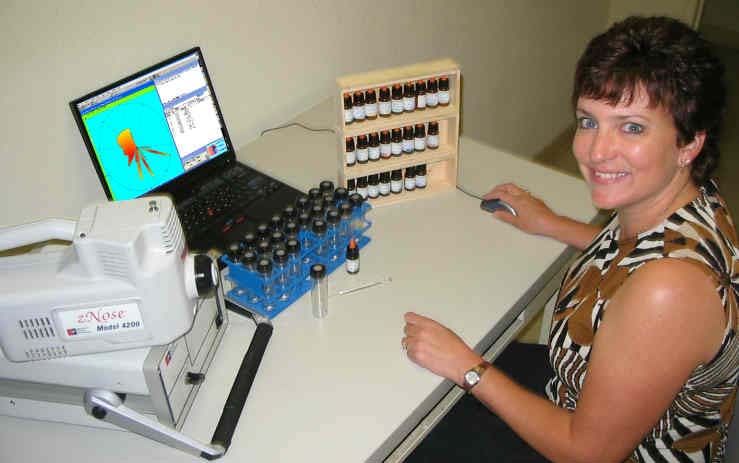
Figure 8- Step two is to inject 2 µL of fleures-
Figure 7- Step one is draw 2 µL from Fleures-
sence through septa and into 40 mL to create
sence vial into a clean syringe.
vapor sample.
Figure 9- Step 3 is to attach vial to inlet of Figure 10- Removing septa cap and press-
zNose. A sample needle works well for ing vial against Teflon face of zNose inlet
volatile compounds. Above C12 compounds enables direct sampling of high molecular
begin to condense onto the walls of the rela- weight compounds by the 200oC inlet of the
tively cool sample needle. zNose.
4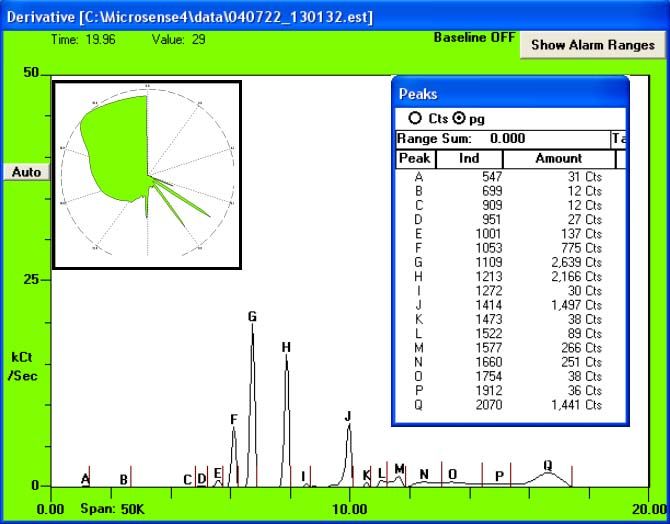
http://www.estcal.com/TechPapers/TestingPerfumes.doc
Experimental Results
For all vapor samples tested the column (a db624) was temperature programmed to
rise from 40oC to 160oC at 10oC/second and data acquisition (chromatogram) time was
20 seconds. A detector temperature of 60oC was used unless stated otherwise.
A. Aldehyde
The vapors from the aldehyde fleuressence base produced two primary compounds
with indices of 1104 and 1332 and concentration counts of 4,519 and 11,114 respectively.
Significant other compounds at much lower concentrations had indices of 1016, 1234,
1438, 1516, and 1584. The Vaporprint image shows aroma concentration (radial) vs
retention time (angle) with 0 and 20 seconds at the top of the figure 11.
Figure 11- Chromatogram of Aldehyde fleuressence
5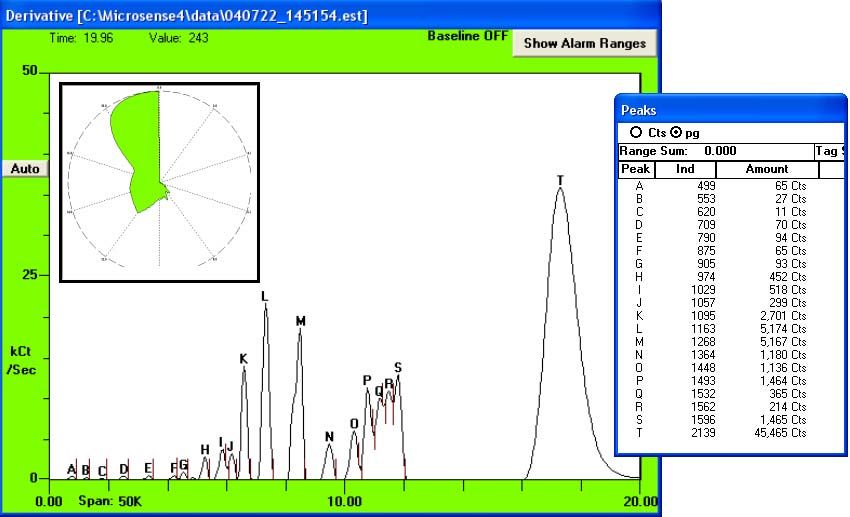
http://www.estcal.com/TechPapers/TestingPerfumes.doc

B. Iceberg
      The iceberg fleuressence contained a single major compound with an index of 1225
and a concentration of 20,007 counts. A minor secondary compound with an index of
1062 and a concentration of 1,800 counts was also detected.

                          Figure 12- Chromatogram of Iceberg fleuressence

C. Citrus
      The citrus fleuressence contained a single major compound (limonene) with an in-
dex of 1057 and a concentration of 17,929 counts. Minor secondary compounds with in-
dices of 947, 1002, 1275, and 1405 were also detected.

                           Figure 13- Chromatogram of Citrus fleuressence.

                                                6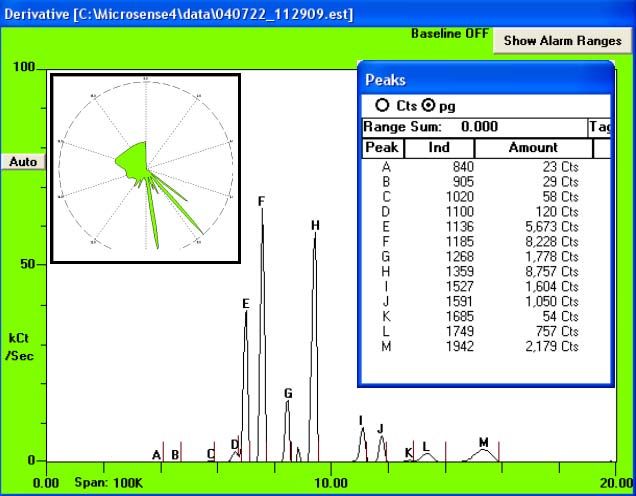
http://www.estcal.com/TechPapers/TestingPerfumes.doc
D. Dairy
The dairy fleuressence contained two major compound peaks with indices of 1452
and 1583 and concentrations of 3,823 and 2,965 counts respectively. Significant minor
compounds with indices of 603, 1058, 1279, 1393 and 1651 were also detected. The
rounded portion of the Vaporprint image is associated with the presence of high mo-
lecular weight compounds.
Figure 14- Chromatogram of Dairy fleuressence.
E. Edible
The edible fleuressence contained two major closely spaced compound peaks with
indices of 1097 and 1120 and concentrations of 2,752 and 3,832 counts respectively.
Significant minor compounds with indices of 805, 965, 1274 and 1398 were also de-
tected.
Figure 15- Chromatogram of edible fleuressence.
7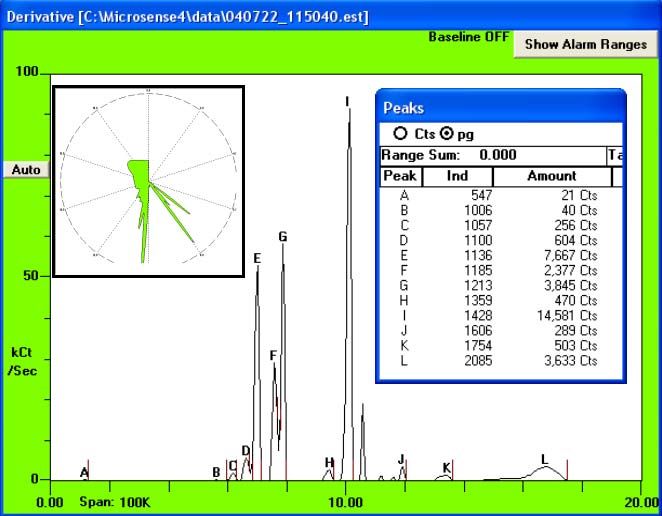
http://www.estcal.com/TechPapers/TestingPerfumes.doc

F. Fruit
      The fruit fleuressence contained three major compound peaks with indices of 1111,
1329, and 1461 and concentrations of 34,982, 22,317 and 19,439 counts respectively.
Significant minor compounds with indices of 830, 1054, 1219, 1274, 1542, 1651, 1804,
and 1994 were also detected.

                         Figure 16- Chromatogram of Fruit fleuressence.

G. Green
      The green fleuressence contained a major compound peak with an index of 910 and
a concentration of 6565 counts. Significant minor compounds with indices of 1093,
1120, 1224, 1269, 1339, 1402, 1443, 1511, 1565, 1637, 1723, and 1858 were also de-
tected.

                          Figure 17- Chromatogram of Green fleuressence.

                                                8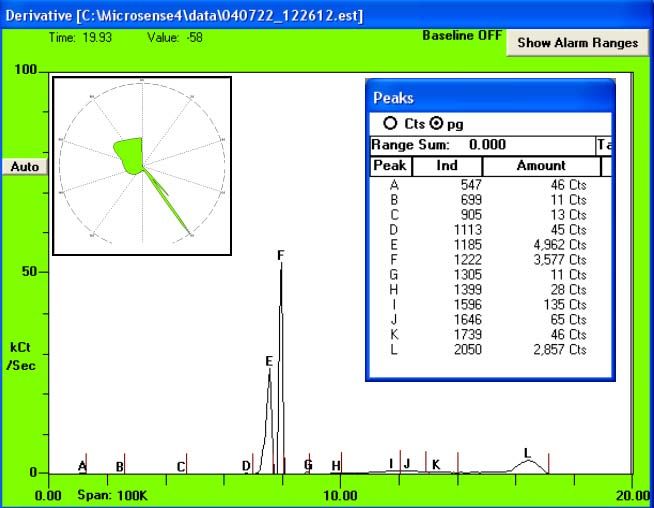
http://www.estcal.com/TechPapers/TestingPerfumes.doc

H. Herb
      The herb fleuressence contained a major compound peak with an index of 1139 and
a concentration of 47,348 counts. Significant minor compounds with indices of 693, 910,
952, 1010, 1062, 1209, 1283, 1407, 1556, and 1587 were also detected

                           Figure 18- Chromatogram of Herb fleuressence.

I. Iris
     The iris fleuressence contained major compound peaks with indices of 1484 and
1533 and concentrations of 15,717 and 72,716 counts respectively. Significant minor
compounds with indices of 830 and 1366 were also detected.

                         Figure 19- Chromatogram of Iris fleuressence.

                                                 9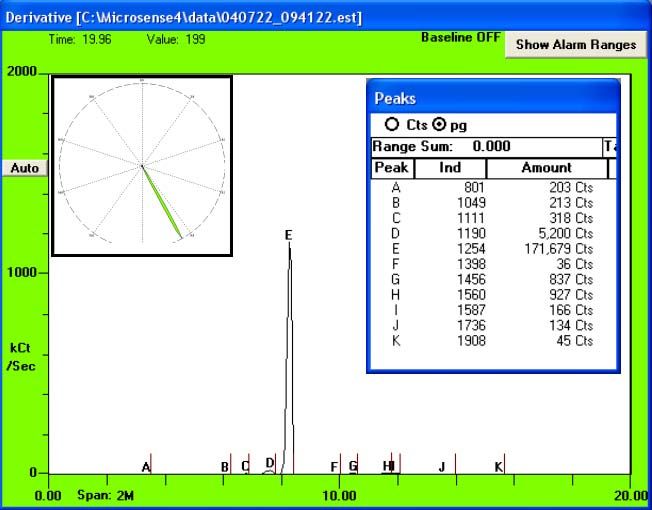
http://www.estcal.com/TechPapers/TestingPerfumes.doc

J. Jasmine
      The jasmine fleuressence contained a major compound peak with an index of 1224
and a concentration of 34,912. Significant minor compounds with indices of 910, 1028,
1115, 1316, 1366, 1434, and 1470 were also detected.

                           Figure 20- Chromatogram of jasmine fleuressence.

K. Konifer
      The konifer fleuressence contained a major compound peak with an index of 1254
and a concentration of 171,679 counts. Significant minor compounds with indices of
1049, 1111, 1190, 1456, and 1560 were also detected

                                                10
http://www.estcal.com/TechPapers/TestingPerfumes.doc
L. Linalool
The linalool fleuressence contained a major compound peak with an index of 1140
and a concentration of 73,221 counts. No significant minor compounds were detected.
Figure 22- Chromatogram of linalool fleuressence.
M. Muguet
The muguet fleuressence contained major compound peaks with indices of 1136,
185, 1268, and 1359 and with peak concentrations of 5,673, 8,228, 1,778, and 8,757
counts respectively. Significant minor compounds with indices of 1100, 1527, 1591,
1749, and 1942 were also detected.
Figure 23- Chromatogram of Muguet fleuressence.
11http://www.estcal.com/TechPapers/TestingPerfumes.doc
N. Narcotic
The narcotic fleuressence contained major compound peaks with indices of 1136,
1185, 1213, and 1428 with peak concentrations of 7667, 2377, 3845, and 14,581 counts
respectively. Significant minor compounds with indices of 1057, 1100, 1359, 1606,
1754, and 2085 were also detected
Figure 24- Chromatogram of narcotic fleuressence.
O. Orchid
The orchid fleuressence contained major compound peaks with indices of 1213,
1479, and 1601 and with peak concentrations of 2436, 17386, and 38,257 counts respec-
tively. Significant minor compounds with indices of 775, 905,1057, 1113, 1140, 1419,
1532, and 1764 were also detected.
Figure 25- Chromatogram of orchid fleuressence.
12http://www.estcal.com/TechPapers/TestingPerfumes.doc
P. Phenolic
The phenolic fleuressence contained major compound peaks with indices of 1185,
and 1222 and with peak concentrations of 4,962 and 3,577 counts respectively. Signifi-
cant minor compounds with indices of 1596 and 2050 were also detected.
Figure 26- Chromatogram of phenolic fleuressence.
Q. Balsamic
The balsamic fleuressence contained major compound peaks with indices of 1053,
1109, 1213, and 1414 and with peak concentrations of 775, 2639, 2166, and 1497 counts
respectively. Significant minor compounds with indices of 1001, 1577 and 2070 were
also detected.
Figure 27- Chromatogram of balsamic fleuressence.
13http://www.estcal.com/TechPapers/TestingPerfumes.doc
R. Rose
The rose fleuressence contained a single major compound with an index of 1190
and a peak concentration of 21,176 counts. Significant minor compounds with indices of
1140, 1268, and 1547 were also detected
Figure 28- Chromatogram of rose fleuressence.
S. Spice
The spice fleuressence contained a single major compound peak with an index of
1423 and a peak concentration of 53,246 counts. Significant minor compounds with in-
dices of 1140, 1355, 1518, 1672 and 1772 were also detected.
Figure 29- Chromatogram of spice fleuressence.
14http://www.estcal.com/TechPapers/TestingPerfumes.doc
T. Tar and Smoke
The tar and smoke fleuressence contained major compound peaks with indices of
1095, 1163, 1268 and 2139 and with peak concentrations of 2701, 5174, 5167 and 45,465
counts respectively. Significant minor compounds with indices of 709, 790, 905, 974,
1029, 1057, 1364, 1449, 1493, 1532, 1562 and 1596 were also detected.
Figure 30- Chromatogram of tar and smoke flueressence.
U. Animalic
The animalic fleuressence contained major compound peaks with indices of 1140,
1433, 1483, 1517, 1557, 1774, and 2085 and with peak concentrations of 16,484, 12,631,
12,300, 2,027, 3,871, 9,207 and 8,944 counts respectively. Significant minor com-
pounds with indices of 919, 1006 and 1057 were also detected.
Figure 31- Chromatogram of animalic fleuressence.
15http://www.estcal.com/TechPapers/TestingPerfumes.doc
V. Vanillin
The vanillin fleuressence contained major compound peaks with indices of 1433
and 1577 and with peak concentrations of 9,548 and 3,891 counts respectively. Signifi-
cant minor compounds with indices of 1527 and 2085 were also detected.
Figure 32- Chromatogram of vanillin fleuressence
W. Wood
The wood fleuressence contained major compound peaks with indices of 1483 and
1774 and with peak concentrations of 38,447 and 34,171 counts respectively. Significant
minor compounds with indices of 1053, 1145, 1581, and 1700 were also detected.
16http://www.estcal.com/TechPapers/TestingPerfumes.doc
X. Musk
The musk fleuressence contained major compound peaks with indices of 1591 and
1685 and with peak concentrations of 5,572 and 6,570 counts respectively. Significant
minor compounds with indices of 983, 1086, 1140, 1226, and 1305 were also detected.
Figure 34- Chromatogram of Musk fleuressence.
Y. Yeast-Mossy
The yeast-mossy fleuressence contained major compound peaks with indices of
1209, 1234, and 2084 and with peak concentrations of 19,575, 1,190 and 60,211 counts
respectively. Significant minor compounds with indices of 924, 1036, 1081, 1097, 1429,
1678, and 1750 were also detected
Figure 35- Chromatogram of yeast-mossy fleuressence.
17http://www.estcal.com/TechPapers/TestingPerfumes.doc
Z. Zolvent
This solvent base mix produces a much lower concentration aroma than the fleures-
sence bases so the analysis was done with a 20oC detector and a 10-second sample of
headspace vapors from 3 mL of zolvent in a 40 mL vial.
Figure 36- Chromatogram of Zolvent mixing solution.
Summary of Vaporprint Olfactory Images
Olfactory images from all twenty-five fleuressence bases are shown in figure37 for
visual comparison.
Figure 37- Summary of fleuressence olfactory images.
18http://www.estcal.com/TechPapers/TestingPerfumes.doc
Channel Number 5 Perfume
This popular perfume was testing using the same method used on the fleuressence
bases e.g. 2 µl in 40 mL vial, 1-second sample, 60 oC detector and 10oC/second column
ramp rate. The perfume contained a major compound peak with an index of 1,135 and a
concentration of 4,578 counts. Many significant minor compounds were also clearly evi-
dent and some did not easily separate using this fast method.
Figure 38- Chromatogram of Channel No. 5.
Slowing the analysis method using a 3oC/second column ramp allowed the perfume
compounds to be better defined and separated while reducing the detector temperature to
20 oC improved the sensitivity to volatile compounds. This analysis reveals approxi-
mately 18 minor compound peaks in addition to the primary aroma compound (index
1130).
Figure 39- Chromatogram of Channel No. 5 aroma Figure 40- Expanded scale showing trace elements
using slower method. of Channel No. 5 perfume.
19http://www.estcal.com/TechPapers/TestingPerfumes.doc
Summary
Chemical profiling of aroma fleuressence samples judged to represent 25 basic
olfactory notes has been shown to be fast and quantitative using an ultra high speed gas
chromatograph called the zNose. It is possible to quantitively measure quality in a fast
and efficient manner and compare the chemical signature of perfumes created by trained
perfumery technicans. Indexing of retention times for target compounds using an n-
alkane perfume standard provides a convenient method of identification, eleminates the
need for multiple chemical standards, and allows for instrument independent chemical
libraries.
Dynamic headspace analysis using ultra-high speed gas chromatography can be
coupled with sensory data to affect an objective method of classifying perfumes by
fleuressence notes or olfactory images. The chemical image and sensory data can be
subjected to pattern recognition using multivariate analysis, principal component analysis
(PCA) and partial least squares (PLS) methods to determine perfume classications or
model human perception. Proper choice of samples and use of optimized variables as
well as preprocessing of chemical data, including scaling, transformation, and
normaliation, may also prove useful in assessing quality.
. The zNose is a tool which provides perfumery experts the speed, portability,
precision, and accuracy needed for cost-effective quality control measurements. Such
measurements, because they are based upon well known chromatographic methods, can
easily be validated by independent laboratory testing. A ‘good’ perfume aroma as deter-
mined by a trained perfumery technician can now be quantified in near real time. The
‘good’ chemical signature once defined, allows for objective and quantitative quality con-
trol testing with other zNose analyzers integrated into perfume production process often
located in remote geographical locations.
Figure 41- A happy perfumery technician.
20You can also read