Beirut Explosion Structural Assessment of the Explosion Magnitude - Beirut Arab University
←
→
Page content transcription
If your browser does not render page correctly, please read the page content below
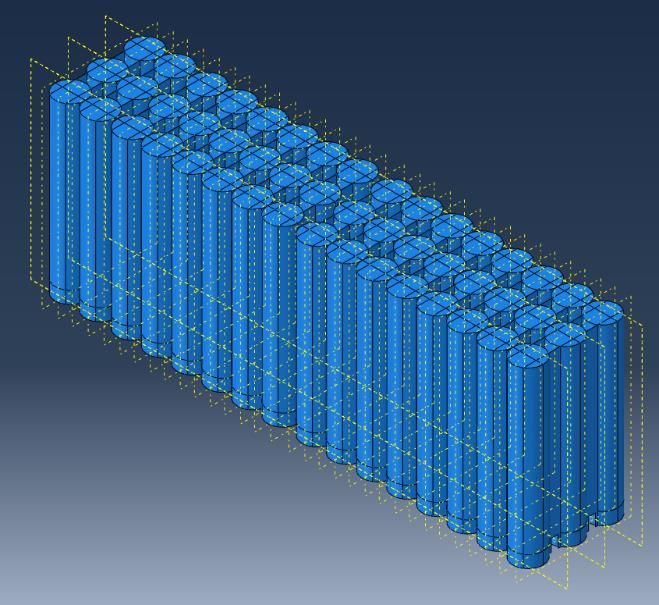
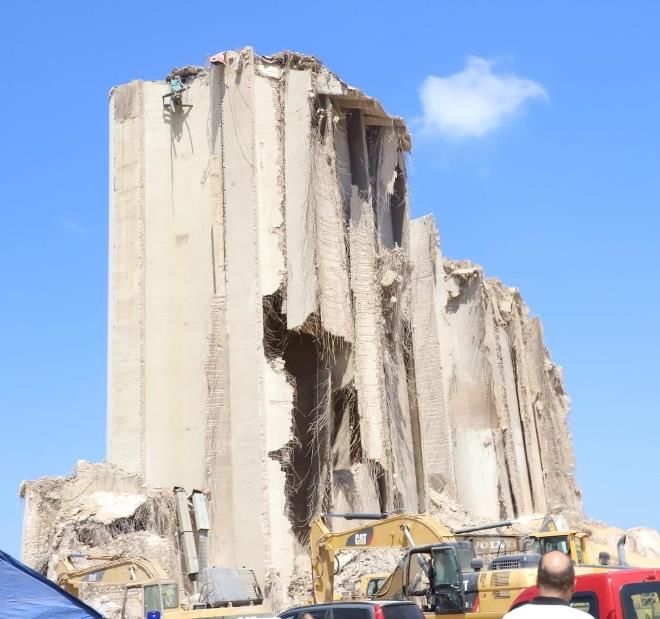
Beirut Explosion
 Structural Assessment of the Explosion Magnitude
 Yehya Temsah1, Ali jahami1*, Bassam Al Timani2, Charles Aouad3
 1Faculty of Engineering, Beirut Arab University, Beirut, Lebanon
 2 Engineering Directorate, Lebanese Army, Beirut, Lebanon
 3 Astrophysics Research Institute, Liverpool John Moores University, Liverpool, UK

 * Corresponding Author email: a.jahmi@bau.edu.lb

Abstract
On August 4th 2020, tremendous explosion occurred in Beirut, Lebanon’s capital, specifically in its port.
The resulting damage was humongous, impacting the city along a radius of about 600m. Series of grains
silos adjacent to the center of the explosion, at 85m proximity, had been importantly damaged. The cause
was anticipated to explosion of Ammonium Nitrate that had been stored in the port, of “said” quantity
equal to 2750t, whereby different opinions have emerged regarding the amount of the explosive materials
and the magnitude of the explosion. The aim of this research work is to define the magnitude of the
explosion, using structural engineering approach throughout non-linear finite element modeling of the
silos. The magnitude of the explosion is defined as the numerical model magnitude that generated the silos
damages. The study is based on silos detailed drawings, data collected from site visits, and the use of the
Conventional Weapons Effects Blast Loading (CONWEP) method. In addition, damage assessment for the
“standing” silos has been conducted and final recommendations are included. This paper shows that the
magnitude of the explosion is significantly smaller than the equivalent TNT of the original declared
quantity of stored Ammonium Nitrate.

Keywords: Beirut explosion, Grain silos, Nonlinear analysis, Ammonium Nitrate, TNT equivalent,
Dynamic analysis

1. Introduction This research project aims to determine the
 magnitude of Beirut explosion by structurally
In recent times, explosions incidents have analyzing the grain silos facing the explosion,
increased in different parts of the world, causing using non-linear finite element numerical
harms to lives and serious damages to analysis of the exact dimensions of the silos,
infrastructure. This attracted the attention of which had been accurately determined from
many researchers in the field of structural existing execution drawings, data collected from
engineering to study the effects of these several sources, and from site visits; and whose
explosions on various structural elements. Beirut material properties, of both concrete and steel
port explosion killed more than 200 people and reinforcement, were determined by samples
wounded more than 6000 people. This explosion extracted from the silos and tested in material
had also incurred extensive damages in the city labs.
of Beirut areas surrounding the port. An
 2. Methodology
important feature of this explosion, as reported
by many media outlets, is the grain silos in Beirut Beirut grain silos (Figure 1) were built in the port
Port, which was said to have protected part of the of Beirut in the late 1960s and were inaugurated
city and its people from the blast. This had drawn in 1970. The silos structure consists of 42
our attention to study the Silos structure and cylinders, with an internal diameter of 8.5 meters
assess the corresponding level of damage (each cylinder), walls thicknesses 17cm, and a
inflicted by the explosion; consequently, height of 48 meters. Over the years, expansion
allowing to determine the magnitude of the and rehabilitation works had been executed. In
explosion. the late 1990s, six new silos were added to the
 main 42 silos. In 2002, due to concrete

 1
carbonization, silos had undergone restoration works.

 Ward-12

 Grain Silos

 Figure 1: Grain silos in port of Beirut

2.1. Geometry and Reinforcement
2.1.1. Original design
The silos construction process was performed in three stages as illustrated in Figures 2 and 3

 Figure 2: Planar dimensions for the grain silos (cm)

 Figure 3: Elevation dimensions for the grain silos (cm)

 2
2.1.2. Internal layout of silos

 3 Silos 16 Silos

 Corridor L.S below Slab 1 level
 Size: 65cm x 17cm

 See Figure 5
 L.S above Slab 1 level

 Figure 5: L.S dimensions below and above Slab 1 level
 Figure 4: Internal division of silos (cm)
 (cm)

2.1.3. Silos reinforcement

 Figure 6: Walls and L.S reinforcement (mm) Figure 7: T.S reinforcement (mm)

 3

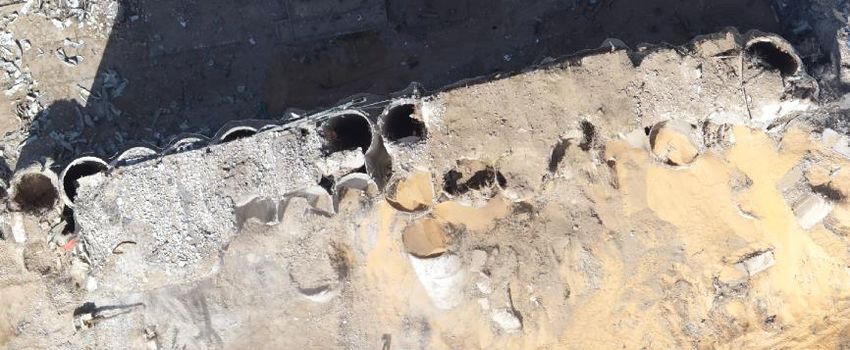
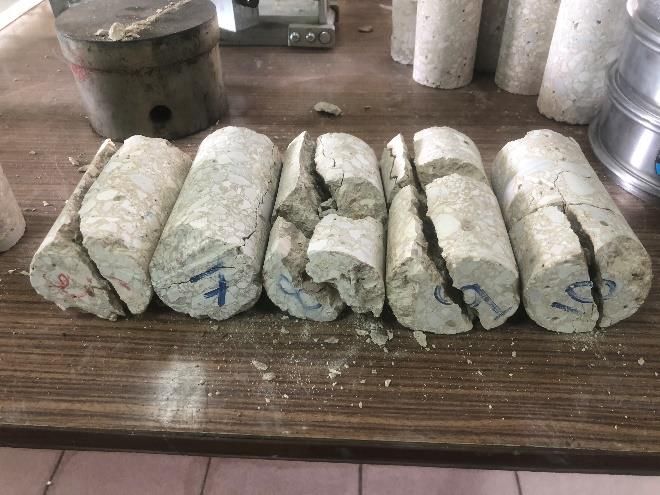
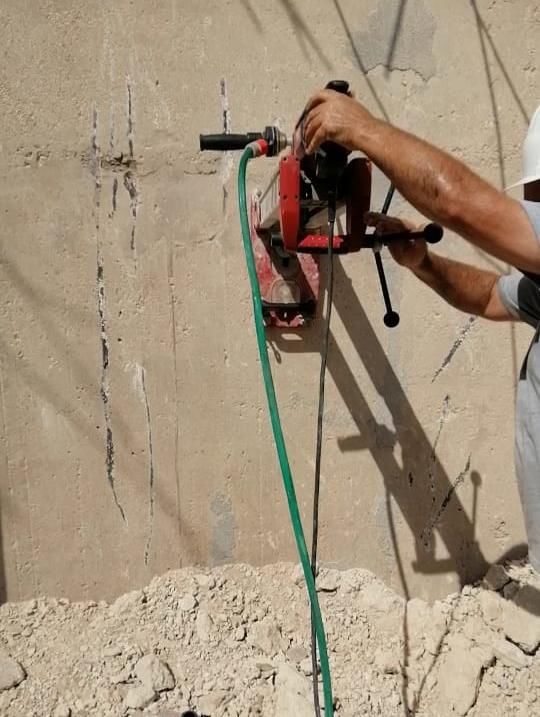
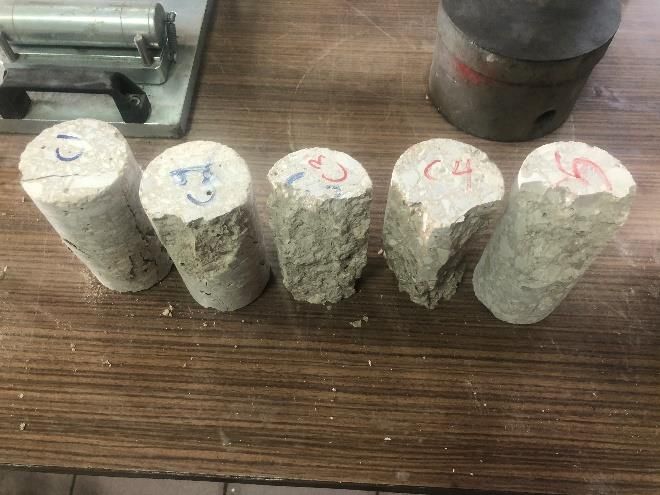
2.1.4. Rehabilitation of Silos
From 2000 to 2002, the silos underwent rehabilitation works due to concrete deterioration in the two
external silos long rows.

 Figure 8: Silos walls’ reinforcement after rehabilitation Figure 9: Section 1-1 for the silo’s wall (mm)
 (mm)

2.2. Material properties
2.2.1. Concrete coring and testing
Concrete properties of silos were determined based on experimental procedure. Site visit was conducted
to extract concrete cores for material testing as shown in Figure 10.

 Figure 10: Concrete coring Figure 11: Core testing

 4
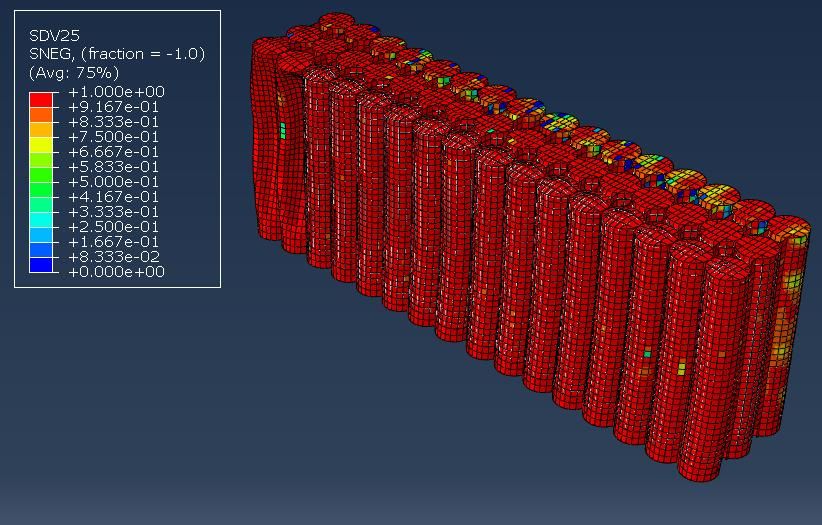
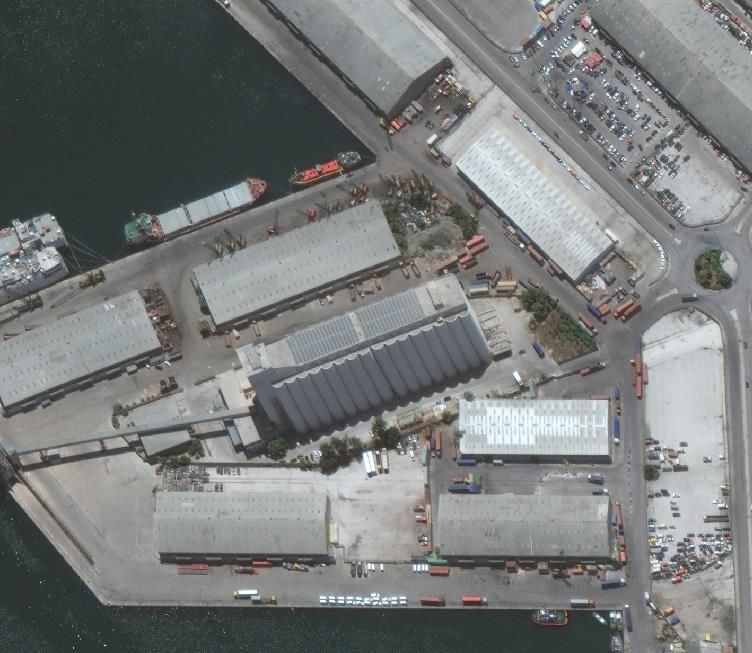
Figure 12: Concrete cores after compression test Figure 13: Concrete cores after splitting tensile test

2.2.2. Steel rebar testing

 Figure 14: Uniaxial tensile test for rebars Figure 15: Rebar samples after testing

2.3. Damage assessment

The research team, in cooperation with the Directorate of Engineering in the Lebanese Army, conducted
field visits to assess the damages of the silos. In addition, the Lebanese Air Force provided the research
team with aerial high-resolution photos for the silos, as shown in Figure 20.

 5
Grains

 Figure 16: Aerial photo by the Lebanese air force

 Two silos from the second and
 third row were destroyed

Figure 17: Side view for the damaged silos Figure 18: Front view for the damaged silos

 Figure 19: Sketch showing damaged silos after the explosion

 6
A three-dimensional scanning for the silos was performed by a Switzerland company showing the
deformed shape of the remaining part (14 silos in the third row) as illustrated in Figure 20.

 Figure 20: 3D scan provided by the swiss company

2.4. Numerical modeling
2.4.1. Finite element model T.S
After collecting all the information related to the
 L.S
silos, a non-linear numerical analysis was
conducted using ABAQUS software, to
determine the magnitude of the explosion based
on the silo’s damages. Four-node thin shell
elements were used to model the silos elements,
all reinforcements are defined as rebar layers
assigned to the shell elements. The grains are
modeled with 8-node linear brick elements, and
placed inside the silos.

 Figure 22: 3D view showing L.S and T.S

 2.4.2. Material definition
 The concrete material is defined as written script
 considering the dynamic effect on material
 properties. The behavior of concrete in uniaxial
 tension and compression (including cycles of
 loading - unloading) integrated in this model is
 shown in Figure 23:

 Figure 21: 3D view for the finite element model
 for silos

 7
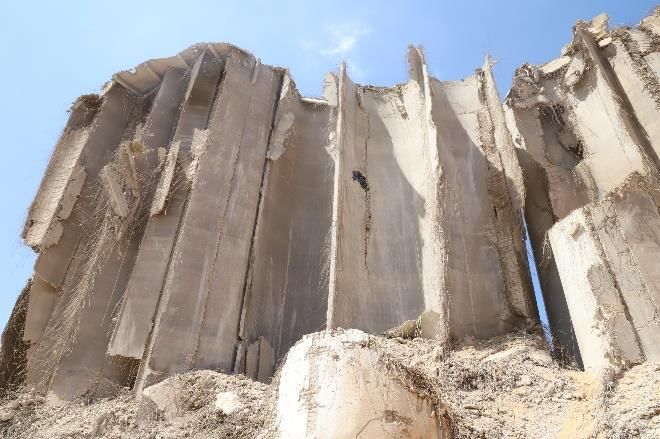
Figure 25: The role of Dt-tens

 2.4.3. Blast load definition & work plan
 Figure 23: general stress strain relation ABAQUS built-in CONWEP model is used to
 model the blast load in this study. It simulates the
The general stress Equation can be written as: loading effects due to an explosion in air for both
 − = 0 (1 − )(∈ −∈ ) (1) spherical waves (air blast) and hemispherical
 incident waves (surface blast) in terms of both
The damage parameter Dc only evolves during incident and reflected pressure. The typical
compressive pressure history for a blast wave is shown in
 − = 0 (1 − )(∈ −∈ ) (2) Figure 26. Based on this method, the total
 pressure applied on the front surface is defined
The damage parameter Dt-comp can be evaluated as:
indirectly from the damage of Mazars in
compression from (ε-εft0) (Figure 24) as follows: ( ) = ( )[1 + cos − 2 cos 2 ] + ( )cos 2

 − 0 = 0 (1 − − )(∈ −∈ 0 ) (3) for cos > 0 (4)

Regarding the tensile damage Dt-tens due to a ( ) = ( ) , for cos < 0 (5)
tensile loading, it suffices to consider the Dtm Where P(t) is the total surface pressure at time t,
damage of Mazars evaluated at strain (ε-εft). Pi is the incident pressure, and Pr is the reflected
 pressure.

 Figure 24: The role of Dt-comp

 Figure 26: Typical pressure history for a blast wave

 8
In order to specify the detonation center point of
the explosion, the aerial photos captured by the Center of explosion - Standoff distance = 75m
Lebanese Army Air Force are used to preliminary
define the detonation center point as shown in
Figures 27 and 28. Figure 27 shows ward number
12 that contained the explosive materials and the
silos.

 Centroid shift

 Figure 28: Silos vicinity after explosion

 Since the explosive material in ward number 12
 is Ammonium Nitrate (AN), a scaling factor is
 used to transform the AN mass to equivalent
 TNT mass, to enable using it in the numerical
 Last 2 silos destroyed in all rows study as input. The following Equation is
 adopted for this purpose:

 Figure 27: Silos vicinity before explosion = (6)

According to Equation 6, the scaling factor ( ) ranges between 0.35 – 0.39 for AN to TNT

transformation. Referring to the data provided by the Lebanese army (based on their investigations), a
scaling factor of 0.39 is recommended to transfer the explosive mass from AN to TNT. This implies that the
total original mass of AN of 2750t, is equivalent to 1100t of TNT.
The analytical program is divided into 8 cases, as illustrated in Table 2. Two parameters are considered to
calibrate the model, the degree of damage as shown in Figure 19, and the top lateral sway for the remaining
third row of silos shown in Figure 20.

 Table 1: Analytical cases considered in this study
 Case Equivalent TNT mass (t) Standoff distance (m) Centroid shift (m)
 Case 1 1100 75 0
 Case 2 500 75 0
 Case 3 400 75 0
 Case 4 300 75 0
 Case 5 200 75 0
 Case 6 100 75 0
 Case 7 50 75 0
 Case 8 200 85 10

 9
3. Results and discussion
3.1. First round of calibration
Results for all study cases are summarized in Table 2. Figure 29 shows the damage pattern for all load cases.
It is noted that for equivalent TNT mass of 1100t, 500t, 400t, and 300t respectively, all silos will be totally
destroyed Reducing the mass of explosion to 50t results in destruction of just one row of silos as shown in
Figure 29.

 Table 2: Summarized results for all study cases

 TNT da Zb Damage δmaxd Pse Fbase-maxf Mbase-maxg έh Wti
 Case
 (t) (m) (m/kg1/3) levelc (cm) (MPa) (kN) (kN.m) (s-1) (J)

 Case 1 1100 75 0.727 3 rows 202 17.2 1846180 1818540 4 6.28 x 10⁹

 Case 2 500 75 0.945 3 rows 82 9.1 1121450 1113400 1.41 1.68 x 10⁹

 Case 3 400 75 1.018 3 rows 62 7.5 956968 940165 1.25 1.15 x 10⁹

 Case 4 300 75 1.120 3 rows 44 5.35 796972 744287 1.24 7.04 x 10⁸

 Case 5 200 75 1.282 2 rows 31 3.82 615301 523658 0.68 3.56 x 10⁸

 Case 6 100 75 1.615 2 rows 18 1.9 462448 288411 0.47 1.12 x 10⁸

 Case 7 50 75 2.036 1 row 10 0.95 380292 158076 0.24 3.6 x 10⁷

 Case 8j 200 85 1.453 2 rows 26 2.63 575718 451001 0.68 2.58 x 10⁸

.

 (a) (b)

 10
(c) (d)

 (e) (f)

 Figure 29: Damage pattern for study cases:
 (a) Case 1 (b) Case 2 (c) Case 3 (d) Case 4 (e) Case 5 (f) Case 6

3.2. Second round of calibration
In this phase, the blast centroid is shifted by 10m towards the zone where the last two silos were totally
destroyed, to provide results matching the damage level as the actual case. Figure 30 shows the damages.

 First row Second row

 (a) (b)

 11
Totally destroyed

Third row – front face

 Third row – back face

 (c) (d)

 Figure 30: Damage pattern for case

 (a): First row (b): Second row (c): Third row – front face (d): Third row – back face

 0.0
 1 2 3 4 5 6 7 8 9 10 11 12 13 14
 -5.0
 Displacement (cm)

 -10.0

 -15.0

 -20.0

 -25.0

 -30.0
 Silo number

 Figure 31: Maximum displacements for each silo (cm)

 12
The blast pressure history for case 8 is shown in Figure 32.

 3 3.0

 2.5 2.5

 Pressure (MPa)
 2 2.0
 Pressure (MPa)

 1.5
 1.5
 1
 1.0
 0.5 Phase 1 Silos Phase 2 Silos
 0.5
 0
 0 0.05 0.1 0.15 0.2 0.25 0.0
 -0.5 1 2 3 4 5 6 7 8 9 10 11 12 13 14
 Time (s) Silo number

 Figure 32: Blast pressure history (MPa) Figure 33: Peak blast pressure for remaining silos (MPa)

 3.3.4. Refinement of Detonation Magnitude and
3.3. Additional Analysis Findings
 Location
3.3.1. Scaled Distance Ratio
 In order to refine the determined magnitude of
The scaled distance ratio: the explosion, five additional cases are studied
 considering small variation of both detonation
 = 1 (7) centroid location and detonation mass.
 ⁄3

The scaled distance value for case 1 (1100t of The analysis results led to 209t TNT, as a final
TNT) is 0.727. As for case 8, which is magnitude of the explosion corresponding to
corresponding to the actual the scaled distance is 535t of AN. This implies that the percentage of
1.453 AN mass exploded is 19% of the 2750t, the
 original stored quantity, declared.
3.3.2. Strain Rate
 4. Conclusion
The strain rate:
 The results of this study lead to the several
 ̇ = 0.45 + 141.275 −5.063 (8)
 important conclusions, most importantly:
The applied work varies from 6.28x10⁹J for case
 1- Based on the results of this study, it is
1 (1100t of TNT) to 2.58x10⁸J for case (case 8),
 concluded that the explosive amount of
 Ammonium Nitrate is much less than the
3.3.3. Total Work
 total original amount. The analysis
The Authors derived the work Equation: results prove that an amount equivalent
 = 1.24 × 10⁸ + 6.11 × 10¹¹ −6.3 (9) to 209t of TNT or 535t of AN is adequate
 to generate damages similar to those
According to the UFC code [40], the total energy resulting from the explosion. This
released by the explosion of 200t of TNT amount represents 19% of the original
equivalent is 8.36 x 10¹²J. This means that the stored amount (2750 t).
silos dissipated around 0.003% of the total energy
released by the explosion (Total work/released Table 5 below shows the results of this
energy = 2.58x10⁸ / 8.36 x 10¹²). Based on the research compared to results generated
above finding, the silos role was to diffract the by other research works
blast wave and not to absorb it.

 13
Table 3: Comparison between Temsah et al findings to other research findings

 Yield
 TNT mass AN mass
 Study energy Calculation Approach
 (t) (t)
 (J)
 Jorge [19] 4.19 x10¹² 1000 2560 Fireball Analysis
 Rigby [20] ---- 500 - 1100 1280 - 2816 Blast Empirical Formulas
 Lu [21] 2.65 x 10¹² 662 2070 Wilson Cloud
 Al-Housseiny [22] ---- 2200 - 4400 5630 - 11265 Wilson Cloud
 Aouad [23] 1.289×10¹² 308 810 Fireball Analysis
 Temsah 8.36 x 10¹² 209 535 Numerical Structural Analysis

 It is concluded that Aouad’s and Temsah 3- The total work dissipated by the silos is
 findings are relatively close, whereas the 2.58x10⁸J. This value is used to determine
 findings of all others are significantly the energy absorbed by the silos, which
 larger. is around 0.003% of the total released
 energy by 200t of TNT equivalent mass.
2- Regarding the position of explosive
 This refutes the claims that the silos
 centroid, it is found from the crater’s
 protected Beirut city from total
 dimensions that the standoff distance of
 destruction, yet they helped in
 the explosive ranges from 75m to 85m,
 diffracting the wave away from the
 and the centroid lies with 10m to 20m
 buildings lying behind.
 shift towards the direction where the last
 two silos, of each row, were totally
 destroyed.

 14
You can also read