Are CSIR-UGC NET-qualified Junior Research Fellows going away from science?
←
→
Page content transcription
If your browser does not render page correctly, please read the page content below
GENERAL ARTICLES

Are CSIR–UGC NET-qualified Junior
Research Fellows going away from science?
S. A. Hasan, Sushila Khilnani and Rajesh Luthra*

Data pertaining to CSIR-supported Junior Research Fellows (JRFs) indicate that around 41% of
the students qualifying CSIR–UGC NET, conducted from December 2008 to June 2010, did not
avail of the fellowships offered. The present study reveals that not availing the CSIR-JRF is
attributed primarily to awardees’ preference to go abroad for higher studies; or to take up jobs in
academic and R&D institutes; or to avail of fellowships offered by other funding agencies. Fur-
thermore, a sizeable percentage of NET-qualified students availed of the fellowship by clearing
NET again. Only a small percentage of NET-qualified students opt for a career in non-scientific in-
stitutes. Therefore, the concerns that NET-qualified students are going away from science are un-
founded.

Keywords:       Enrollment, Junior Research Fellowships, National Eligibility Test.

THE Council of Scientific and Industrial Research (CSIR)                 handicapped (PH) category and women candidates. SC,
started a research fellowship scheme in 1983 to identify                 ST and OBC candidates are also provided fee benefits to
young scientific talent through National Eligibility Test                apply for CSIR–UGC NET.
(NET) for pursuing Ph D in academic and scientific insti-                   Over the years, the number of candidates registering
tutions across India. The award of Junior Research Fel-                  for CSIR–UGC NET for JRF and eligibility for lecture-
lowships (JRFs) through NET is being shared with the                     ship has increased significantly1. Data pertaining to under-
University Grants Commission (UGC) since 1986. Fur-                      graduate (UG) and postgraduate (PG) enrollment for the
ther, NET was recognized by UGC as an eligibility for                    period 2004–05 to 2009–10 indicate that the number of
Lectureship in 1989, and the examination was renamed as                  students enrolled for UG and PG courses in science has
CSIR–UGC National Eligibility Test for Junior Research                   been increasing with an average annual growth of 8% and
Fellowship and Eligibility for Lectureship.                              19% respectively. The increase in growth in enrollment at
   NET is conducted twice a year in June and December                    UG and PG levels in science in 2009–10 over 2004–05 is
in five subject areas of basic sciences, viz. chemical;                  reported to be 44% and 121% respectively (Table 1)2.
earth, ocean and planetary; life; mathematical and physi-                Thus, increase in registration over the years for CSIR–
cal Sciences. From 2012, amendments have been made in                    UGC NET is in tandem with the increase in enrollment in
the NET scheme with regard to qualification and validity                 UG and PG courses in science.
of CSIR-JRF to widen the scope of NET and to attract                        During 2011–12, a total of 4274 fellowships were
students at early stages of their career. The validity to                awarded through CSIR–UGC NET and out of these, 2135
avail JRF has been increased to two years and students                   fellowships were passed on to UGC for support. The
with BS-four-year programme/B E/B Tech/B Pharm/                          biggest beneficiary of NET is the university system and
MBBS/Integrated BS–MS/M Sc or equivalent degree,                         the national laboratories, including those of CSIR, the
B Sc (Hons) or equivalent degree can take NET. Further,                  Departments of Biotechnology, Science and Technology,
to augment the number of Ph Ds in engineering, ‘engi-                    Atomic Energy, etc. where majority of these students
neering sciences’ has been introduced as a 6th subject                   join. CSIR–UGC NET has been instrumental in strength-
from December 2012. Age limit for writing JRF–NET is                     ening the pool of highly qualified S&T manpower in the
28 years, whereas there is no age limit for NET-                         country over the years.
Lectureship. A five-year age relaxation is given to candi-                  Efforts are being made to increase the number of fel-
dates belonging to Scheduled Castes (SC), Scheduled                      lowships awarded through CSIR–UGC NET. During the
Tribes (ST), Other Backward Classes (OBC), Physically                    11th Five-Year Plan (2007–12), the number of fellow-
                                                                         ships offered by CSIR has increased twofold over the
The authors are in the Human Resource Development Group, Council
                                                                         10th Five-Year Plan (2002–07). It has, however, been
of Scientific and Industrial Research, Library Avenue, Pusa, New Delhi   observed that, on an average about 41% of the candidates
110 012, India.                                                          awarded the CSIR-JRF did not avail of the fellowship
*For correspondence. (e-mail: luthra57@rediffmail.com)                   offered through NET conducted during the period
430                                                                            CURRENT SCIENCE, VOL. 104, NO. 4, 25 FEBRUARY 2013
GENERAL ARTICLES
Table 1. Year-wise enrollment of students in B Sc and M Sc during 2004–05 to 2009–10
B Sc M Sc %M Sc enrollment B Sc (% yearly increase M Sc (% yearly increase
Financial year enrollment enrollment of B Sc enrollment in enrollment) in enrollment)
2004–05 1,490,785 198,719 13 – –
2005–06 1,578,652 219,285 14 6 10
2006–07 1,643,998 249,071 15 4 14
2007–08 1,805,920 388,542 22 10 56
2008–09 2,000,374 382,619 19 11 –2
2009–10 2,148,956 439,725 20 7 15
Yearly average growth (%) 8 19
Percentage of increase in growth rate in 2009–10 over 2004–05 44 121
Source: Ref. 2.
Results
Subject-wise award of CSIR-JRF vis-à-vis rank-wise
joining
CSIR awarded a total of 6096 fellowships through CSIR–
UGC NET conducted from December 2008 to June 2010.
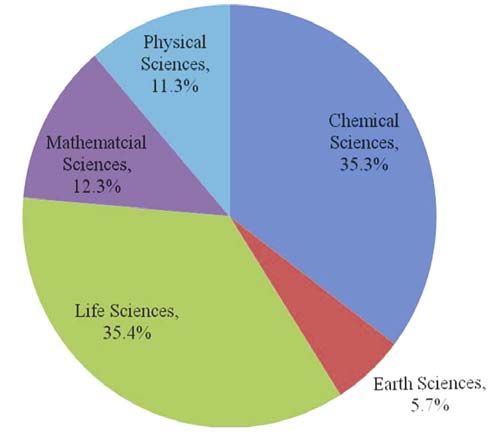
About 35.4% of the fellowships awarded was in the area
of life sciences, 35.3% in chemical sciences, 12.3% in
mathematical sciences, 11.3% in physical sciences and
5.7% in earth sciences (Figure 1).
Out of 6096 fellowships awarded in all disciplines
together, 41% (2517) of CSIR-JRF did not avail of the
fellowships. Analysis of the discipline-wise data revealed
that 56% of the candidates who qualified NET under
mathematical sciences did not avail a fellowship followed
by physical and earth sciences (49% each), life sciences
(38%) and chemical sciences (36%; Table 2).
Figure 1. Subject-wise break-up of CSIR-JRF (6096) awarded Though 59% of CSIR-JRFs actually availed of the
through CSIR–UGC NET conducted from December 2008 to June fellowship awarded through CSIR–UGC NET conducted
2010.
from December 2008 to June 2010 (Table 2), the subject-
wise overall joining was highest (64%) in chemical sci-
December 2008 to June 2010. There are apprehensions ences, followed by life sciences (62%), earth sciences and
that the CSIR-JRFs who did not avail of the fellowship physical sciences (51% each) and lowest in mathematical
are probably going away from science. The present study sciences (44%; Table 3).
was undertaken to ascertain the actual reasons for not Rank-wise analysis of CSIR-JRF revealed that the
availing of the CSIR-JRF awarded through CSIR–UGC overall joining gradually increased from 45% (rank ≤ 50)
NET. to 70% (rank 200–250) and then decreased (Table 3).
Subject-wise joining up to the rank 50 was highest in
chemical sciences (54%), followed by life sciences
Methodology (49%), earth sciences (48%), physical sciences (38%) and
the lowest in mathematical sciences (35%). The subject-
Data pertaining to CSIR-JRF awarded through CSIR– wise joining pattern of the top-100 ranking JRFs was
UGC NET conducted during December 2008, June 2009, similar to that of the top 50, with highest joining in
December 2009 and June 2010, and the number of fel- chemical sciences (59%), followed by life sciences
lowships availed of have been taken from the Extramural (55%), earth sciences (51%), physical sciences (45%),
Research Division (EMR-I) of Human Resource Deve- and lowest in mathematical sciences (42%).
lopment Group, CSIR. A feedback proforma, designed to
ascertain the reason(s) for not availing of the CSIR-JRF, Subject-wise analysis of NET qualified candidates
was sent by post or e-mailed to the candidates (2517) who did not avail of the fellowships
who did not avail of the fellowship. A total of 844 (34%)
responses received have been analysed to ascertain the Out of a total of 2517 NET-qualified candidates who
reason(s) for not availing of the fellowship. did not avail of the CSIR-JRFs awarded through NET
CURRENT SCIENCE, VOL. 104, NO. 4, 25 FEBRUARY 2013 431GENERAL ARTICLES
Table 2. Examination-wise number of Junior Research Fellowships awarded by CSIR and number of JRFs who did not avail of the fellowship
Subject-wise number of CSIR-JRFs awarded Number of JRFs who did not avail of the fellowship
NET Chemical Earth Life Mathematical Physical Chemical Earth Life Mathematical Physical
examination sciences sciences sciences sciences sciences Total sciences sciences sciences sciences sciences Total
December 2008 663 83 617 207 217 1787 200 35 210 112 90 647
June 2009 575 72 597 231 214 1689 210 30 218 123 95 676
December 2009 425 142 493 121 212 1393 168 70 184 78 127 627
June 2010 492 52 449 191 43 1227 195 37 204 106 25 567
Total 2155 349 2156 750 686 6096 773 172 816 419 337 2517
(36.0) (49.0) (38.0) (56.0) (49.0) (41.0)
Figures in parenthesis represent the percentage of JRFs who did not avail of the fellowship.
Table 3. Ranking pattern of cumulative subject-wise CSIR-JRFs awarded through NET conducted from December 2008 to June 2010 vis-à-vis
JRFs availed
Subject-wise number of CSIR-JRFs awarded Number of JRFs who availed the fellowship
Chemical Earth Life Mathematical Physical Chemical Earth Life Mathematical Physical
Ranking sciences sciences sciences sciences sciences Total sciences sciences sciences sciences sciences Total
≤ 50 235 194 216 211 196 1052 126 94 106 74 74 474
(45.0)
51–100 270 116 269 214 181 1050 172 65 162 105 97 601
(57.0)
101–150 328 11 332 167 186 1024 213 4 205 76 104 602
(59.0)
151–200 361 28 417 128 68 1002 232 14 265 59 42 612
(61.0)
201–250 373 – 363 7 32 775 246 – 276 4 18 544
(70.0)
251–300 274 – 291 13 23 601 202 – 179 8 14 403
(67.0)
301–350 58 – 99 10 – 167 46 – 55 5 – 106
(63.0)
351–400 86 – 96 – – 182 56 – 52 – – 108
(59.0)
401–450 85 – 73 – – 158 48 – 40 – – 88
(56.0)
451–500 81 – – – – 81 39 – – – – 39
(48.0)
>500 4 – – – – 4 2 – – – – 2
(50.0)
Total 2155 349 2156 750 686 6096 1382 177 1340 331 349 3579
(64.0) (51.0) (62.0) (44.0) (51.0) (59.0)
Figures in parenthesis represent the percentage of JRFs who availed of the fellowship.
conducted during the period December 2008 to June Varied reasons have been given by the respondents for
2010, 844 (34%) responded and indicated their option for not availing of the JRF awarded by CSIR. Out of the total
not availing of the fellowship. Subject-wise distribution respondents (844), 27% opted for the fellowships offered
pattern of respondents (844) indicates that life sciences by other funding agencies. Around 20% were selected for
constitutes 34% of the total respondents, chemical sci- (a) teaching positions in universities or its affiliated
ences 25%, mathematical sciences 18%, physical sciences graduate/postgraduate colleges and (b) permanent/
16% and earth sciences 7%. However, the response per- temporary positions as scientist/researcher in government/
centage was maximum (41%) in physical sciences fol- public/private R&D organizations. A sizeable percentage
lowed by earth, life and mathematical sciences (35% (19) has gone abroad in pursuit of higher education. Only
each) and the least in chemical sciences (28%; Table 4). 6% of the total respondents have joined Central/State
432 CURRENT SCIENCE, VOL. 104, NO. 4, 25 FEBRUARY 2013GENERAL ARTICLES
Table 4. Subject-wise distribution of JRFs contacted who did not avail of the fellowship and the number of
feedbacks received
No. of JRF feedback No. of feedbacks Percentage of feedbacks
Subject proforma mailed received received
Chemical sciences 773 213 (25) 28
Earth sciences 172 60 (7) 35
Life sciences 816 285 (34) 35
Mathematical sciences 419 148 (18) 35
Physical sciences 337 138 (16) 41
Total 2517 844 34
Figures in parenthesis represent the relative percentage.
Table 5. Subject-wise distribution of respondents and reasons for not availing of the CSIR-JRF
Subject-wise number of respondents
Chemical Earth Life Mathematical Physical Total responses
Reason(s) for not availing of the CSIR-JRF sciences sciences sciences sciences sciences received
Fellowships from other funding agencies 20 13 89 42 60 224 (27.0)
Selected for teaching position in university/graduate, 25 1 15 36 6 83 (10.0)
postgraduate colleges
Gone abroad for higher education 56 7 64 13 18 158 (19.0)
Selected for permanent/temporary position as scientist/ 22 11 22 6 25 86 (10.0)
researcher in government/public/private R&D organization
Employment in non-scientific organization 18 16 5 9 6 54 (6.0)
Joined by clearing another NET 45 4 48 11 9 117 (14.0)
Personal/health/family reasons 8 5 9 3 4 29 (3.5)
Not interested in Ph D and pursuing M Tech, etc. 5 3 10 10 9 37 (4.0)
Teaching in secondary/senior secondary schools, etc. 4 0 6 8 0 18 (2.0)
Not found a suitable laboratory 4 0 9 3 1 17 (2.0)
Other (exact reason not mentioned) 6 0 8 7 0 21 (2.5)
Total 213 60 285 148 138 844
Figures in parenthesis represent relative percentage of response received.
Administrative/Armed Services or got employment in gone abroad for higher studies and 13% took up jobs in
non-scientific organizations. Many of the students write academic and R&D institutes. In mathematical sciences,
NET time and again to improve their rank so as to be eli- 30% of 148 fellows who did not avail of the CSIR-JRF,
gible for the Shyama Prasad Mukherjee Fellowship took up jobs in academic and R&D organizations, 28%
(SPMF), a high-end fellowship awarded by CSIR to cer- availed of fellowships awarded by other funding agencies
tain top-ranking NET-qualified candidates. It is interest- and 9% have gone abroad for higher studies. In physical
ing to note that 14% of the fellows had actually availed of sciences, 43% of 138 fellows, who did not avail of the
the CSIR-JRF by clearing NET again. CSIR-JRF, actually availed of fellowships awarded by
The subject-wise analysis of the reasons for not avail- other funding agencies, 22% took up jobs in academic
ing of the CSIR-JRFs is given in Table 5. In chemical and R&D institutes and 13% have gone abroad for higher
sciences, 26% of 213 fellows who did not avail of the studies.
CSIR-JRF, have gone abroad for higher studies, 22% Subject-wise analysis of the CSIR–NET JRF further
took up jobs in academic and R&D institutes, and only revealed that out of 158 respondents who had gone
9% availed of the fellowships awarded by other funding abroad for pursuing higher studies, maximum were from
agencies. In earth sciences, 27% of 60 fellows, who did life sciences (41%) followed by chemical sciences (35%;
not avail of the CSIR-JRF, got employment in non- Table 5). Out of 224 respondents who availed of the fellow-
scientific organizations, 22% availed of fellowships ships awarded by other funding/sponsoring agencies,
awarded by other funding agencies, 20% took up jobs in maximum were from life sciences (40%) followed by
academic and R&D institutes, and 12% have gone abroad physical sciences 27%. Twenty-six per cent of 86 respon-
for higher studies. In life sciences, 31% of 285 fellows dents selected for ‘permanent/temporary positions as
who did not avail of the CSIR-JRF actually availed of fel- scientist/researcher in Government/public/private R&D
lowships awarded by other funding agencies, 22% have organizations’, were from chemical and life sciences
CURRENT SCIENCE, VOL. 104, NO. 4, 25 FEBRUARY 2013 433GENERAL ARTICLES
each. Forty-three per cent of 83 respondents selected for is accompanied by significant increase in registration for
teaching positions in universities/graduate, postgraduate CSIR–UGC NET for JRF and Eligibility for Lectureship.
colleges, were from mathematical sciences followed by Majority of CSIR–UGC NET-qualified fellows who did
chemical sciences (30%) and life sciences (18%). Further, not avail of the CSIR-JRF, remained in the science stream
33% of 54 respondents who got employment in non- and have been pursuing doctoral research with the fellow-
scientific organizations were from chemical sciences ships provided by other funding/sponsoring agencies, or
(Table 5). pursuing research in foreign institutes, or are employed in
Apart from CSIR, a number of funding agencies under academic and R&D institutes. Thus, our results dispelled
various Ministries/Departments are providing research the concern that NET-qualified candidates who did not
fellowships for pursuing doctoral research. Prominent avail of the CSIR-JRF are going away from science.
among these are Department of Biotechnology (DBT), India, however, still requires a large number of highly
Department of Atomic Energy (DAE), UGC, Department skilled S&T personnel to compete in the knowledge-
of Science and Technology (DST), Indian Council of driven global economy. Efforts should be made to progres-
Medical Research (ICMR), Ministry of Human Resource sively augment the creation of high-quality skilled human
Development (MHRD), National Board for Higher resource at all levels, starting from inculcating scientific
Mathematics (NBHM) and Indian Council of Agricultural temper at school level to creating better and competitive
Research (ICAR). Our results have shown that, out of 224 job opportunities.
respondents who had been awarded fellowships by other
funding agencies, maximum (17.0%) were supported by
1. Inderpal, S. C., Saini, A. K. and Luthra, R., CSIR–UGC National
DBT, followed by UGC (14.8%), DAE (12.0%), ICMR Eligibility Test: a performance indicator of basic science education
(7.9%), DST (6.9%), NBHM (6.5%) and MHRD (6.0%). in Indian universities. Curr. Sci., 2009, 97, 490–499.
2. Selected Education Statistics, 2004–05 to 2009–10, Ministry of Hu-
Conclusion man Resource Development, Government of India.
An increase in the enrollment of students for UG and PG
courses in science during the period 2004–05 to 2009–10 Received 15 November 2012; accepted 10 December 2012
434 CURRENT SCIENCE, VOL. 104, NO. 4, 25 FEBRUARY 2013You can also read