June 2019 Presentation - CGG
←
→
Page content transcription
If your browser does not render page correctly, please read the page content below
June 2019 Presentation

All figures are ‘segment figures’ used for management reporting
(before non-recurring charges and IFRS 15), unless stated otherwise
Disclaimer
This presentation contains forward-looking statements, including, without limitation, statements about CGG (“the Company”) plans, strategies, objectives
and prospects. These forward-looking statements are subject to risks and uncertainties that may change at any time, and, therefore, the Company’s actual
results may differ materially from those that were expected. The Company based these forward-looking statements on its current assumptions (including
€/$ foreign exchange rate of 1.20 and brent oil price above $70), expectations and projections about future events. Although the Company believes that the
expectations reflected in these forward-looking statements are reasonable, it is very difficult to predict the impact of known factors and it is impossible for
us to anticipate all factors that could affect our proposedresults.
All forward-looking statements are based upon information available to the Company as of the date of this presentation. Important factors that could cause
actual results to differ materially from management's objectives or expectations are disclosed in the Company’s periodic reports and registration statements
filed with the SEC and the AMF. Investors are cautioned not to place undue reliance on such forward-looking statements.
All figures are ‘segment figures’ used for management reporting (before non-recurring charges, IFRS 15 and IFRS 16)
Following the implementation of our financial restructuring plan in February 2018, we remain subject to the undertakings and requirements set out in the
safeguard plan endorsed by the Commercial Court of Paris in a ruling dated December 1, 2017 (as detailed in our 2017 document de référence filed with
the AMF and our 2017 annual report on Form 20-F filed with the SEC). The implementation of our strategic plan is subject to those undertakings and
requirements, as well as to applicable local law requirements, which could affect our ability to achieve the objectives we set out in our plan by the targeted
dates or at all.
The Company has prepared this presentation based on information available to it, including information derived from public sources that have not been
independentlyverified.
This presentation is not, and should not be construed as, an offer to buy or sell or a recommendation in respectof any of the Company’s securities in any
jurisdiction.
2 June 2019 roadshow presentation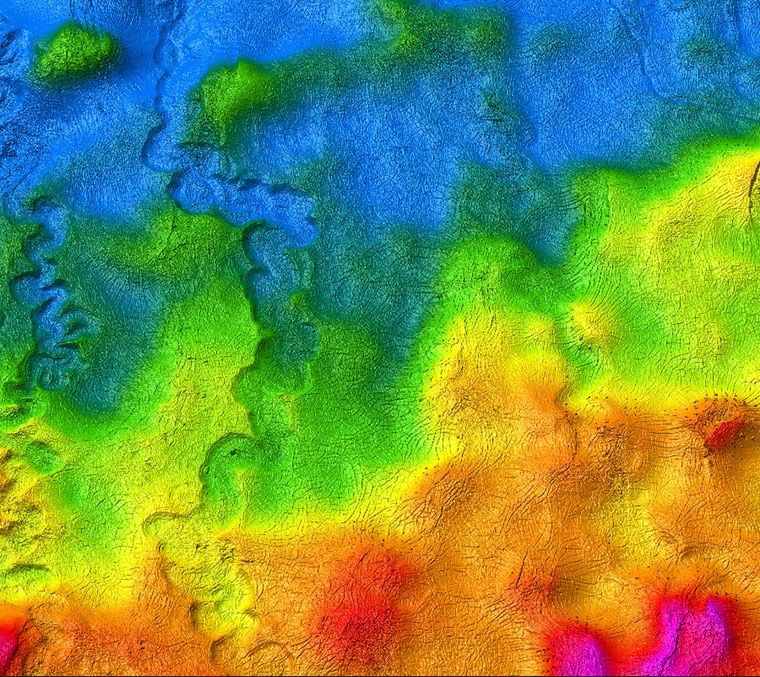
People, data & technology delivering geoscience leadership

                                                     Offering a comprehensive range of leading
                                                     geophysical, geological and reservoir technologies,
                                                     data and equipment that optimize the discovery
                                                     and development of natural resources

                                                     HSE EXCELLENCE      PEOPLE       QUALITY

                                                       INNOVATION        SOCIAL RESPONSIBILITY

Northern Viking Graben, Norwegian North Sea
CGG Multi-Client

         3         June 2019 roadshow presentation
Agenda
                                      01   CGG 2021 STRATEGY

                                      02   BUSINESS DESCRIPTION

                                      03   FINANCIAL REVIEW

                                      04   CONCLUSION

4   June 2019 roadshow presentation
CGG 2021 Strategy

Client trends: modified mindset
    Spending                            Looking for     Significant focus   Building opportunity
prioritized around                    new sources of   on leveraging data   portfolio to replace /
 quicker returns                         efficiency      & technology        increase reserves

                     Faster, better-informed decisions to increase
                 success & reduce costs and risks across the E&P cycle

6   June 2019 roadshow presentation
CGG: 2021 strategy
        TRANSITION TO
                                                      FOCUS ON THREE CORE BUSINESSES
    AN ASSET-LIGHT MODEL

    Marine
    3-vessel fleet in 2019
    Find a strategic partner to operate
    the vessels by 2021

                                           Geoscience               Multi-client              Equipment
    Land                                  Established leader in     The industry’s most      Established leader in
    Wind down operations in 2019           subsurface imaging,     technically advanced      marine, land, ocean
                                           geology, geoscience       seismic data and         floor and downhole
                                          software and services   geologic studies in the   seismic equipment and
    Multi-Physics                                                  world’s key locations             gauges
    Divest to company with
    complementary offering
                                          GGR (Geology, Geophysics and Reservoir) segment

7    June 2019 roadshow presentation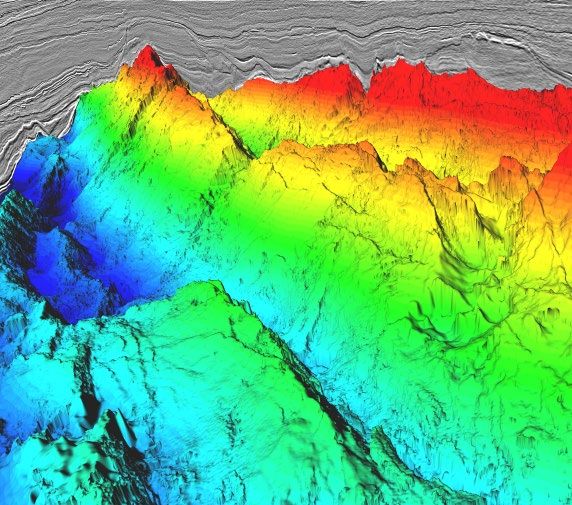
Agreement with Shearwater for high-end seismic vessels
and creation of global leader in streamer technology

• Transfer of five high-end streamer vessels jointly owned by CGG and Eidesvik Offshore ASA to
    Shearwater. Shearwater will assume the net liabilities associated with all vessels at the time of
    completion

• Five-year agreement for the utilization of two vessel-years, which ensures CGG has access to capacity
    for its future multi-client projects

• Creation of a structured partnership, under the Sercel brand and CGG’s majority ownership, for the
    manufacturing, commercialisation and support of marine streamer seismic acquisition equipment as
    well as related research and development activities

Final closing planned before year-end. Agreements are subject to an agreement with the banks financing GSS debt, the ship owning company jointly held
by CGG and Eidesvik in equal parts and approval by the competent authorities, and other customary conditions in each country including work council
consultation

8     June 2019 roadshow presentation
CGG 2018 new perimeter

       $1.2 Bn      26%
                                                     20%                      21%

        REVENUE
                                               42%
                           REVENUE                          REVENUE
                         PER BUSINESS                      PER REGION
       $556 m                                                                       22%
        EBITDAs
       45% margin                                    37%
                          32%

       NET DEBT
      c. $0.7 Bn
                                Geoscience                    North America

                                Equipment                     Latin America

                                Multi-client                  EAME

                                                              Asia Pacific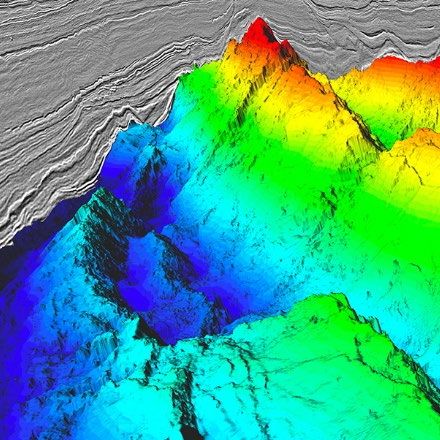
CGG 2021 vision

                                                                                                   45%   +/- 300 bps   $300m +/- 10%
            $1.7bn +/- 5%                                        30%                               EBITDAs margin
                                                                                                                       Free Cash Flow*

                  revenue
                                                    revenue from new
                                                                                                      >15%             Leverage
Business Description All figures are ‘segment figures’ used for management reporting (before non-recurring charges and IFRS 15), unless stated otherwise
GGR Segment key financial indicators
                  SEGMENT REVENUE ($m)                                       SEGMENT EBITDAS ($m) & MARGIN

                       Geoscience      Multi-Client
                                                                                         558
                                                                       460       486
                       +11%                                                             61%
                                                                                                     52%       58%
                                                                      59%        59%
                              913                                                                     97       105

     784        820
                                                                      2016       2017   2018       1q 2018   1q 2019

                              517
     383        469                                                           SEGMENT OPINC ($m) & MARGIN

                                                      185   180

     401        351           396                                                       176
                                                      84      89
                                                                                 131                 21%
                                                      101     91                                               3%
                                                                       81               19%
     2016       2017          2018                1q 2018   1q 2019             16%                  38
                                                                      10%                                       5

                                                                      2016      2017    2018       1q 2018   1q 2019

12   June 2019 roadshow presentation
Our Geoscience ecosystem
Geological & Reservoir Services GeoSoftware
Discover integrated reservoir Leaders in reservoir characterization
characterization featuring Robertson for a powerful advantage at every stage
SUBSURFACE IMAGING
Unmatched expertise, advanced
NPA Satellite Mapping Smart Data Solutions
geoscience & digital algorithms
Intelligence from imagery for E&P, Digital transformation and data
and excellent service in every image
engineering and beyond repository solutions
Integration across geosciences for enhanced insight and understanding
Leveraging AI, Machine Learning and data analyticsGeoscience key business indicators
TOTAL PRODUCTION ($m) BACKLOG as of MAY. 1ST ($m)
+6% External revenue
566 527 Internal production
496
165 132
145
132 129 285 272 298
401 351 395 31 38
101 91
2016 2017 2018 1q 2018 1q 2019 2017 2018 2019
TOTAL PRODUCTION / HEAD ($k) COMPUTING POWER (PFlops)
252 166
219 226
58 72
41
21
2016 2017 2018 2014 2015 2016 2017 2018
14 June 2019 roadshow presentationMulti-Client Data
The most recent and advanced data
in the world’s key basins and frontiers
• The highest quality seismic data library
• Well and geologic data, leading studies
• JumpStart integrated geoscience products
• GeoSpec enhanced legacy data
THE RIGHT DATA, IN THE RIGHT PLACE
AT THE RIGHT TIME
Top Miocene horizon, Gabon South Basin
CGG Multi-ClientA worldwide footprint, positioned in key basins
Alaska
348 km2 > 1 million km2
N. Sea
224,270 km2 Caspian 130 people
2,225 (2D) km 13,122 (2D) km
US Land
50,477 km2 • Superior quality surveys
GOM
374,032 km2 Africa Asia • Solid Investment rationale
68,345 km2
29,152 (2D) km
9,323 (2D) km
Brazil • Balanced portfolio of 3D /
297,667 km2 Australia 2D / Geology across E&P
41,342 km2
28,262 km2 Multi-Physics value chain
GEOLOGY GEOSPEC - LEGACY SEISMIC
500 Geologic Studies 642,932 km2 worldwide
1000 Petroleum systems analysis 4,206,781 (2D) km worldwide
16 June 2019 roadshow presentationMulti-Client key business indicators
MULTI-CLIENT REVENUE ($m) MULTI-CLIENT CAPEX ($m) & PRE-FUNDING (%)
1.3x 1.9x 2.3x After-sales Prefunding Multi-client Capex Cash pre-funding rate
+10%
Cash on cash
517 107% 97%
469 92%
383 84 89
216 295
269 251 223 79% 106%
272
302 62 40
200 49 42
111 35 47
2016 2017 2018 1q 2018 1q 2019 2016 2017 2018 1q 2018 1q 2019
DATA LIBRARY NBV SPLIT AS OF 31/03/2019 DATA LIBRARY NBV REGIONAL SPLIT AS OF 31/03/2019
5%
5% 18% Others
up to 4 years old
29%
40% up to 3 years old US Land
29% 10%
up to 2 years old
Europe - Africa
up to 1 year old
North & South
21% WIP 43% America
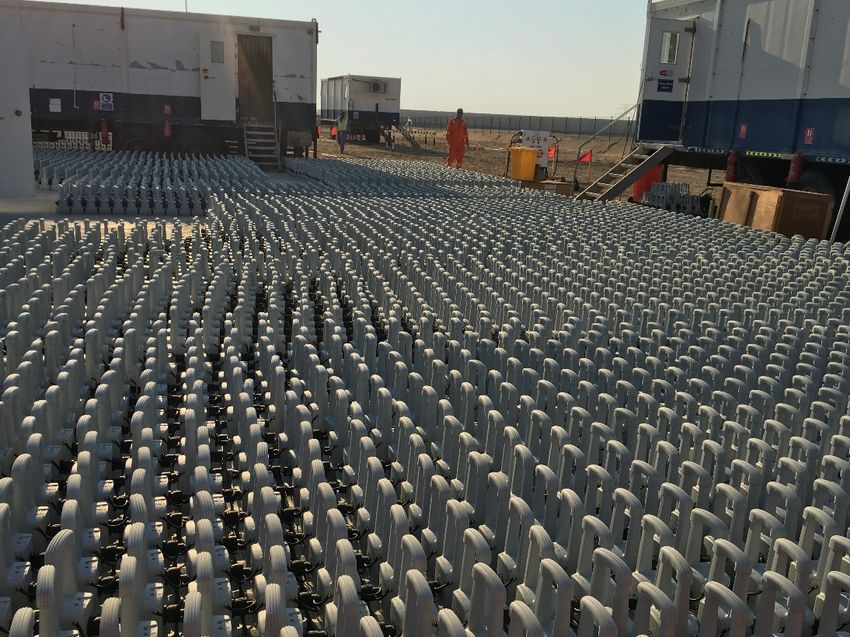
17 June 2019 roadshow presentationEquipment
Clear leadership with a broad
and unique portfolio of leading edge
technology
• Full range of onshore, offshore & downhole products
• Industry benchmark and market leader
• Unequalled product reliability
• Outstanding customer support
SERCEL - AHEAD OF THE CURVE™
Sercel 508XTEquipment key financial indicators
SEGMENT REVENUE ($m) SEGMENT EBITDAS ($m) & MARGIN
42
Land Marine Downhole Non Oil & Gas
+45% 23
22%
351
12%
-2% -2% -4%
10
255
35 -6 -6 -3
241 2016 2017 2018 1q 2018 1q 2019
11
8 92
19 SEGMENT OPINC ($m) & MARGIN
24
12 15
100 105
91 3% 14%
66 2
215 5 -16% -15%
1 13 -15%
- 10
125 119 7
14 85
44 - 36
- 42
2016 2017 2018 1q 2018 1q 2019 2016 2017 2018 1q 2018 1q 2019
19 June 2019 roadshow presentationFinancial Review
Sound financial situation
                                                                            1st lien HYB
Q1 2019 Net Cash Flow at $44m                                         average cost of debt     2nd lien HYB
                                                                                               cost of debt at
                                                                            at 8.4% cash
                                                                                               [Libor/Euribor + 4%]
Q1 2019 strong cash flow generation                                                            cash + 8.5% PIK
• Segment free cash flow from operations at $146m, significantly up                            • Callable at 120% in Y.1 & 2
  y-o-y                                                                                        • Callable at 112.5% in Y.3

• Paid cost of debt at $(7)m and lease repayments of $(16)m
• Discontinued operations and cash NRC at $(53)m including CGG
  2021 cash costs of (25)m
• Net cash flow at $44m
                                                                                       615
Solid liquidity at $475m                                                                      489

Gross debt at $1,179m before IFRS 16 and
$1,343m after IFRS16

Net debt at $704m before IFRS 16 and                                  2018             2023   2024
$868m after IFRS16

 21   June 2019 roadshow presentation
Conclusion
Confirmation of 2019 guidance and 2021 targets

                                       Continuing gradual market recovery

                                       Positive cash generation in Q1 2019 reflecting the
                                       strength of CGG’s core businesses and cost
                                       management focus

                                       First quarter 2019 financial performance in line
                                       with expectations

                                       Confirmation of 2019 guidance and 2021 targets

24   June 2019 roadshow presentation
DELIVERING GEOSCIENCE LEADERSHIP
You can also read