Upper Missouri River Basin May 2021 Calendar Year Runoff Forecast
←
→
Page content transcription
If your browser does not render page correctly, please read the page content below
Upper Missouri River Basin
                      May 2021 Calendar Year Runoff Forecast
                                          May 6, 2021

                    U.S. Army Corps of Engineers, Northwestern Division
                          Missouri River Basin Water Management
                                        Omaha, NE

Calendar Year Runoff Forecast
Explanation and Purpose of Forecast

The long-range runoff forecast is presented as the Calendar Year Runoff Forecast. The Calendar
Year Runoff Forecast is available at http://www.nwd-mr.usace.army.mil/rcc/reports/runoff.pdf.
This forecast is developed shortly after the beginning of each calendar year and is updated at the
beginning of each month to show the actual runoff for historic months of that year and the
updated forecast for the remaining months of the year. This forecast presents monthly inflows in
million acre-feet (MAF) from five incremental drainage areas, as defined by the individual
System projects, plus the incremental drainage area between Gavins Point Dam and Sioux City.
Due to their close proximity, the Big Bend and Fort Randall drainage areas are combined.
Summations are provided for the total Missouri River reach above Gavins Point Dam and for the
total Missouri Basin above Sioux City (upper Basin). The Calendar Year Runoff Forecast is
used in the Monthly Study simulation model to plan future system regulation in order to meet the
authorized project purposes throughout the calendar year.

Observed Runoff

April runoff was 1.3 MAF, 44% of average for the Basin above Sioux City, IA. April’s runoff
was the 8th lowest April in 123 years of record-keeping. Runoff was well-below average in all
reaches except the Fort Randall to Gavins Point reach, which was 142% of average. Observed
precipitation in April was 5% to 50% of normal over most of the upper Basin.

2021 Calendar Year Forecast Synopsis

The 2021 calendar year runoff forecast for the upper Missouri Basin above Sioux City, IA is 17.8
MAF, 69% of average. The 2021 calendar year runoff forecast for the Missouri Basin above
Gavins Point is 16.0 MAF, 69% of average. The extremely dry April, current soil conditions,
and NOAA’s latest outlooks calling for warmer-than-normal temperature and drier-than-normal
precipitation has resulted in our office significantly lowering our 2021 calendar year runoff
forecast from last month’s forecast.

Due to the amount of variability in precipitation and other hydrologic factors that can occur over
the next 8 months, expected inflow could range from the 22.5 MAF upper basic forecast to the
13.7 MAF lower basic forecast. The upper and lower basic forecasts are used in long-term
                                                1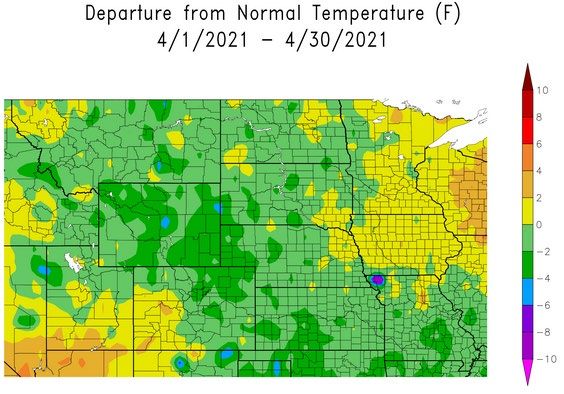
regulation planning models to “bracket” the range of expected runoff given much wetter or drier
conditions, respectively. Given that eight months are being forecast for this May 1 forecast (4
month observed/8 months forecast), the range of possible wetter-than-expected (upper basic) and
drier-than-expected (lower basic) conditions is very large, and is attributed to all six reaches for
the next 8 months. The result is a range or “bracket” for each reach, and thus, for the total runoff
forecast.

Current Conditions
Drought Analysis

The National Drought Mitigation Center’s drought monitor for April 27, 2021 is shown in
Figure 1. The drought monitor is available at http://droughtmonitor.unl.edu/. The U.S. Drought
Monitor shows Abnormally Dry (D0) conditions are present in every state in the Basin except
Missouri, with Extreme Drought (D3) conditions present in eastern Montana, North Dakota, and
northern South Dakota. The Seasonal Drought Outlook in Figure 2, which extends through the
end of July, indicates drought conditions are likely to persist or expand throughout the Basin.

             Figure 1. National Drought Mitigation Center U.S. Drought Monitor for April 27, 2021.

                                                      2
Figure 2. National Drought Mitigation Center U.S. Drought Seasonal Drought Outlook.

Precipitation

Monthly precipitation accumulations are shown using High Plains Regional Climate Center
images available at http://www.hprcc.unl.edu/. The April precipitation accumulations are shown
in Figure 3 as a percent of normal precipitation. April precipitation was well below normal over
the entire Basin, except for a few small areas in Colorado, Wyoming, and Missouri. Most of
Montana, North Dakota, and South Dakota received 5 to 50 percent of normal precipitation.

Precipitation as a percent of normal for the February-March-April 2021 period was also below
normal in the upper Basin, but above normal in the lower Basin (Figure 4).

                                                     3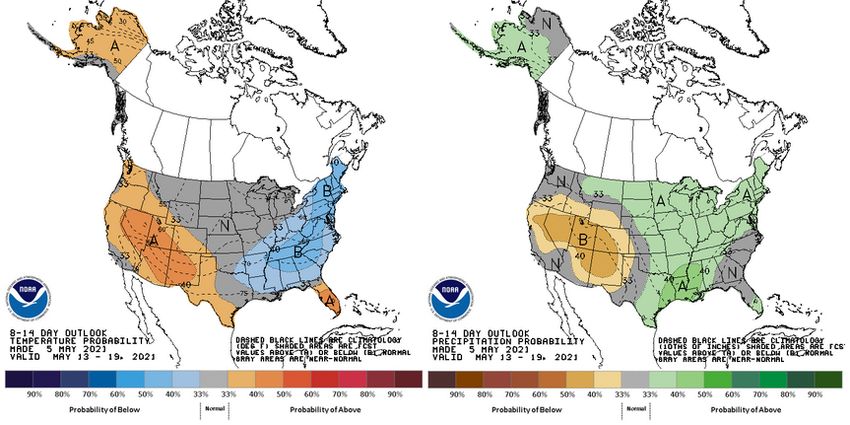
Figure 3. April 2021 Percent of Normal Precipitation. Source: High Plains Regional Climate Center,
                                            http://www.hprcc.unl.edu/.

Figure 4. February-March-April 2021 Percent of Normal Precipitation. Source: High Plains Regional Climate Center,
                                          http://www.hprcc.unl.edu/.

                                                        4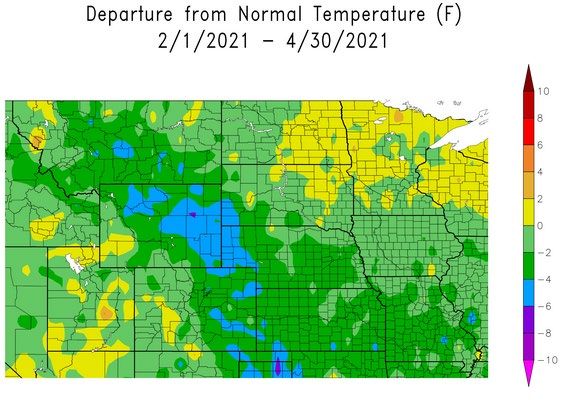
Temperature
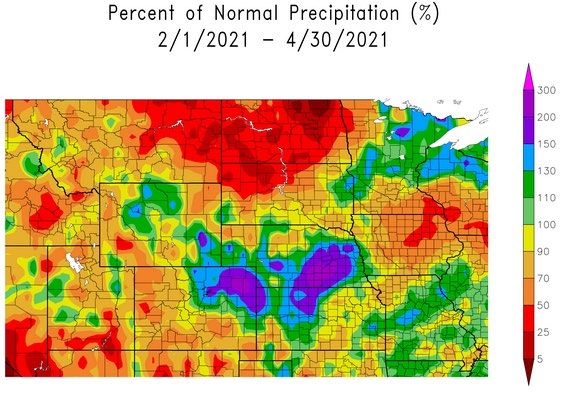
April temperature departures in degrees Fahrenheit (deg F) in Figure 5 indicate slightly cooler-
than-normal temperatures over most of the Basin, ranging from 2 to 4 deg F below normal.
Slightly warmer-than-normal temperatures occurred in small areas of Montana, North Dakota,
South Dakota, and Nebraska. Most of Iowa was up to 2 degrees warmer than normal in April.
February-March-April 2021 temperature departures are shown in Figure 6. The three-month
average departures remain near normal across most of the Basin, tending towards slightly
warmer than normal in the eastern Dakotas, and slightly cooler than normal in the rest of the
Basin. Large areas of Wyoming were up to 6 degrees below normal over the past three months.
Figure 5. April 2021 Departure from Normal Temperature (deg F). Source: High Plains Regional Climate Center,
http://www.hprcc.unl.edu/.
5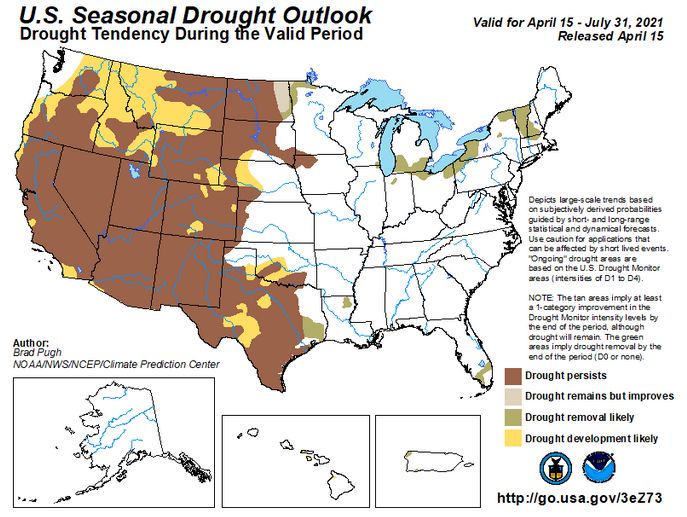
Figure 6. February-March-April 2021 Departure from Normal Temperature (deg F). Source: High Plains Regional
Climate Center, http://www.hprcc.unl.edu/.

Soil Moisture

Soil moisture is factored into the forecast as an indicator of wet or dry hydrologic basin
conditions. Typically, when soil moisture conditions are wet or greater than normal, rainfall and
snowmelt runoff is greater than when soil moisture is dry or less than normal. Not only is soil
moisture a physical parameter that influences runoff, it can be used as an indicator of future
runoff. As the calendar year approaches winter, the soil moisture conditions will provide some
insight into late winter and early spring runoff potential.

Soil moisture at the beginning of May 2021 is drier than normal across the western and northern
portions of the Basin. This is shown in soil moisture estimates from the Climate Prediction
Center (CPC) in Figure 7. Both the soil moisture anomalies and the soil moisture percentiles are
shown in Figure 7. The figure indicates that beginning of May 2021 soil moisture anomalies in
the western and northern portions of the Basin are below normal, while soil moisture in the lower
Basin is still near normal to slightly above normal from March rains. Soil moisture ranking
percentile over most of North Dakota is below the first percentile, meaning soils are extremely
dry.

                                                       6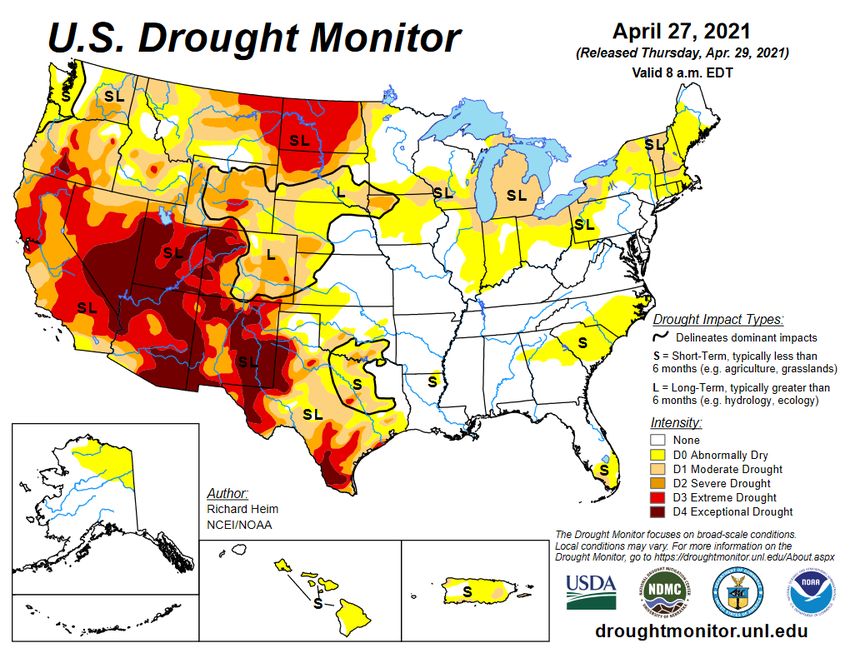
Soil Moisture Anomaly (mm)                                         Soil Moisture Percentile

Figure 7. NOAA CPC Soil Moisture Anomaly (mm) and Soil Moisture Percentile. Source: NOAA NLDAS Drought Monitor
             Soil Moisture. https://www.cpc.ncep.noaa.gov/products/Soilmst_Monitoring/US/Soilmst/Soilmst.shtml

Plains Snowpack

Plains snowpack is an important parameter that influences the volume of runoff occurring in the
basin during the months of March and April. A common misperception is that the March-April
runoff is a result of plains snowmelt only. Historically, about 25% of annual runoff occurs in
March and April, during the time when plains snow is melting, due to both melting snowpack
and rainfall runoff. Runoff occurs in March and April whether or not there is any plains snow to
melt. Determining exact rainfall amounts and locations are nearly impossible to predict more
than a week in advance. Thus, the March-April runoff forecast is formulated based on existing
plains snowpack and existing basin conditions and hydrologic forecasts, which for this year
primarily includes long-term precipitation outlooks. At this time of year, plains snowpack
provides some indication of March-April runoff; however, as the snowpack reaches its ultimate
peak accumulation, better forecasts of future runoff can be made.

Plains snowpack in the Basin has been nonexistent since before April 1, so was not factored into
this May 1 forecast.

Mountain Snowpack

Mountain snowpack is the primary factor used to predict May, June, and July runoff volumes in
the Fort Peck and Fort Peck to Garrison mainstem reservoir reaches. May, June, and July runoff
in the Fort Peck and Garrison reaches has good correlation to the May 1 snowpack. The
snowpack typically peaks in mid-April.

Figure 8 includes time series plots of the average mountain SWE beginning on October 1, 2020
based on the NRCS SNOTEL data for the headwater basin above Fort Peck and the incremental
basin from Fort Peck to Garrison. The current average SWE values (shaded blue area) are
plotted against the 1981-2010 basin average SWE (bold red line), a recent low SWE year in 2001
(green line), and two historic high SWE years occurring in 1997 (purple) and 2011 (dark blue).

                                                            7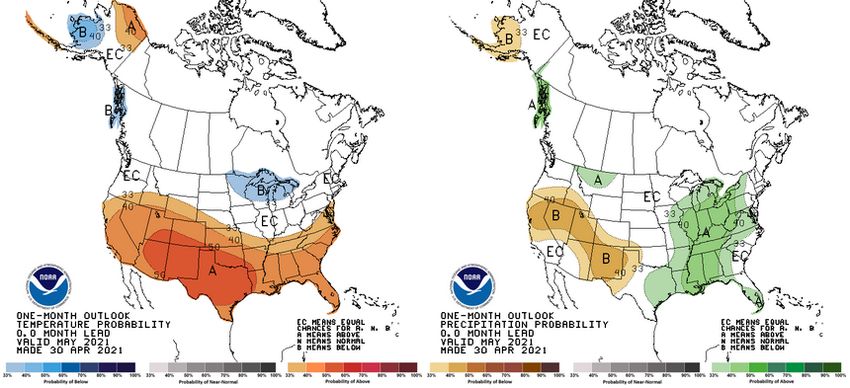
Figure 8. Mountain snowpack water content on May 5, 2021 compared to normal and historic conditions. Corps of
Engineers - Missouri River Basin Water Management.

As of May 5, 2021, the Corps of Engineers computed an average mountain SWE in the Fort Peck
reservoir reach of 10.6 inches, which is 77 percent of average based on the 1981-2010 average
SWE for the Fort Peck reach. Mountain snowpack in the Fort Peck reach peaked on March 31 at
14.1”, which is 86% of the normal peak. In the reservoir reach between Fort Peck Dam and
Garrison Dam, the Corps computed an average mountain SWE of 12.4 inches, which is 93
percent of average based on the 1981-2010 average SWE for the Garrison reach. Mountain
snowpack in the Garrison reach peaked on April 26 at 14.0”, which is 96% of the normal peak.

                                                        8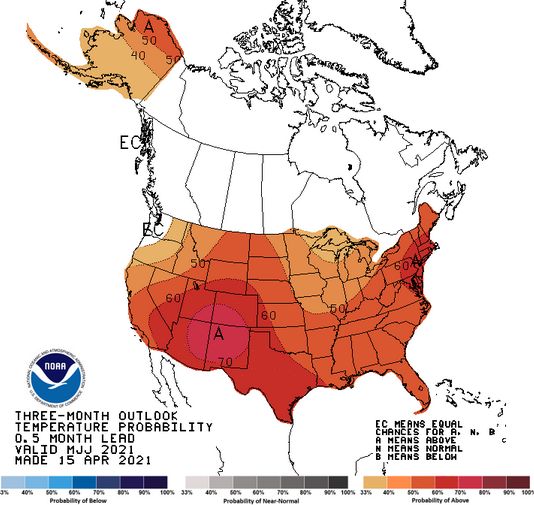
Climate Outlook
MRBWM participates in the monthly North Central U.S. Climate/Drought Outlook Webinar
coordinated through NOAA, the regional climate centers, and the American Association of State
Climatologists (AASC). These webinars provide updates on near-term climate outlooks and
impacts including the ENSO climate pattern and its implications on winter temperature and
precipitation patterns in the Missouri Basin.

ENSO (El Niño Southern Oscillation)

The latest ENSO Outlook indicates that La Nina conditions are present and will likely transition
to ENSO-neutral in the next month or so, with an 80% chance of ENSO-neutral conditions
during May-July 2021. During La Nina conditions there are increased chances for below-normal
temperatures in the upper Basin and increased chances for an above-normal mountain snowpack.

Temperature and Precipitation Outlooks

The NOAA Climate Prediction Center (CPC) outlooks provide the forecasted probability (or
chance) of occurrence of future weather conditions during periods ranging from 1 to 12 months
into the future. The CPC outlooks are available at http://www.cpc.ncep.noaa.gov/.

The CPC temperature outlook through May 19 (Figure 9) indicates equal chances for above-
normal, normal, and below-normal temperatures across the entire Basin. The outlook indicates a
slight increase in the chances for above-normal precipitation over most of the Basin.

             Figure 9. CPC 8-14 Day temperature and precipitation outlooks through May 19, 2021.

                                                     9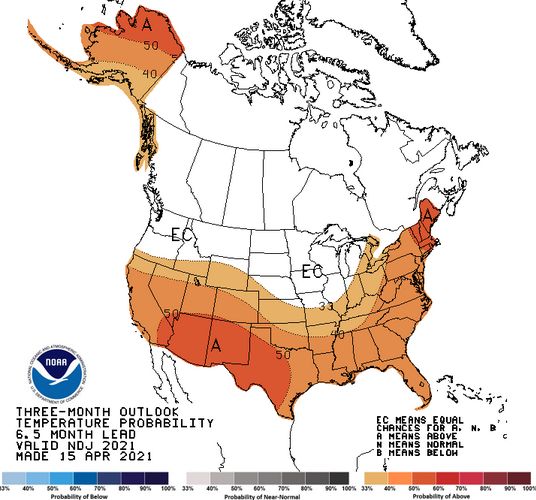
The May CPC outlooks in Figure 10 indicate increased chances for above-normal temperatures
over the southern portion of the Basin and equal chances for precipitation over most of the Basin,
with a slight increase in chances for above-normal precipitation in northern Montana.

                      Figure 10. CPC May 2021 temperature and precipitation outlooks.

Three-month temperature and precipitation outlooks for three three-month periods in 2021 are
shown below in Figure 11-13. During the May-June-July period (Figure 11), the CPC indicates
increased chances for above-normal temperatures and below-normal precipitation over the entire
Basin.

                    Figure 8. CPC May-June-July temperature and precipitation outlooks.

                                                    10
The increased chances for above-normal temperatures and below-normal precipitation over the
entire Basin extend through October (Figure 12). During the November-December 2021-
January 2022 timeframe, the increased chances for above-normal temperatures shift farther south
with equal chances in North Dakota, Montana, South Dakota, Iowa, and eastern Nebraska.
There is a slight increase in chances for above-normal precipitation over Montana, Wyoming,
western North Dakota, western South Dakota, and western Nebraska, with equal chances
elsewhere (Figure 13). As previously noted, though, there is limited confidence in climate
outlooks beyond the winter and early spring, therefore, the climate outlooks will likely change as
the calendar progresses.
Figure 9. CPC August-September-October temperature and precipitation outlooks.
Figure 10. November-December 2021-January 2022 temperature and precipitation outlooks.
11Summary
Given the dry soil moisture conditions and below-average streamflow, we expect runoff to
remain below average during May, but it will depend greatly on rain events. During May, June
and July, Fort Peck and Garrison runoff is forecast to be below average due to the slightly below-
normal mountain snowpack, dry soil moisture conditions, and extended warm and dry outlooks.
In summary, the 2021 calendar year runoff forecast is 17.8 MAF (69% of average).
12Water Supply Forecasts
USDA NRCS National Water & Climate Center
* - DATA CURRENT AS OF: May 06, 2021 12:36:41 PM
- Based on May 01, 2021 forecast values
PRELIMINARY MISSOURI RIVER BASIN FORECASTS
50% % of max 30% 70% min 30-yr
Forecast Point period (KAF) avg (KAF) (KAF) (KAF) (KAF) avg
-------------- ------ ----- ---- ----- ----- ----- ----- -----
Lake Sherburne Inflow (2) MAY-JUL 90 105 107 97 83 73 86
MAY-SEP 105 104 124 113 97 86 101
St. Mary R at Intl Boundary (2) MAY-JUL 420 105 515 460 380 325 400
MAY-SEP 495 105 600 535 455 390 470
Lima Reservoir Inflow (2) MAY-JUL 18.5 37 42 28 9.0 0.000 50
MAY-SEP 19.6 35 45 30 9.1 0.000 56
Clark Canyon Inflow (2) MAY-JUL 3.8 6 53 24 0.000 -12.8 64
MAY-SEP 11.6 14 72 36 0.000 -25 83
Jefferson R nr Three Forks (2) MAY-JUL 305 53 660 445 159 0.000 575
MAY-SEP 315 50 680 460 166 0.000 635
Hebgen Lake Inflow (2) MAY-JUL 245 80 310 270 220 178 305
MAY-SEP 330 81 415 365 295 245 405
Ennis Lake Inflow (2) MAY-JUL 400 75 520 450 350 280 530
MAY-SEP 525 77 670 585 465 380 680
Missouri R at Toston (2) MAY-JUL 1070 72 1650 1310 840 495 1480
MAY-SEP 1270 72 1950 1550 995 590 1760
Smith R bl Eagle Ck (2) MAY-JUL 66 74 120 88 44 11.9 89
MAY-SEP 73 74 135 98 48 10.5 99
Gibson Reservoir Inflow (2) MAY-JUL 340 96 405 365 315 275 355
MAY-SEP 375 95 450 405 345 300 395
Marias R nr Shelby (2) MAY-JUL 245 82 360 290 199 132 300
MAY-SEP 260 83 385 310 210 137 315
PRELIMINARY YELLOWSTONE RIVER BASIN FORECASTS
50% % of max 30% 70% min 30-yr
Forecast Point period (KAF) avg (KAF) (KAF) (KAF) (KAF) avg
-------------- ------ ----- ---- ----- ----- ----- ----- -----
Mystic Lake Inflow (2) MAY-JUL 57 100 64 60 54 49 57
MAY-SEP 72 100 82 76 68 63 72
Wind R ab Bull Lake Ck MAY-JUL 395 92 500 435 355 290 430
MAY-SEP 430 92 545 475 385 315 465
Bull Lake Ck nr Lenore (2) MAY-JUL 122 90 144 131 113 100 135
MAY-SEP 149 90 175 160 138 123 166
Boysen Reservoir Inflow (2) MAY-JUL 470 84 745 580 360 195 560
MAY-SEP 505 82 785 620 390 225 615
Greybull R at Meeteetse MAY-JUL 127 102 168 144 111 87 124
MAY-SEP 175 103 225 195 155 125 170
Shell Ck nr Shell MAY-JUL 50 96 64 56 44 36 52
MAY-SEP 61 97 77 67 55 45 63
Bighorn R at Kane (2) MAY-JUL 660 86 1010 800 520 315 770
MAY-SEP 705 85 1070 850 560 345 830
NF Shoshone R at Wapiti MAY-JUL 380 88 460 415 345 300 430
MAY-SEP 425 88 520 465 385 330 485
SF Shoshone R nr Valley MAY-JUL 180 90 220 196 164 141 200
MAY-SEP 210 89 255 230 192 166 235
Buffalo Bill Reservoir Inflow MAY-JUL 545 87 680 600 495 415 630
MAY-SEP 610 87 755 670 550 465 700
Bighorn R nr St. Xavier (2) MAY-JUL 1100 87 1680 1340 865 515 1260
MAY-SEP 1150 86 1780 1400 895 520 1340
Little Bighorn R nr Hardin MAY-JUL 94 111 137 111 77 51 85
MAY-SEP 107 110 156 127 87 58 97
Tongue R nr Dayton (2) MAY-JUL 90 113 114 100 80 65 80
MAY-SEP 103 112 130 114 92 75 92
Tongue River Reservoir Inflow (2) MAY-JUL 205 117 290 240 168 116 175
MAY-SEP 230 116 325 270 192 137 198
NF Powder R nr Hazelton MAY-JUL 10.4 125 13.5 11.7 9.1 7.3 8.3
MAY-SEP 11.2 124 14.5 12.5 9.9 7.9 9.0
13Powder R at Moorhead MAY-JUL 196 130 305 240 153 89 151
MAY-SEP 215 126 320 260 172 108 170
Powder R nr Locate MAY-JUL 210 128 310 250 170 112 164
MAY-SEP 235 127 335 275 194 133 185
PRELIMINARY RAPID VALLEY UNIT FORECASTS
50% % of max 30% 70% min 30-yr
Forecast Point period (KAF) avg (KAF) (KAF) (KAF) (KAF) avg
-------------- ------ ----- ---- ----- ----- ----- ----- -----
Deerfield Reservoir Inflow (2) MAY-JUL 3.1 79 5.5 4.1 2.1 0.61 3.9
Pactola Reservoir Inflow (2) MAY-JUL 10.4 59 22 15.0 5.8 0.180 17.5
PRELIMINARY PLATTE RIVER BASIN FORECASTS
50% % of max 30% 70% min 30-yr
Forecast Point period (KAF) avg (KAF) (KAF) (KAF) (KAF) avg
-------------- ------ ----- ---- ----- ----- ----- ----- -----
North Platte R nr Northgate (2) MAY-JUL 120 64 215 158 82 27 187
MAY-SEP 134 64 240 177 91 29 210
Encampment R nr Encampment (2) MAY-JUL 77 65 118 94 60 36 118
MAY-SEP 80 63 123 97 63 37 127
Rock Ck ab King Canyon Cnl nr Arlington MAY-JUL 43 90 55 48 38 31 48
MAY-SEP 45 90 57 50 40 33 50
Seminoe Reservoir Inflow (2) MAY-JUL 415 67 650 510 320 177 615
MAY-SEP 445 66 695 545 340 192 670
Sweetwater R nr Alcova MAY-JUL 29 63 52 38 19.3 5.4 46
MAY-SEP 32 64 58 42 22 6.7 50
La Prele Ck nr Douglas MAY-JUL 17.5 117 25 21 14.3 9.6 14.9
MAY-SEP 18.0 122 26 21 14.8 10.1 14.8
North Platte R bl Glendo Reservoir (2) MAY-JUL 415 62 745 550 285 89 670
MAY-SEP 420 60 755 555 285 81 700
North Platte R bl Guernsey Reservoir (2) MAY-JUL 405 60 750 545 270 64 670
MAY-SEP 410 59 760 550 270 60 700
Laramie R and Pioneer Cnl nr Woods Lg (2) MAY-JUL 103 95 141 119 87 65 108
MAY-SEP 114 96 156 131 97 72 119
Little Laramie R nr Filmore MAY-JUL 48 100 63 54 42 32 48
MAY-SEP 52 100 68 59 45 35 52
Max (10%), 30%, 50%, 70% and Min (90%) chance that actual volume will exceed forecast.
Averages are for the 1981-2010 period.
All volumes are in thousands of acre-feet.
footnotes:
1) Max and Min are 5% and 95% chance that actual volume will exceed forecast
2) streamflow is adjusted for upstream storage
3) median value used in place of average
14You can also read