Detection of hidden defects in thin steel plates using GMR sensor arrays
←
→
Page content transcription
If your browser does not render page correctly, please read the page content below
Detection of hidden defects in thin steel plates using GMR sensor arrays
              M. Pelknera, R. Pohla, Th. Erthnera, M.Kreutzbrucka, C. Commandeurb
                           a
                            BAM Federal Institute for Materials Research and Testing,
                                 Unter den Eichen 87, 12205 Berlin, Germany
                  b
                    Tata Steel R&D, Wenckebachstraat 1, 1970 CA IJmuiden, The Netherlands

Abstract
At BAM, the Federal Institute for Materials Research and Testing, a group of scientists develops NDT-
applications based on GMR sensor technology. In particular, the knowledge gained in the field of automated
testing systems based on the magnetic flux leakage (MFL) were combined with GMR sensors to achieve high
resolution testing of ferromagnetic materials.
In cooperation with Europe’s second largest steel producer, Tata Steel Europe, BAM is working on solutions for
the detection of small inhomogeneities in thin steel plates. The objective is to incorporate an automated testing
facility in a production line.
Before setting up an automated testing system, a feasibility study was carried out in order to verify the ability of
GMR-MFL-testing and eddy current testing (ET) for the detection of hidden defects in thin steel plates. For this
purpose, Tata Steel Europe fabricated in a first step test samples of 0.2 mm thick steel plates in which defects of
different depth (5 – 60 µm) were introduced. Only in case of GMR-MFL-testing, we were able to detect parts of
the hidden defects trustworthily with a SNR better than 10 dB. The lift off between sensor and surface was 250
µm. On this basis, we investigated different testing scenarios including velocity tests and different lift offs. The
achieved results for this special testing problem were presented leading to a practical example for GMR-based
testing and paving the way to an automated testing system in a production line.

Keywords: magnetic flux leakage, GMR, hidden defects

1. Introduction
Small inclusions in thin steel plates could lead to defects in further process steps because of
the different material properties. To label areas with inclusions a testing method is needed
which detects these inclusions. Since the magnetic material parameters differ between steel
and inclusion a magnetic testing method in particular GMR-MFL-testing (GMR: giant
magneto resistance; MFL: magnetic flux leakage) could be a solution [1,2]. Therefore, BAM
and Tata Steel evaluated the possibilities of GMR sensor arrays adapted to NDT application
for an in-situ testing during production.
For a validation study Tata Steel provided four test samples – 0.22 mm thick steel plates
(300x210 mm²) containing three rows with 45 notches (each 15 in one row) which are
produced by laser ablation. The profile of the defects is elliptical. Width of the defects ranges
between 80 µm and 220 µm. The depth are 5 µm up to 60 µm and the length are 0.5 mm up to
1.3 mm. Figure 1 shows as an example an optical measurement of the geometry of one notch.
Depicted are two false color rendering plots and two curves of the profile of the notch.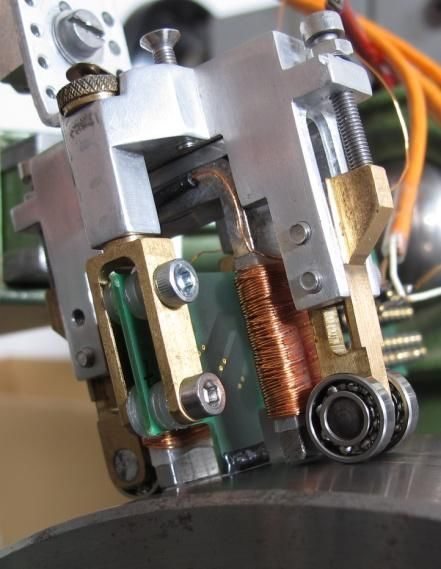
Figure 1: Height profile of an exemplary artificial defect (900x200x50 µm³).

2. MFL-testing using GMR sensors
Testing of all four plates was performed using the GMR-testing facility at BAM [2]. Adapted
GMR sensor arrays (gradiometer, 16 elements measuring the normal field component related
to the surface) are employed [1,2]. A magnetization unit (yoke, coil current 1A) was used to
apply a magnetic field inside the plates. Figure 2 shows a C-scan of a GMR magnetic flux
leakage measurement (GMR-MFL) for test sample 3/8 in 1:2 scale. Here, we scanned one
side in such a way that the notches were at the backside.

        Figure 2: GMR-scan for buried defects (test sample 3/8, scan area 260x140 mm², 1:2 scale).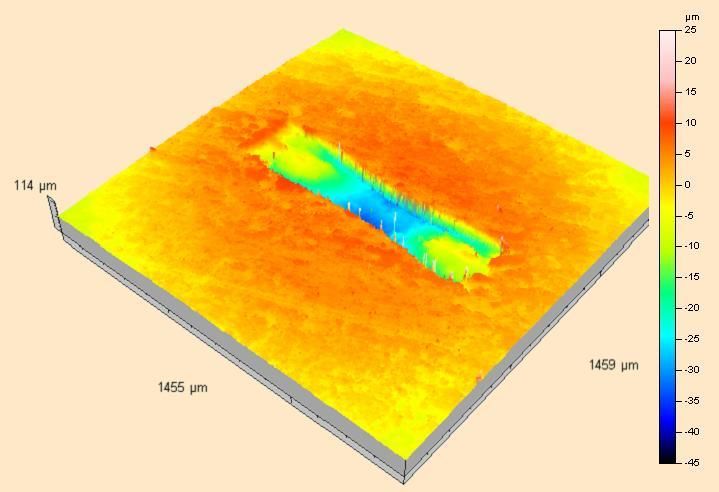
Besides the signals of the notches MFL-signals of real inclusions were detected. These
inhomogeneities were also observed using eddy current testing (EC). The stripes in Figure 2
are caused by different offsets of each GMR element. Using image processing leads to a
cancellation of these stripes (see Figure 3, same measurement like in Figure 2).

Figure 3: GMR-scan (see Figure 2) after image processing (test sample 3/8, scan area 260x140 mm², 1:2 scale).

2.1 Lift off

To investigate signal dependence of increasing lift off (LO, distance sensor-surface) we
performed measurements for three different LOs. Figure 4 (a) presents line scans for LO =
0.1 mm (black curve), 0.25 mm (red) and 0.5 mm (blue) starting at the deepest defect (notch
13 at x = 31.5 mm). Figure 4 (b) details notch 13.

Figure 4: (a) Line scan along one row for three liftoffs (LO = 100µm, 250 µm and 500 µm). (b) section for line
                                    scan along defect 13 (deepest defect).

In addition to the decreasing MFL-signal we observed a decline of “noisy” background
signals indicating that this noise is caused by material properties and roughness of the plate
itself (see for instance Figure 4 (b) black and red curve). Based on their volume and defined
geometry, the MFL signals of the notches can be distinguished from the background signals
Hnoise (noise, roughness, etc.). Table 1 summarizes MFL- and noise signals for the deepest and
smallest defect.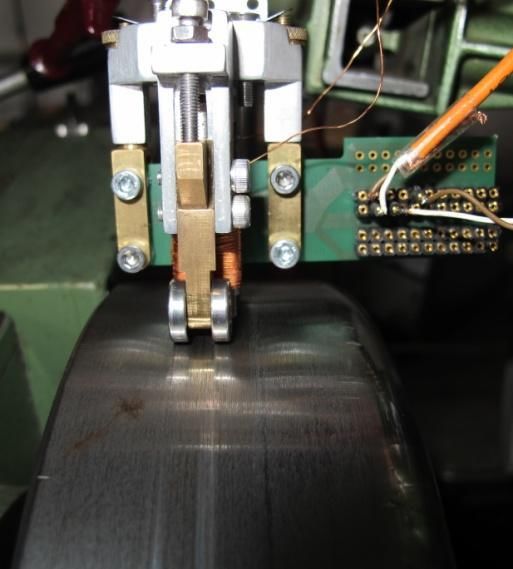
Table 1: MFL signal and background field signals for defect 13 and 1.
                   Lift off [µm]          ΔH [A/m]              Hnoise [A/m]              SNR [dB]
  defect 13             100                 590                      32                     25.3
 depth 45 µm            250                 122                       9                     22.6
                        500                  44                       6                     17.3
   defect 1             100                 156                      32                     13.8
  depth 8 µm            250                  27                       9                      9.5
                        500                  16                       6                      8.5

Increasing LO from 100 µm up to 500 µm leads to a MFL signal loss of 20dB. Since,
background fields decrease with increasing LO, SNR declines in the range of 5 – 8 dB.
Nevertheless, all hidden defects could be resolved with a SNR better than 6 dB.

2.2 Angular dependence

MFL testing has an angular dependence concerning the direction of the applied magnetic field
with respect to the notches. The more cross sectional area of the defect is in the way of the
field the more flux will leak. The preferred field direction is therefore perpendicular to the
notch. However, during rolling of the steel most of the defects are stretched in the rolling
direction. Due to testing principles in a production line the applied field has to be rotated
leading to a non-perpendicular testing of inclusions.
To investigate the influence of rotating the applied field direction towards the defects we
show in Figure 5 a measurement where we rotate the sample 45 degree compared to the
measurement of Figure 2.

    Figure 5: GMR-scan for buried defects. Sample was rotated 45° (scan area 220x220 mm², scale 1:2).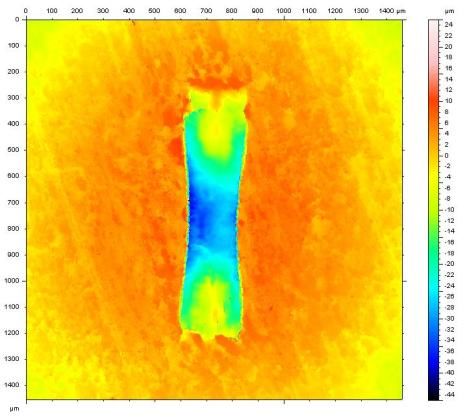
The three rows with the artificial defects could be resolved with a good SNR. In addition,
natural defects which are likely caused by inclusions are detected using GMR-MFL. To
estimate the decline of MFL signals, Figure 6 compares two line scans, (a) 90° and (b) 45°
alignment between defect and applied magnetic field. The MFL-signal of the 45°-case is
reduced by 30% compared to the 90°-measurement.

Figure 6: Left: line scan defect 13 (see Figure 4). Right: Line scan same defect with sample rotated by an angle
                                         of 45° compared to the left scan.

2.3 Influence of scan velocity

Further, we investigated different scan velocities and their influence on MFL signals. Higher
velocities should introduce eddy currents inside ferromagnetic samples. For a testing facility
in a production line this has to be considered since production velocities are in the order of
some meters per second.
For this purpose we used a cylindrical test sample (steel E 295, diameter 229 mm) shown in
Figure 7 on the right. This mock-up was fixed in a turning machine to generate the rotation. In
this mock-up was introduced an artificial crack with following dimensions: length 15 mm,
width 0.5 mm, and depth 1.5 mm.

 Figure 7: Different views of test setup for velocity measurements (left and middle). Right: Scheme of the test
                                                     sample.

We undertook measurements for a velocity range from 0.9 m/s up to 36 m/s. MFL signals
were amplified by a gain factor of 40 dB which were charted by using an oscilloscope.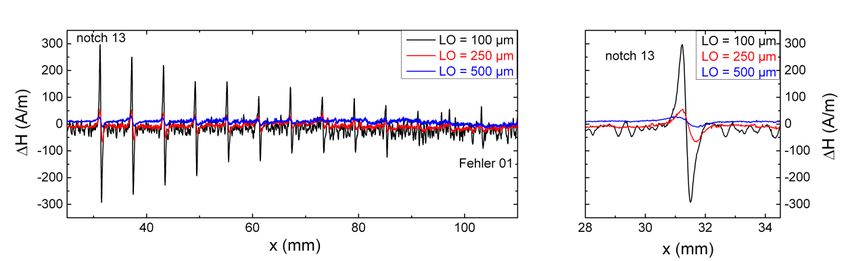
Besides a compressed signal due to increased scan velocity sensor signals are also doubled
unexpectedly (see Figure 8.)

                  Figure 8: Defect signal for v = 2,7 m/s (left), and v = 36 m/s (right).

Table 2 summarizes the voltage signals (peak-peak) for several scan velocities. In addition,
the second row shows signal changes relating to the MFL signal for v = 0.9 m/s in %.

                               Table 2: MFL signals for several scan velocities.

     velocity [m/s]            0.9           2.7             5.4           10.8        21.6            36

     GMR signal [V]           0.63           0.74           0.82           0.98        1.14            1.24

   GMR/GMR(0.9) [%]           100            117            130            156          181            197

3. Eddy current measurements
For further evaluation we performed measurements for the test plates using several eddy
current probes (EC). In table 3 we listed these probes, their operating frequency range, and
specifications.

                                Table 3: Deployed eddy current probes.

    Probe       Frequency range                                      Specification

   KDS 2-2     100 kHz – 800 kHz                   Highly resolving and sensitive differential probe

    AN 05      100 kHz – 500 kHz               Highly resolving absolute probe; excellent resolution

  SK 25 TA-1    15 kHz – 100 kHz              Absolute probe for buried defects; average resolution

   SK 35 TA     10 kHz – 80 kHz               Absolute probe for buried defects; average resolution

In general it was observed that no EC-probe detected the hidden notches (see Figure 9). The
reason is the used frequency of 100 kHz and the skin effect. For ferromagnetic materials skin
depth lies in the order of several 10 µm for f = 100 kHz. High spatial resolution probes need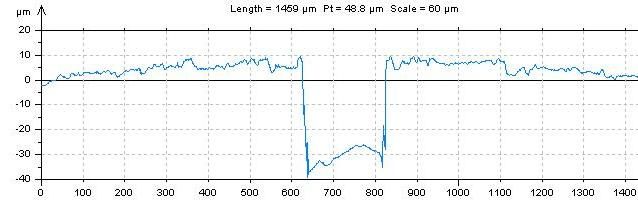
high frequencies in order to reach their capabilities. Probes for low frequency applications
exhibit in general an insufficient detection capability in terms of detection of µm-defects.
Figure 9: Comparison of the results (buried defect detection) for test sample 3/8 using different testing methods:
GMR-MFL (top), eddy current testing using probe KDS 2-2 (middle), and probe SK 35 TA (bottom), scan area
250 x 90 mm².
Figure 9 shows in the top the GMR-MFL measurement and compared to GMR result two EC
scans (middle and bottom) using different EC probes. Inhomogeneities could also be detected
(depicted by the red markers).
The geometrical pattern (also observed optically) is caused by the non-contactless GMR scan.
Here, patting rollers were used to control distance. This induces material changes and has to
be avoided for testing during production. A contactless testing is compulsory.
4. Magnetic particle inspection
For further evaluation of the GMR-MFL testing, we performed magnetic particle inspections
(MP). Two different ferromagnetic powders come into operation – a fluorescent powder
(particle size 4 µm) and a black powder (particle size 0.2 µm). Magnetization was induced by
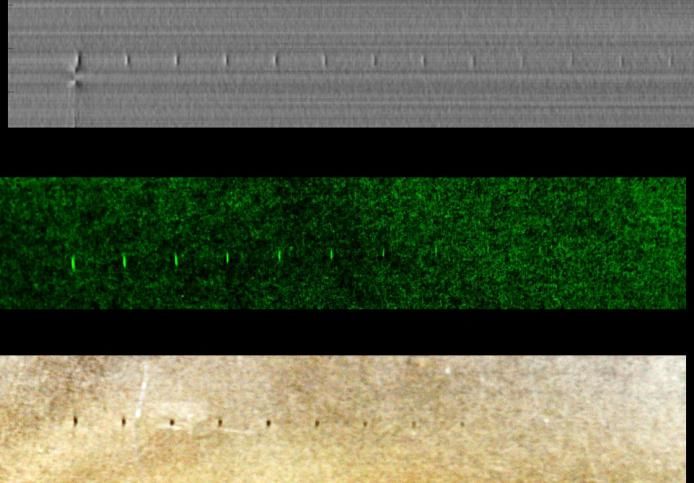
a hand magnet. Figure 10 presents on the top the GMR-MFL scan, in the middle a photo of
the fluorescent powder, and at the bottom a photo using the black powder.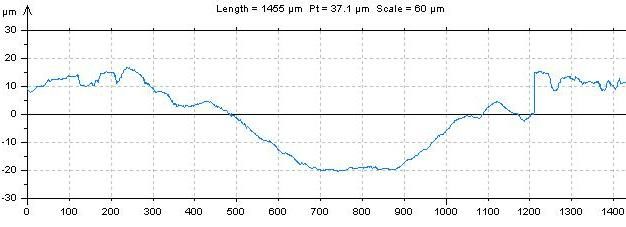
Figure 10: Comparison between GMR-MFL (top), fluorescent magnetic powder (middle) and black magnetic
                                    powder (bottom); scale 1:1.

10 hidden defects of the steel plate could be resolved by MP leading to a detection limit of
MP in the order of a depth of 20 µm and, therefore for a remaining wall thickness of 200 µm
and ~90%, respectively. GMR-MFL was able to detect all 13 defects (hidden) of the
investigated row (max. remaining wall thickness 215 µm, defect geometry from
1300x220x30 µm³ up to 900x170x5 µm³).

5. Conclusion
Small hidden defects in thin steel plates (thickness 220 µm) could be resolved with a good
SNR using GMR sensors and MFL-testing. Defects down to 5 μm where detected with a SNR
of 6 dB in the 0.22 mm thick plates. This limit was rather set by the material noise than by the
noise of the field sensors.
Practical testing situations like the sensor to surface distance (lift off), magnetization angle
towards orientation of the defects, and scan velocity were investigated and should be
controllable in case of an in-situ testing facility built in a production line. We also carried out
alternative testing methods – magnetic particle inspection and eddy current testing which can
be excluded for a in-situ testing.
The inhomogeneities that were detected in addition to the artificial defects will be investigated
in more detail as they are likely due to a real inclusions. Further, development and validation
of new applicable probes for an in-situ testing during production are being drawn up. Here,
challenges are mechanical and electromagnetic conditions. In addition, plates thicker than the
presented plates in this contribution shall be investigated in future.

References

1.    Pelkner, M.; Neubauer, A.; Reimund, V. & Kreutzbruck, M.: Routes for GMR-sensor design in non-
      destructive testing, Sensors, 2012, 12, 12169-12183

2.    Pelkner, M.; Neubauer, A.; Reimund, V.; Erthner, T.; Panke, N. & Kreutzbruck, M.: Automatisierte
      Streuflussprüfung und Bewertung von Zylinderlagerringen unter Anwendung von GMR-Sensorarrays,
      DACH-Jahrestagung 2012, Graz (Österreich)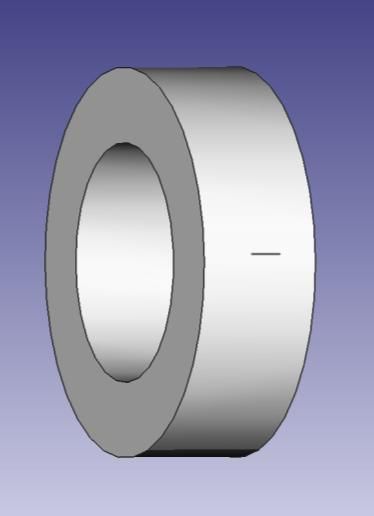
3.   Pelkner, M.; Neubauer, A.; Reimund, V. & Kreutzbruck, M.: Local magnetization unit for GMR array
     based magnetic flux leakage inspection, QNDE 2011 (Burlington, Vermont), Review of progress in
     quantitative nondestructive evaluation, volume 31, American Institute of Physics, 2012, 1005-1012
You can also read