Reply to Comment on Choi et al. Correlation between Ionospheric TEC and the DCB Stability of GNSS Receivers from 2014 to 2016. Remote Sens. 2019 ...
←
→
Page content transcription
If your browser does not render page correctly, please read the page content below
remote sensing
Reply
Reply to Comment on Choi et al. Correlation between
Ionospheric TEC and the DCB Stability of GNSS
Receivers from 2014 to 2016. Remote Sens.
2019, 11, 2657
Byung-Kyu Choi 1, * , Dong-Hyo Sohn 1 and Sang Jeong Lee 2
1 Space Science Division, Korea Astronomy and Space Science Institute, Daejeon 34055, Korea;
dhsohn@kasi.re.kr
2 Department of Electronics Engineering, Chungnam National University, Daejeon 34134, Korea;
eesjl@cnu.ac.kr
* Correspondence: bkchoi@kasi.re.kr; Tel.: +82-42-865-3237
Received: 9 October 2020; Accepted: 22 October 2020; Published: 26 October 2020
Abstract: Choi et al. (2019) suggested that ionospheric total electron content (TEC) and receiver
differential code bias (rDCB) stability have a strong correlation during a period of two years from 2014
to 2016. This article is a response to Zhong et al. (2020), who pointed out that the long-term variations
of the GPS DCBs are mainly attributed to the satellite replacement rather than the ionospheric
variability. In this issue, we investigated the center for orbit determination in Europe (CODE) Global
Ionosphere Maps (GIM) products from 2000 to 2020. In this study, changes in TEC and receiver DCB
(rDCB) root mean squares (RMS) at Bogota (BOGT) station still have a clear correlation. In addition,
there was a moderate correlation between satellite DCB RMS and rDCB RMS. As a result, we suggest
that rDCB can be affected simultaneously by GPS sDCB as well as ionospheric activity.
Keywords: receiver DCB; ionospheric TEC; satellite DCB; root mean squares (RMS)
The Global Navigation Satellite System (GNSS) Differential Code Biases (DCB) is the largest error
source in estimating the total electron content (TEC) of the ionosphere. Many studies have reported
that DCB is affected by a variety of factors [1–6]. There can be significant jumps [7] and other features
in DCB related to the replacement of the receiver and antenna.
Choi et al. [8] showed that ionospheric TEC and receiver DCB (rDCB) root mean squares
(RMS) have a strong correlation during a period of two years from 2014 to 2016. In addition,
they focused on the relation between rDCB stability and ionospheric activity rather than rDCB
itself. However, Zhong et al. [9] pointed out that the long-term variations of the GPS DCBs are
mainly attributed to the satellite replacement rather than the ionospheric variability. Interestingly,
they also focused on the GPS DCB changes and did not mention the relationship between rDCB
stability and ionospheric activity. As suggested by Zhong et al. [9], rDCB and satellite DCB may have a
significant correlation.
In this issue, Choi et al. [8] suggested that changes in the rDCB RMS still have continuity after
the replacement of a receiver. Replacing hardware such as GNSS receivers or satellites can seriously affect
the DCB. However, large changes in DCB with hardware replacement may be usually instantaneous.
For more reliable analysis of the results presented by Choi et al. [8], we investigated the center
for orbit determination in Europe (CODE) Global Ionosphere Maps (GIM) data from 2000 to 2020.
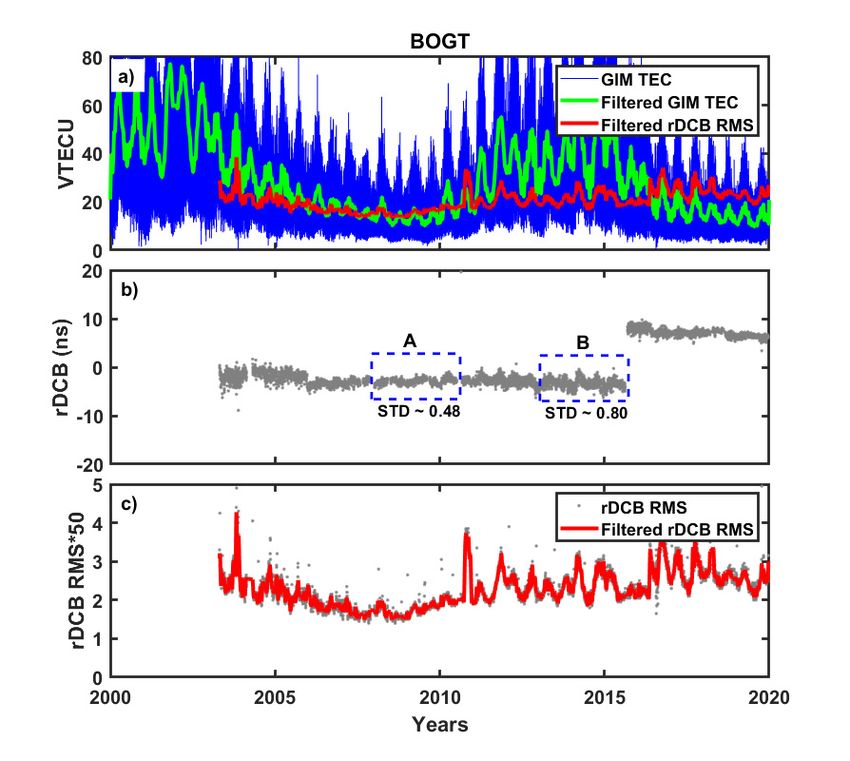
Figure 1 shows the time series of vertical TEC units (VTECU), rDCB, and rDCB RMS (Stability) at
BOGT station, respectively. A band-pass filter was applied to isolate specific changes for GIM-TEC
and rDCB RMS. As shown in Figure 1a, the variations of VTEC are closely related to solar activities.
Remote Sens. 2020, 12, 3510; doi:10.3390/rs12213510 www.mdpi.com/journal/remotesensing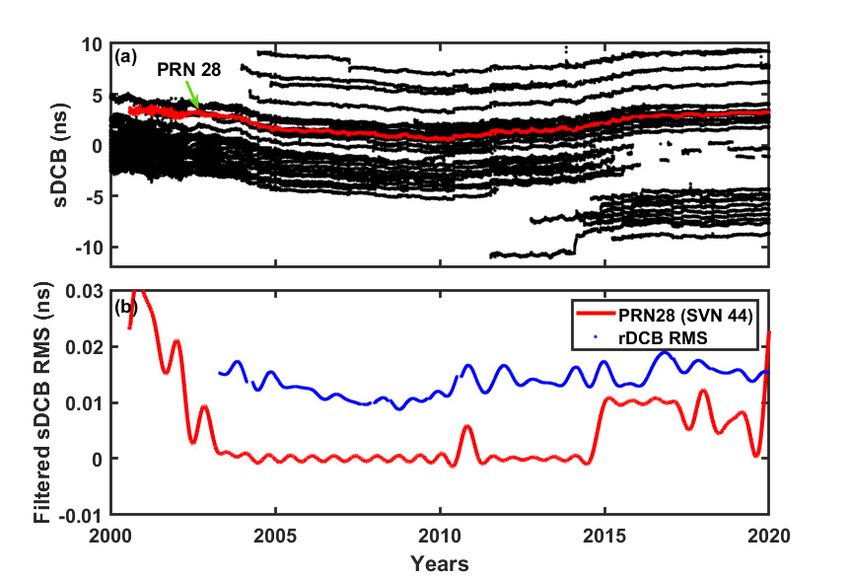
Remote Sens. 2020,
Remote 12,2020,
Sens. 351012, x FOR PEER REVIEW 2 of 5 2 of 4
BOGT station, respectively. A band-pass filter was applied to isolate specific changes for GIM-TEC
andshow
They also rDCBan RMS. As shown
exact annualinand
Figure 1a, the variations
semi-annual of VTEC
cycle. are closely
To analyze the related to solar between
relationship activities. VTEC
and rDCBThey
RMSalsoduring
show anthis
exact annualwe
period, andcalculated
semi-annual cycle. To analyze
band-pass filteredthe relationship
(0~0.05 between
Hz) rDCB RMS VTECplotted in
and rDCB RMS during this period, we calculated band-pass filtered (0~0.05 Hz) rDCB RMS plotted
Figure 1a as a red solid line. In CODE’s GIM products, the rDCB RMS values of the BOGT station
in Figure 1a as a red solid line. In CODE’s GIM products, the rDCB RMS values of the BOGT station
exist only from
exist only2003
fromto 2020.
2003 Filtered
to 2020. rDCB
Filtered rDCBRMSRMSshowed annual
showed annual and
and semi-annual
semi-annual patterns
patterns similarsimilar
to to
GIM-TEC. However, there were no regular changes in rDCB RMS from 2006 to
GIM-TEC. However, there were no regular changes in rDCB RMS from 2006 to 2011, and solar 2011, and solar activity
was relatively
activity weak duringweak
was relatively this period.
during this period.
Figure 1. (a) Time series of vertical total electron content (VTEC), band-pass filtered (0~0.05 Hz) VTEC,
Figure 1.filtered
and band-pass (a) Time (0~0.05Hz)
series of vertical total electron
receiver contentcode
differential (VTEC),
biasband-pass
(rDCB) filtered (0~0.05squares
route mean Hz) VTEC,
(RMS) at
BOGT station (4.64 N, 74.08 W) from 2000 to 2020. The blue and green solid lines indicate(RMS)
and band-pass ◦ filtered (0~0.05Hz)
◦ receiver differential code bias (rDCB) route mean squares at
the variations
BOGT station (4.64°N, 74.08°W) from 2000 to 2020. The blue and green solid lines indicate the
of Global Ionosphere Maps (GIM)-TEC and band-pass filtered GIM-TEC, respectively. The red solid
variations of Global Ionosphere Maps (GIM)-TEC and band-pass filtered GIM-TEC, respectively. The
line indicates band-pass filtered rDCB RMS, taken from the bottom panel c). (b) Time series of GPS
red solid line indicates band-pass filtered rDCB RMS, taken from the bottom panel c). (b) Time series
rDCB values
of GPS rDCB2003
from valuestofrom
2020. The
2003 blue The
to 2020. dashed rectangles
blue dashed “A” “A”
rectangles andand“B”“B”
show
show the
thechanges of rDCB
changes of
with ionospheric
rDCB with activity.
ionospheric (c)activity.
Time series
(c) Timeofseries
rDCB of RMS
rDCB at BOGT
RMS station.
at BOGT The
station. Thegrey
grey dots andred
dots and red solid
solidthe
line denote lineraw
denote
rDCBthe raw
RMS rDCB
andRMS and band-pass
band-pass filtered
filtered (0~0.05
(0~0.05 Hz)Hz) rDCB
rDCB RMS,respectively.
RMS, respectively.
Nevertheless,
Nevertheless, changes
changes in VTEC
in VTEC and and
rDCB rDCB
RMS RMS appear
appear to have
to have a clear
a clear correlation. Figure
correlation. Figure 1b
1b shows
shows the time series of GPS rDCB at BOGT station ◦ (4.64°N,
◦ 74.08°W) from about 2003 to 2020. A
the time series of GPS rDCB at BOGT station (4.64 N, 74.08 W) from about 2003 to 2020. A significant
significant jump in rDCB was detected due to receiver replacement. Changes in rDCB do not show
jump inanyrDCB was detected due to receiver replacement. Changes in rDCB do not show any regular
regular patterns similar to VTEC. Zhong et al. [9] suggested that the variations of rDCB are not
patternscaused
similarbyto
theVTEC. Zhong
ionospheric et al. [9]which
variability, suggested
may be that the variations
consistent of rDCB
with our results. The are
bluenot caused by
dashed
the ionospheric
rectanglesvariability,
“A” and “B” which may1bberepresent
in Figure consistentthe with ourofresults.
changes rDCB inThelow-blue
and dashed rectangles “A”
high-ionospheric
and “B”activity,
in Figurerespectively. The standard
1b represent deviations
the changes of rDCB(STD)
in of rDCB
low- in high-ionospheric
and the two sections “A”activity,
and “B” respectively.
were
about 0.48 and 0.80, respectively. Variations in rDCB can see to be unstable during
The standard deviations (STD) of rDCB in the two sections “A” and “B” were about 0.48 and 0.80, high ionospheric
activity. On the other hand, they are stable when ionospheric activity is relatively low. Therefore,
respectively. Variations in rDCB can see to be unstable during high ionospheric activity. On the other
hand, they are stable when ionospheric activity is relatively low. Therefore, rDCB changes can be
associated with ionospheric activity. In addition, as shown in Figure 1c, rDCB RMS values were small
and stable during low-ionospheric activity.
Figure 2 presents the time series of GPS satellite P1-P2 DCB (sDCB), band-pass filtered (0~1.5Hz)
sDCB, and rDCB RMS from 2000 to 2020, respectively. Changes in DCB for all GPS satellites are shown
in Figure 2a. In Figure 2a, it is not easy to distinguish specific correlations with ionospheric activity inRemote Sens. 2020, 12, x FOR PEER REVIEW 3 of 5
rDCB changes can be associated with ionospheric activity. In addition, as shown in Figure 1c, rDCB
RMS values were small and stable during low-ionospheric activity.
Figure 2 presents the time series of GPS satellite P1-P2 DCB (sDCB), band-pass filtered (0~1.5Hz)
Remote Sens. 2020, 12, 3510 3 of 4
sDCB, and rDCB RMS from 2000 to 2020, respectively. Changes in DCB for all GPS satellites are
shown in Figure 2a. In Figure 2a, it is not easy to distinguish specific correlations with ionospheric
activity in GNSS sDCB changes. To analyze the relationship between sDCB and rDCB, we considered
GNSS sDCB changes. To analyze the relationship between sDCB and rDCB, we considered the most
the most stable satellites with no PRN changes [7,10]. As plotted in Figure 2a, GPS PRN 28 was
stable satellites
selected. with no PRN changes [7,10]. As plotted in Figure 2a, GPS PRN 28 was selected.
FigureFigure
2. (a) 2. (a) Time
Time series
series of all
of all GPSGPSsatellite
satellite P1-P2
P1-P2DCB
DCB(sDCB) from
(sDCB) 20002000
from to 2020. The redThe
to 2020. dotsred
indicate
dots indicate
the changes in DCB values for GPS satellite PRN 28. (b) Time series of band-pass filtered (0~1.5 Hz)
the changes in DCB values for GPS satellite PRN 28. (b) Time series of band-pass filtered (0~1.5 Hz)
sDCB RMS for GPS PRN 28 (SVN 44), and band-pass filtered (0~1.5 Hz) rDCB RMS from 2000 to 2020.
sDCB RMS for GPS PRN 28 (SVN 44), and band-pass filtered (0~1.5 Hz) rDCB RMS from 2000 to 2020.
The red solid line and blue dots represent the filtered RMS changes for GPS satellite PRN 28 DCB and
The red solid
rDCB line and
at BOGT blue
station, dots represent the filtered RMS changes for GPS satellite PRN 28 DCB
respectively.
and rDCB at BOGT station, respectively.
Zhong et al. [9] also reported that the ionospheric activity does not cause the long-term
Zhong et al.of[9]
variations thealso
GPSreported that thesDCBs
sDCB. However, ionospheric activity
have relatively does
large RMSnotvalues
causefor
the long-term
solar maximum variations
from about 2000 to 2003, as shown in Figure 2b. In addition,
of the GPS sDCB. However, sDCBs have relatively large RMS values for solar maximum the filtered sDCB RMS values for GPS
from about
2000 toPRN
2003, 28 show very similar periodic patterns. These cycles can be coincident with a period of a
as shown in Figure 2b. In addition, the filtered sDCB RMS values for GPS PRN 28 show
draconitic year of GPS satellites suggested by Zhong et al. [9]. Furthermore, there was a significant
very similar periodic patterns. These cycles can be coincident with a period of a draconitic year of GPS
jump in changes in GPS PRN 28 sDCB RMS in 2015. In early 2015, CODE changed a solar radiation
satellites
pressure (SRP) by
suggested modelZhong
fromet al.old
the [9].empirical
Furthermore,
CODE orbittheremodel
was a(ECOM)
significant
to thejump in changes
new ECOM2 for in GPS
PRN 28GNSSsDCB RMS in 2015. In early 2015, CODE changed a solar radiation pressure
orbit determination [11]. A change in the CODE SRP model can cause DCB variations. For the (SRP) model from
relationship between sDCB RMS and rDCB RMS, we plotted the band-filtered
the old empirical CODE orbit model (ECOM) to the new ECOM2 for GNSS orbit determination [11]. rDCB RMS as the blue
A changedotsininthe
Figure
CODE2b. There
SRP ismodel
some correlation
can causebetween the two variables.
DCB variations. For theThe correlation coefficient
relationship between (R) sDCB RMS
between the two variables was about 0.58. It indicates that there is a moderate correlation between
and rDCB RMS, we plotted the band-filtered rDCB RMS as the blue dots in Figure 2b. There is some
sDCB RMS and rDCB RMS.
correlationChoibetween thesuggested
et al. [8] two variables.
that the The correlation
correlation between coefficient
TEC and rDCB(R) between
RMS shows thethe
two variables was
apparent
about 0.58.
latitudinal dependency with ionosphere variability. It can be related to TEC distributions. ZhangRMS.
It indicates that there is a moderate correlation between sDCB RMS and rDCB et
Choi et al.
al. [12] [8] suggested
reported that theofcorrelation
that the accuracy between
rDCB estimation TEC and
is dependent on rDCB RMS shows
the receiver’s location.the
Theapparent
rDCB
latitudinal estimation accuracy
dependency can be lower
with ionosphere in low-latitude
variability. It can be regions
relatedbecause
to TECTEC distributionsZhang
distributions. at lowet al. [12]
reported that the accuracy of rDCB estimation is dependent on the receiver’s location. The rDCB
estimation accuracy can be lower in low-latitude regions because TEC distributions at low latitudes
are much more complicated than those at mid and high latitudes [13,14]. Strugarek et al. [15] reported
that the GNSS signal is more affected during the periods of the high ionospheric activity, which causes
problems with precise orbit determination of low Earth orbit satellites. What we emphasize is that it can
be difficult to specifically explain the latitudinal dependency of rDCB with changes in GPS sDCB only.
In general, the global ionospheric TEC is modeled by the spherical harmonic function. To separate
the satellite DCBs and rDCBs in ionospheric GPS-TEC estimation, we consider a constraint that the sum
of all GPS satellite DCBs becomes zero. Under this condition, variables such as TEC, satellite DCBs,
and rDCBs have to be calculated simultaneously. Each of the estimated variables can be influenced byRemote Sens. 2020, 12, 3510 4 of 4
each other. As suggested by Zhong et al. [9], there was a clear correlation between sDCB and rDCB.
However, we suggest that variables are not estimated as an independent variable but are correlated.
Therefore, rDCB can be affected simultaneously by GPS sDCB as well as ionospheric activity.
Author Contributions: Methodology, B.-K.C.; software, B.-K.C.; validation, B.-K.C. and D.-H.S.; investigation,
B.-K.C.; writing—original draft preparation, B.-K.C.; writing—review and editing, B.-K.C., D.-H.S. and S.J.L.;
visualization, B.-K.C. and D.-H.S. All authors have read and agreed to the published version of the manuscript.
Funding: This research received no external funding.
Acknowledgments: The authors would like to thank the IGS for providing GNSS data and IONEX GIM products.
This study was supported by the 2020 Primary Project of the Korea Astronomy and Space Science Institute.
The authors would also like to take the opportunity to thank the editor and the anonymous reviewers for their
constructive comments.
Conflicts of Interest: The authors declare no conflict of interest.
References
1. Sardón, E.; Zarraoa, N. Estimation of Total Electron Content Using GPS Data: How Stable Are the Differential
Satellite and Receiver Instrumental Biases. Radio Sci. 1997, 32, 1899–1910. [CrossRef]
2. Zhang, W.; Zhang, D.H.; Xiao, Z. The influence of geomagnetic storms on the estimation of GPS instrumental
biases. Ann. Geophys. 2009, 27, 1613–1623. [CrossRef]
3. Coster, A.; Williams, J.; Weatherwax, A.; Rideout, W.; Herne, D. Accuracy of GPS total electron content:
GPS receiver bias temperature dependence. Radio Sci. 2013, 48, 190–196. [CrossRef]
4. Zhang, D.; Shi, H.; Jin, Y.; Zhang, W.; Hao, Y.; Xiao, Z. The variation of the estimated GPS instrumental bias
and its possible connection with ionospheric variability. Sci. China Tech. Sci. 2014, 57, 67–79. [CrossRef]
5. Themens, D.R.; Jayachandran, P.T.; Langley, R.B. The nature of GPS differential receiver bias variability:
An examination in the polar cap region. J. Geophys. Res. Space Phys. 2015, 120, 8155–8175. [CrossRef]
6. Choi, B.-K.; Lee, S.J. The influence of grounding on GPS receiver differential code biases. ASR 2018, 62,
457–463. [CrossRef]
7. Xiang, Y.; Xu, Z.; Gao, Y.; Yu, W. Understanding long-term variations in GPS differential code biases.
GPS Solut. 2020, 24, 118. [CrossRef]
8. Choi, B.-K.; Sohn, D.-H.; Lee, S.J. Correlation between Ionospheric TEC and the DCB Stability of GNSS
Receiver from 2014 to 2016. Remote Sens. 2019, 11, 2657. [CrossRef]
9. Zhong, J.; Lei, J.; Yue, X. Comment on Choi et al. Correlation between Ionospheric TEC and the DCB Stability
of GNSS Receiver from 2014 to 2016. Remote Sens. 2019, 11, 2657. Remote Sens. 2020, 12, 3496. [CrossRef]
10. Villiger, A.; Schaer, S.; Dach, R.; Prange, L.; Sušnik, A.; Jäggi, A. Determination of GNSS pseudo-absolute
code biases and their long-term combination. J. Geod. 2019, 93, 1487–1500. [CrossRef]
11. Arnold, D.; Meindl, M.; Beutler, G.; Dach, R.; Schaer, S.; Lutz, S.; Prange, L.; Sośnica, K.; Mervart, L.; Jäggi, A.
CODE’s new solar radiation pressure model for GNSS orbit determination. J. Geod. 2015, 89, 775–791.
[CrossRef]
12. Zhang, D.H.; Zhang, W.; Li, Q.; Shi, L.Q.; Xiao, Z. Accuracy Analysis of the GPS Instrumental Bias Estimated
from Observations in Middle and Low Latitudes. Ann. Geophys. 2010, 28, 1571–1580. [CrossRef]
13. Brunini, C.; Azpilicueta, F. GPS Slant Total Electron Content Accuracy Using the Single Layer Model Under
Different Geomagnetic Regions and Ionospheric Conditions. J. Geod. 2010, 84, 293–304. [CrossRef]
14. Kao, S.; Chen, W.; Weng, D.; Ji, S. Factors affecting the estimation of GPS receiver instrumental biases.
Survey Rev. 2013, 45, 59–67. [CrossRef]
15. Strugarek, D.; Sośnica, K.; Jäggi, A. Characteristics of GOCE orbits based on Satellite Laser Ranging.
Adv. Spa. Res. 2019, 63, 417–431. [CrossRef]
Publisher’s Note: MDPI stays neutral with regard to jurisdictional claims in published maps and institutional
affiliations.
© 2020 by the authors. Licensee MDPI, Basel, Switzerland. This article is an open access
article distributed under the terms and conditions of the Creative Commons Attribution
(CC BY) license (http://creativecommons.org/licenses/by/4.0/).You can also read