SOUTH AUSTRALIAN TOURISM INDUSTRY COUNCIL SA TOURISM BAROMETER - SEPTEMBER QUARTER 2018 - TICSA
←
→
Page content transcription
If your browser does not render page correctly, please read the page content below
South Australian Tourism Industry Council
                              SA Tourism Barometer – September Quarter 2018
Headline:      Industry Remains Optimistic as Activity Index Grows by 9% and Outlook Index by 8%
The SATIC Barometer for the September quarter 2018 showed an increase in both the activity and short-term outlook indexes which
is consistent with other indicators of growth. In particular there was a substantial lift in employment with the number of persons
working in the accommodation and food services sector at August 2018 increasing by 18% from August 2017 – full time jobs up 31%
and part time up 12%. Challenges for the future include the potential for continuing hot dry weather in some regions.

The SATIC business activity index for the September 2018 quarter improved was up by 9% from the June quarter to reach 125
points. The business outlook index for the next three months also improved, up by 8% to 132 points.

                                          Business Activity in the Last 3 Months

In the September quarter of 2018 the proportion of survey respondents reporting improved business activity when compared to the
same period last year was 52% – up from 49% at the June survey. The proportion experiencing weaker conditions was 27% – down
from 34% at the previous survey. As a result of these changes the performance index was up from 115 to 125 points – an increase of
9%.
Factors influencing performance were:
    •   Consumer confidence has improved;
                                                                1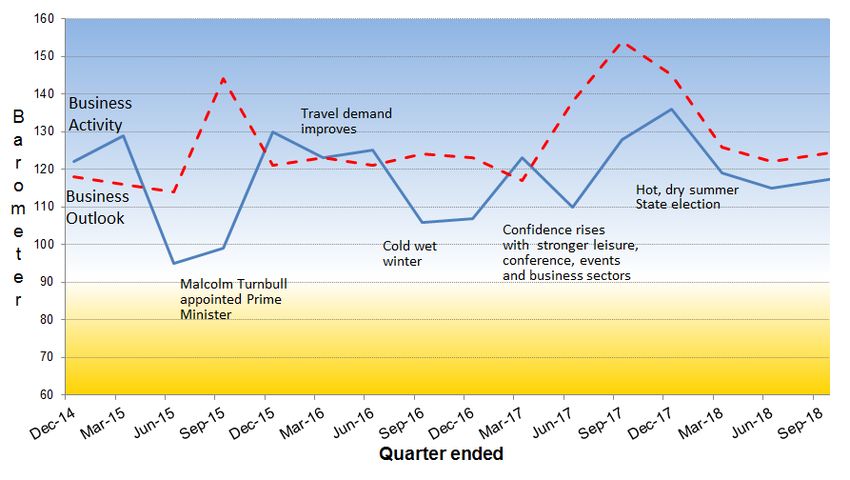
•   Contract workers;
    •   Digital advertising;
    •   Expanded capacity / product offering;
    •   Great Southern Rail – Ghan and Overland;
    •   Grey Nomads;
    •   Linkage with Great Ocean Road;
    •   Lower dollar;
    •   School groups;
    •   Shakka the Shark exhibition and Virtual Reality experience;
    •   The Bend V8 race – Tailem Bend
    •   Tourism award;
    •   Travel Auctions;
    •   Visiting clubs / sporting activity;
    •   Working with agents / tourism trade.
Less favourable:
    •   Consumers more value conscious;
    •   Fewer large conferences in Adelaide (2,000 plus);
    •   Focus in the media on the drought has had a negative impact on demand in some areas;
    •   Financial pressure on households;
    •   Increased competition / Airbnb;
    •   Rising fuel costs.
The respondents were asked for which market sectors activity had increased or decreased.

                                                  Business Activity by Sector

When compared on the basis of sector, the holiday / leisure sector was the most positive with the activity index at 118. The business
sector was evenly poised with an index of 100 while the index for festivals and events was 95 points and conferences and business
meetings was at 92 points.
When compared with the previous survey the holiday / leisure sector index was up by 10%, the business sector index was down by
9%, conferences / business meetings sector was down by 7% while the festivals and events sector was down by 6%.
An index above 100 indicates growth with more businesses experiencing an increase from this market when compared to those
experiencing contraction. An index below 100 indicates more businesses experienced weaker conditions.

                                                                 2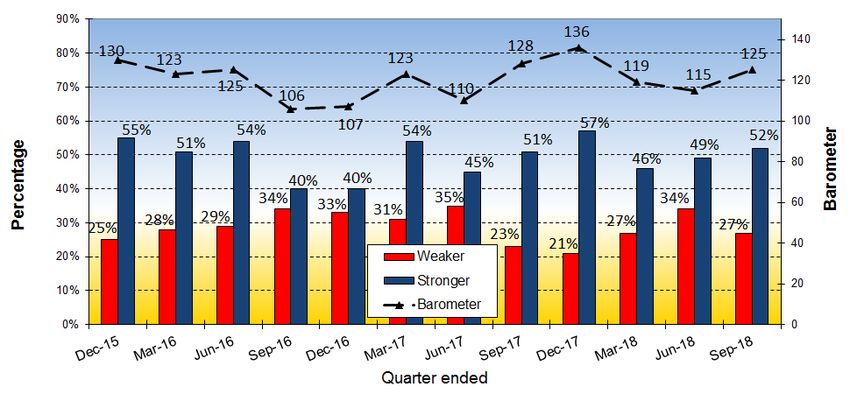
The respondents were asked whether they expected business conditions to be stronger or weaker over the next three months when
compared to the same period in 2017.
                                          Business Outlook for the Next 3 Months

In the September 2018 quarter the short-term business outlook index increased by 8% to reach 132 points. The proportion
expecting improved performance improved from 43% to 54% while the proportion expecting weaker performance was consistent
with the previous survey at 22% (previously 21%).
Factors influencing the outlook for the short term included:
    •    Demand for winery tours;
    •    Expand the VIC offering for visitors;
    •    Forward bookings;
    •    International leisure business;
    •    More forward booking due to improved digital presence;
    •    More events planned;
    •    More shark sightings;
    •    Social media advertising / online presence.

Less positively:
    •    Drought;
    •    Fewer events – ashes cricket & Pacific School Games in 2017;
    •    Forward bookings are poor;
    •    Impact of Airbnb and backpacker tax;
    •    Less coach business;
    •    Limestone Coast not supported by SA Tourism;
    •    Poor yields / competition based on discounting.

                                                                3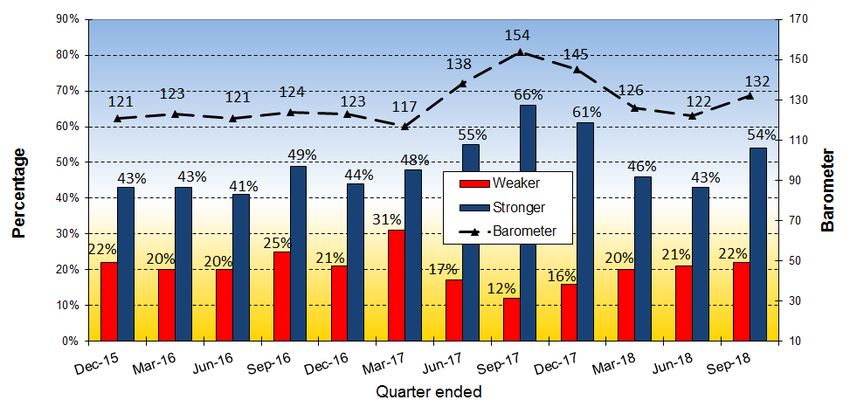
The outlook for the next 12 months was as follows:

                                        Business Outlook for the Next 12 Months

In the September 2018 quarter survey, 21% of the respondents were ‘extremely confident’ regarding the prospects for the next 12
months and 55% were ‘confident’. The proportion ‘confident’ or ‘very confident’ (76%) was consistent with the previous survey result
(75%) and down somewhat from the March quarter survey (83%).
Factors underpinning business confidence in the longer term were:
    •    Building capacity and improving business performance;
    •    Chinese visitors / incentives;
    •    Marketing of Flinders Ranges by SATC;
    •    Opening of the Port Pirie sports precinct;
    •    Seeing a return on business investment;
    •    State liberal government more focused on tourism;
    •    Touring / Grey Nomad market;
    •    Weaker $A.
Less positive:
    •    Airbnb;
    •    Backpacker tax;
    •    Council proposal for free camping area which will compete with our business;
    •    Customers are more price focused rather than comparing product;
    •    Drought;
    •    Fuel prices;
    •    Households are under increasing cost of living pressures;
    •    State marketing by SATC lacks impact.

                                                                 4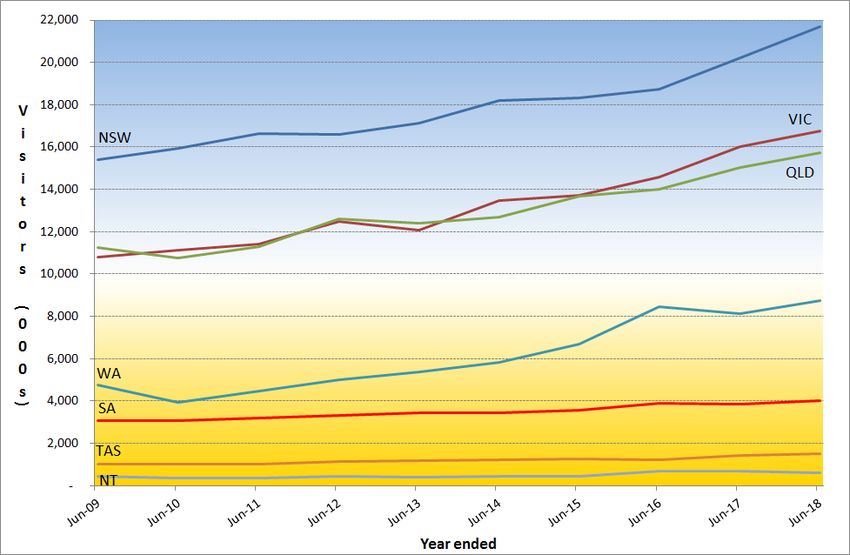
Employment
Respondents were asked whether the number of people employed in their business had increased, decreased or remained the same
when compared to the same period last year.
                                                     Employment Trends

In the September 2018 quarter survey 23% of the respondents had employed additional staff in their business – up from 17% at the
previous survey.
Further information regarding employment trends from the ABS Labour Force survey follows.

Wages
The respondents were asked whether their wages bill, when compared to the same quarter last year, had increased or decreased.

                                                           Wages Bill

In the September 2018 quarter survey 44% of the respondents reported that their wages bill had increased – up from 33% at the
June quarter survey and 40% at the March quarter survey.
The increase was due in most cases to employing more staff or extending staff hours. In some instances, increase in awards was
mentioned. Employing more casual staff hours could also increase wage costs. A decrease was due to employing fewer staff or
requiring staff for fewer hours.

                                                                5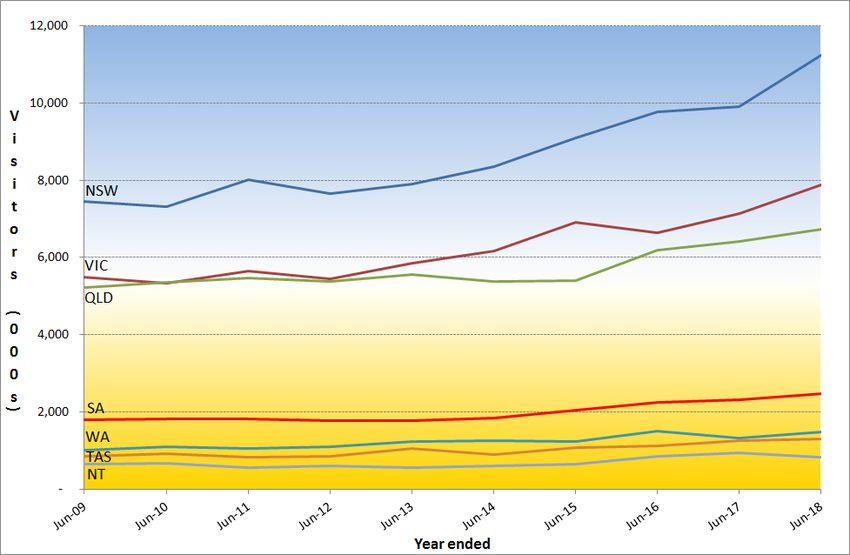
Investment
Respondents were asked whether they were planning more or less investment in their business over the next 12 months compared
to the previous 12 months.
                                                    Planned Investment

In the September 2018 quarter survey 46% were planning more investment in their business – up from 34% June quarter survey and
consistent with the March quarter survey - 49%.

About the SATIC Tourism Barometer
The SATIC Tourism Barometer is a quarterly survey of SATIC members designed to measure recent activity levels and the outlook for
the future. The Barometer survey is conducted on-line and a total of 91 members responded to the September 2018 quarter survey.
Report prepared by independent research consultants – Greenhill Research and Planning.

                                                               6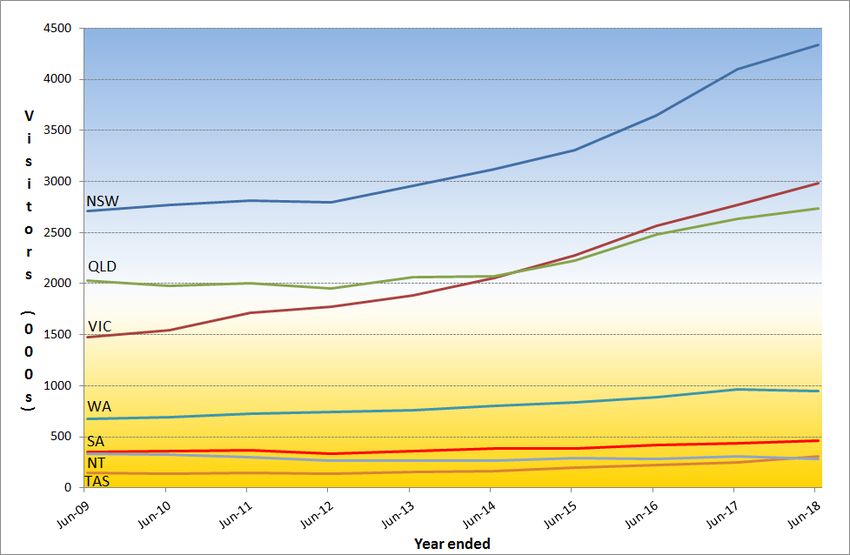
Annual Performance to June 2018
Information regarding travel demand in Australia is collected by Tourism Research Australia through two national sample surveys, the
National Visitor Survey and the International Visitor Survey.

                                     Overview of Overnight Visitor Demand for South Australia

Tourism Research Australia. http://www.tra.gov.au/research

The number of overnight visitors in SA in the year to June 2018 was 6,959,000 – up by 6% from the previous year. Interstate demand
was 2,464,000 up 6% – while the number of intrastate visitors was 4,031,000 – up by 5%. International visitor demand was 464,000 –
up by 7%.
                                                  International Visitors by State / Territory

Tourism Research Australia. http://www.tra.gov.au/research International Visitor Survey.

In the year ended June 2018 the number of international visitors to South Australia increased by 7% to reach 464,000 visitors.
Nationally, international demand grew by 6%. Visitation from New Zealand to SA was up 13% while Europe and North America were
both up by 8%. Asia, including China, remained steady – up by 1% overall.

                                                                                7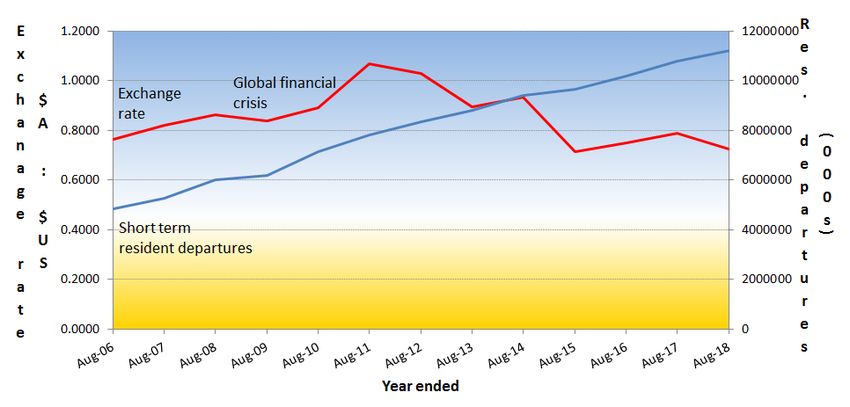
Interstate Visitors by State / Territory

Tourism Research Australia. http://www.tra.gov.au/research National Visitor Survey.

In the year ended June 2018 the number of interstate visitors to South Australia increased by 6% to reach 2,464,000 visitors.
Nationally, interstate travel demand grew by 9%. Due to a change of sampling methodology the NVS is subject to a break in series
from 2014.
                                                    Intrastate Visitors by State / Territory

Tourism Research Australia. http://www.tra.gov.au/research National Visitor Survey

In the year ended June 2018 the number of intrastate visitors in South Australia grew by 5% from the previous year to 4,031,000
overnight visitors. Nationally intrastate travel demand grew by 9%. Due to a change of sampling methodology the NVS is subject to a
break in series from 2014.

                                                                               8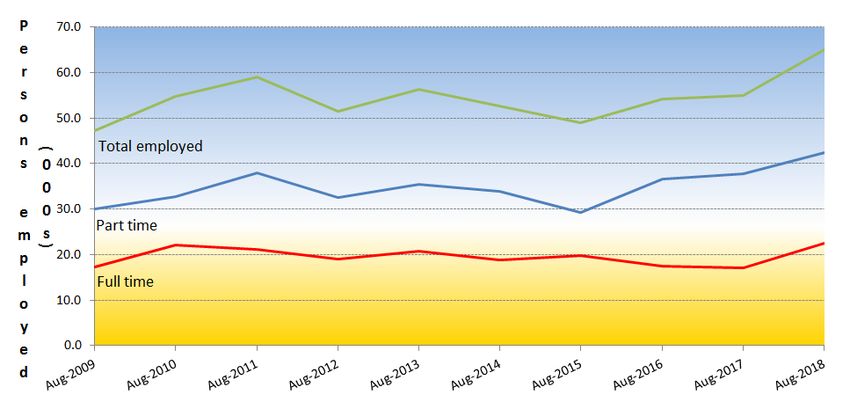
Other Indicators
Information regarding short term overseas departures by Australian residents is published by the Australian Bureau of Statistics.
                     Trend in Short Term Australian Resident Departures and $A - $US Exchange Rate

Source: Australian Bureau of Statistics Cat. 3401.0 - Overseas Arrivals and Departures.
Reserve Bank of Australia. http://www.rba.gov.au/statistics/frequency/exchange-rates.html The data is the specified point in time and does not represent the interim
periods.

In the year ended August 2018 there were 11.23 million short term resident departures from Australia – an increase of 4.2% from the
previous year. From the year ending August 2006 the average annual increase in outbound travel has been 7.3% per annum.
The Australian Bureau of Statistics publishes information regarding employment across a range of industry categories. At State level
accommodation is combined with food services.

                              Employment in Accommodation and Food Services in South Australia

Source: Australian Bureau of Statistics. Cat. 6291.0.55.003. Labour Force Australia, Detailed.

The Labour Force figures for South Australia for the month of August 2018 showed an increase in total employment with the
number of persons employed in the accommodation and food services sector rising by 18% from August 2017 to 65,000. Full time
employment was up by 31% to 22,500 while part time employment was up by 12% to 42,400.
Due to the seasonal nature of employment in the accommodation and food services industries annual comparisons may vary
depending on the point in time at which the comparison is made.

                                                                                   9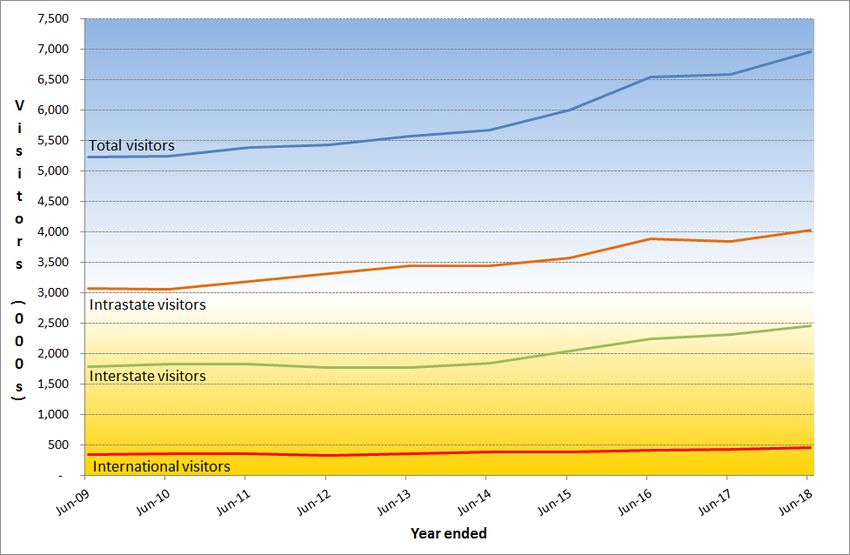
Australian Accommodation Monitor
Tourism Research Australia has released the results of the Australian Accommodation Monitor for 2017-18. The Accommodation
Monitor is a survey of accommodation where operators report key performance data relating to occupancy and yield. Key findings
for South Australia were as follows:
Room nights % change from
Accommodation Occupancy RevPar
occupied (000s) 2016/17
Hotels & Resorts 1,949 2.1% 77.4% $120.57
Motels, Private Hotels,
869 5.6% 64.9% $79.72
Guest Houses
Serviced Apartments 739 3.6% 79.2% $132.05
Holiday Parks 176 0.0% 61.8% $81.51
Total SA 3,836 4.0% 75.6% $116.94
Regional SA 1,185 3.1% 61.2% $84.00
Source Tourism Research Australia: Australian Accommodation Monitor, 2017-18.
Occupancy – Room nights occupied / Total room nights of supply
Rev/Par – Revenue per room night of supply.
Total room nights sold in SA in 2017-18 was 3,836,000 – up by 4% from the previous year. Occupancy was 75.6% overall – up by 1.3
percentage points while RevPar was $116.94 – up by $6 from the previous year. For Australia as a whole, room nights sold was
77,985,000 – up by 3.3%. Occupancy was 76.0% and RevPar was $142.90.
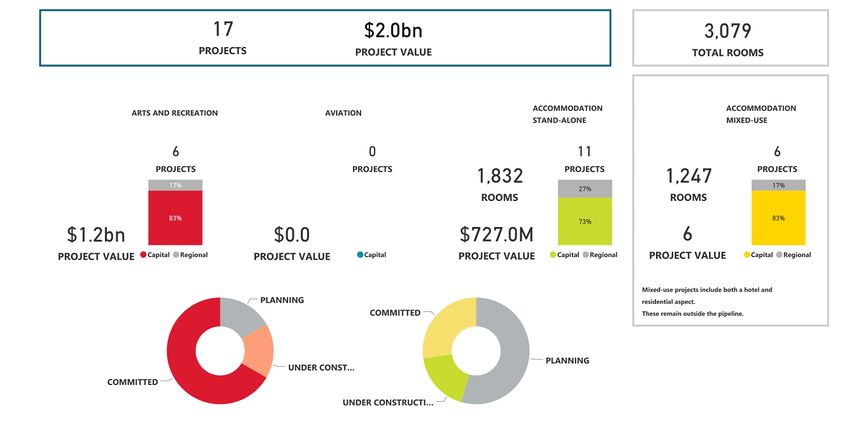
Australian Investment Monitor
Tourism Research Australia has also recently released the results of the Australian Accommodation Monitor for 2017-18. The survey
monitors the number and value of significant tourism projects in the investment pipeline. Projects cover accommodation; arts,
recreation and business services; and aviation. The results for South Australia were as follows.
Source Tourism Research Australia: Australian Investment Monitor, 2017-18.
In South Australia there were 17 projects identified with a total project value of $2.0 billion. For Australia as a whole there were 213
projects identified with a value of $44.0 billion. In the 2016-17 financial year the value in South Australia was $2.1 billion and $37.8
billion in Australia as whole.
10Adelaide Airport – Passenger Movements
Passenger movements through Adelaide Airport for the financial year 2017/18 were as follows:
Pax (000s) 2017/18 2016/17 % change
Domestic * 7,415 7,138 3.9%
International 1,005 952 5.5%
Total 4,293 4,142 3.6%
Source: Adelaide Airport - * includes regional
Domestic movements were up by 3.9% for the 2017/18 financial year while international passenger movements were up by 5.5%.
For the June quarter total movements were up by 4.5% when compared with the June quarter of 2017 – up 4.3% for domestic and
6.2% for international.
Growth was supported by new routes and additional capacity to destinations such as Avalon, Hobart and Kangaroo Island have
stimulated domestic growth.
Service increases during the financial year have come from Fiji Airways, Qatar Airways, China Southern, Singapore Airlines, Jetstar
and Air New Zealand.
China Southern will increase to five flights per week between Adelaide and Guangzhou from October 28 th with daily services in peak
periods.
Both Malaysia Airlines and Cathay Pacific have also announced service increases in the second half of 2018.
11You can also read