NORTH AMERICAN MARKET CONTINUES TO BE ATTRACTIVE - Chris Brown President, Vestas North America
←
→
Page content transcription
If your browser does not render page correctly, please read the page content below
NORTH AMERICAN MARKET CONTINUES TO BE
             ATTRACTIVE
                     Chris Brown
           President, Vestas North America

            Copenhagen, 29 November 2018
CHRIS BROWN
Vestas, North America

                                Vestas WTG Sales
                                North American Order Intake (MW)

                                                           3.700   3.600

                                                   3.077

                                           2.189

                                   1.733

                                   2013    2014    2015    2016     2017   2018

 2   Capital Markets Day 2018
AGENDA

                               North American Market
                               Vestas North America

                               Summary and Q&A

3   Capital Markets Day 2018
PTC GLIDEPATH CARRIES US MARKET THROUGH 2023
US Industry has 5+ years of policy certainty
North American Installations (MW)

  14.000       PTC                 100%   100%      80%         60%            40%
               Value
  12.000
  10.000
      8.000
      6.000
      4.000
      2.000
         0
                   2018            2019   2020     2021         2022           2023
                                                                        Source: MAKE and Vestas

              Key highlights

  • Organic demand for renewable energy continues to grow … 43% of Fortune
    500 companies have RE goals, 9 states strengthening RE goals

  • 11 GW of 2021 installations enabled by 80% PTC components. 80% and 60%
    levelized economics equivalent to today

  • Largest US utilities (MidAmerican, PacifiCorp, AEP, Xcel) leading the industry

  4     Capital Markets Day 2018
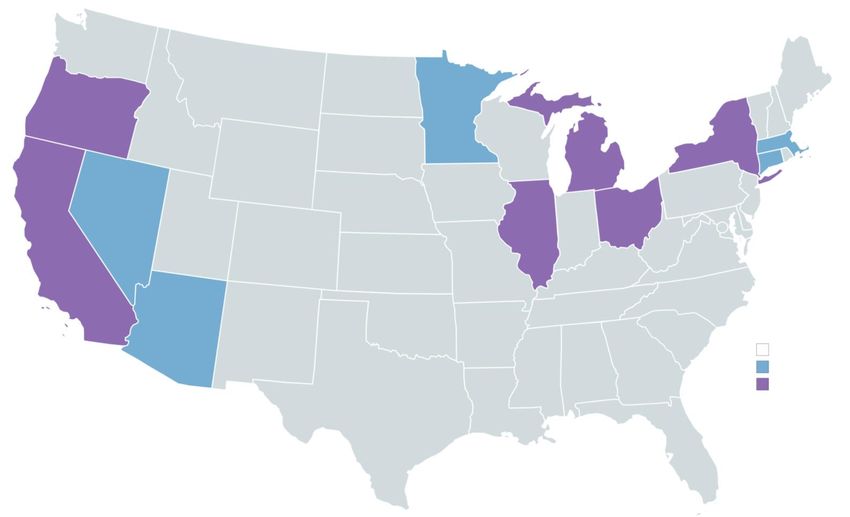
RPS DEMAND EXPECTED TO REMAIN IN 2021
States continuing with renewable targets despite lack of federal support

                                                                2021 Projected RPS Gaps

                                      2040                              2030
                                                                                                               2035
                                    2,045MW                             2,197
                                                                                                   2030      3,800MW
                                                                                        2021       4,390
                                                                                         500                2040
                                         2040                                                              938MW
                                       1,400MW                                             2026
                                                                                 2025
                                                                                           2,456
                                                                                800MW

                                     2045
                                   9,400MW
                                                  2030
                                                 490MW

                                                 2021 Compliance Gap with proposed expansions
                                                 2021 Compliance Gap

 5   Capital Markets Day 2018
ORGANIC GROWTH OF RENEWABLES CONTINUES
Despite headwinds, renewable energy remains in demand

 6   Capital Markets Day 2018
PPA PRICES IN USA

US PPA Landscape                                                                                                                       Key highlights

$200
                                                                                                                            1. PPA prices have fallen 76% since 2009
$180
                                                                                                                            2. Product dimensions double in 3 years:
$160
                                                                                                                               2017: V110 @ 2MW, 9,498m of swept area
$140                                                                                                                           2020 V150 @ 4.2MW, 17,663m of swept area

$120                                                                                                                        3. Asset class maturity attracting institutional
                                                                                                                               capital, driving down Cost of Capital
$100

 $80                                                                                                                        4. Project durations growing to 30+ years

 $60

 $40

 $20

  $0
         2008      2009       2010   2011   2012   2013   2014   2015   2016   2017   2018   *Source: S&P Global Market Intelligence
                                                                                             **Source: Wind PPA US DOE
                                                                                             ***Source: Solar PPA BNEF

              Average Wind PPA**              Power Price*        Average Solar PPA***

  7    Capital Markets Day 2018
NORTH AMERICAN WIND INDUSTRY FULLY MATURE
Wind infrastructure is built and here to stay

Cumulative North American installations (MW)                          Key highlights

120.000
                                                               1.   NORTH AMERICA TO BREAK 100 GW IN 2018:
                                                                    Supply chain, transportation, and service infrastructure
100.000                                                             fully mature

                                                               2.   SUPPLY CHAIN ACROSS ALL 50 STATES: Wind bi-
 80.000                                                             partisan political support stems from >500
                                                                    manufacturing facilities and 100,000+ jobs across the
                                                                    country
 60.000
                                                               3.   WIND POWERS AMERICA: Wind energy now delivers
                                                                    over 30% of the electricity produced in four states:
                                                                    Iowa, Kansas, Oklahoma, and South Dakota.
 40.000
                                                               4.   WIND FOR FUEL: Utilities across the country are
                                                                    retiring coal plants and replacing with new wind
 20.000
                                                                    generation

                                                               5.   GROWTH OF REPOWERING: 2.1 GW of projects
      0
                                                                    repowered in 2017

                                                Source: AWEA

  8   Capital Markets Day 2018
AGENDA

                               North American Market
                               Vestas North America

                               Summary and Q&A

9   Capital Markets Day 2018
VESTAS TAKES TOP SPOT IN US INDUSTRY
Commercial success a function of best products, best team

                                                                              Key methods to gaining market share
  U.S. market share of wind turbine manufacturers by MW
 100
                                                                         1.   Making Markets: Introducing utility customers to
  90
                                                                              the value of wind ownership and educating them
  80                                                                          on how to be successful
  70
                                                                         2.   Best Products: 2MW and 3/4MW offerings
  60

  50
                                                                         3.   Efficient Manufacturing: Strategically located
                                                                              manufacturing plants for transport optimization
  40

  30                                                                     4.   Best Team: Relentless focus on customer
                                                                              intimacy and value engineering to drive loyalty in
  20                                                                          the market
  10

      0
       2013                  2014           2015           2016   2017

                Vestas              GE   Siemens   Other

Source: AWEA

 10     Capital Markets Day 2018
VESTAS IS THE LARGEST OPERATOR IN NORTH AMERICA
Scale and technology enable Vestas to have the lowest operating costs
Vestas 23,902
GE 14,243
NextEra
EDF
SiemensGamesa
Avangrid
Duke
Suzlon
EON
NRG
Diamond (MHI)
Invenergy
EDPR
Nordex Acciona
Senvion
AES
Noble
Allete
Other
Goldwind
Source: MAKE
11 Capital Markets Day 2018VESTAS TRANSITIONING FROM TURBINE SUPPLIER TO SOLUTIONS
PROVIDER
Bringing the widest breadth and depth of solutions to serve the industry
Equipment Supply Construction Service Repower
Full Suite of Service
2014 V100 Logistics & Commissioning
Offerings
Full Suite of Service
2015 V110, V136 Logistics & Commissioning
Offerings
Full Suite of Service
2016 V116, V136 Logistics & Commissioning Offerings
Mulitbrand
Full Suite of Service
2017 V120, V136, V150 EPC Offerings Clipper 2.5, V80
Multibrand
Full Suite
V120, V136, V150, Hybrid Clipper 2.5, V80, MM92 +
2018 Systems
EPC Multibrand
more to come
Variable Pricing
12 Capital Markets Day 2018PROJECT DEVELOPMENT
Entering earlier in the value stream brings value to our customers and to Vestas
Optimize Technology Value Creation Development
Entering the process earlier allows By increasing influence on the levers that Ownership of development assets allows
Vestas to tailor the technical solution drive project returns, Vestas is in a Vestas to bring more projects or
and increase the impact of value stronger position to reduce price pressure qualification options to customers
engineering in the market
13 Capital Markets Day 2018VESTAS MODULAR 2 MW PLATFORM CREATES UNIQUE OPPORTUNITY
With 90, 100, 110, 116, and 120m rotors, Vestas has maximum product flexibility
BP Clipper Prototype Adapter Installation - Flat Ridge, Kansas Repower Platforms (2005-2011 Vintage)
40.000
Other - 2.122
35.000
MWT 2.4 - 1.224
30.000 Clipper - 1.452
25.000 Vestas 3.0 - 1.838
Suzlon 2.0 - 2.302
20.000
Gamesa 2.0 - 2.529
15.000
Vestas 2.0 - 5.400
10.000
SWT 2.3 - 5.427
5.000
GE 1.5 - 18.377
0
14 Capital Markets Day 2018TARIFFS
Strong footprint in the USA and a global setup provides flexibility
Key highlights
1. US projects use US products: supply for
projects in the USA already source nearly
60% of their needs from US factories
+60% U.S. projects source more
than 60% of their BLADES
from U.S. factories 2. World’s largest tower factory is in the
+70% USA. Pueblo sources 100% of their steel
from US companies already
U.S. projects source greater
than 70% of their NACELLES
from U.S. factories
+50% U.S. projects source greater
than 50% of their TOWERS
from U.S. factories
15 Capital Markets Day 2018AGENDA
North American Market
Vestas North America
Summary and Q&A
16 Capital Markets Day 2018SUMMARY
1 USA remains strong market both short and long-term
Vestas remains a market leader in the USA with tailored product
2 line, efficient manufacturing, and productive customer relationships
3 Expanded offerings add value
17 Capital Markets Day 201828.11.2018
Q&A
18 Capital Markets Day 2018THANK YOU FOR YOUR ATTENTION Copyright Notice The documents are created by Vestas Wind Systems A/S and contain copyrighted material, trademarks, and other proprietary information. All rights reserved. No part of the documents may be reproduced or copied in any form or by any means - such as graphic, electronic, or mechanical, including photocopying, taping, or information storage and retrieval systems without the prior written permission of Vestas Wind Systems A/S. The use of these documents by you, or anyone else authorized by you, is prohibited unless specifically permitted by Vestas Wind Systems A/S. You may not alter or remove any trademark, copyright or other notice from the documents. The documents are provided “as is" and Vestas Wind Systems A/S shall not have any responsibility or liability whatsoever for the results of use of the documents by you.
DISCLAIMER AND CAUTIONARY STATEMENT

 This document contains forward-looking statements concerning Vestas’ financial condition, results of operations and business. All statements other
 than statements of historical fact are, or may be deemed to be, forward-looking statements. Forward-looking statements are statements of future
 expectations that are based on management’s current expectations and assumptions and involve known and unknown risks and uncertainties that
 could cause actual results, performance, or events to differ materially from those expressed or implied in these statements.

 Forward-looking statements include, among other things, statements concerning Vestas’ potential exposure to market risks and statements
 expressing management’s expectations, beliefs, estimates, forecasts, projections and assumptions. A number of factors that affect Vestas’ future
 operations and could cause Vestas’ results to differ materially from those expressed in the forward-looking statements included in this document,
 include (without limitation): (a) changes in demand for Vestas’ products; (b) currency and interest rate fluctuations; (c) loss of market share and
 industry competition; (d) environmental and physical risks, including adverse weather conditions; (e) legislative, fiscal, and regulatory developments,
 including changes in tax or accounting policies; (f) economic and financial market conditions in various countries and regions; (g) political risks,
 including the risks of expropriation and renegotiation of the terms of contracts with governmental entities, and delays or advancements in the
 approval of projects; (h) ability to enforce patents; (i) product development risks; (j) cost of commodities; (k) customer credit risks; (l) supply of
 components; and (m) customer created delays affecting product installation, grid connections and other revenue-recognition factors.

 All forward-looking statements contained in this document are expressly qualified by the cautionary statements contained or referenced to in this
 statement. Undue reliance should not be placed on forward-looking statements. Additional factors that may affect future results are contained in
 Vestas’ annual report for the year ended 31 December 2017 (available at www.vestas.com/investor) and these factors also should be considered.
 Each forward-looking statement speaks only as of the date of this document. Vestas does not undertake any obligation to publicly update or revise
 any forward-looking statement as a result of new information or future events other than as required by Danish law. In light of these risks, results
 could differ materially from those stated, implied or inferred from the forward-looking statements contained in this document.

20   Capital Markets Day 2018
You can also read