Business and Racial Justice in America - Special Report: Global Report - Edelman
←
→
Page content transcription
If your browser does not render page correctly, please read the page content below
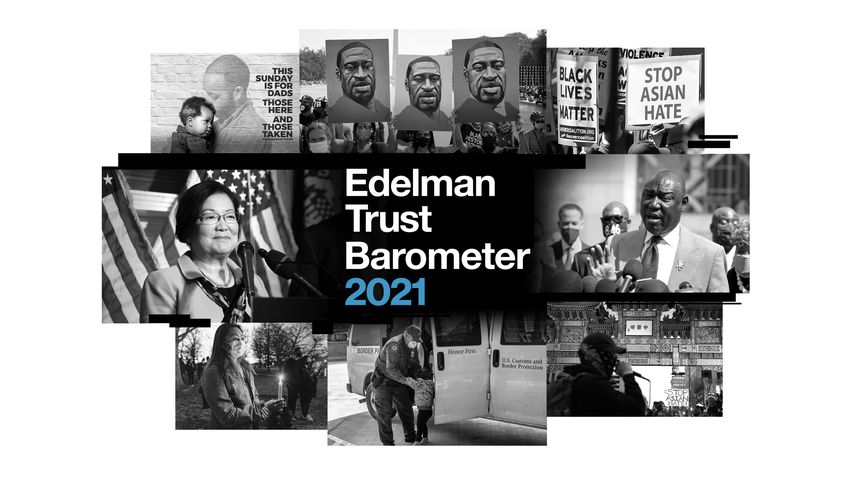
Special Report:
Global Report
                Business and
                Racial Justice
                in America
2021 Edelman Trust Barometer                                             U.S. Online Survey
Special Report
                                                                           •     2,000 general population respondents

Business and Racial                                                        •     All data is nationally representative based on age, region, gender, ethnicity

Justice in America
                                                                           •     Racial and ethnic segments
                                                                                 White                          n=1,159
                                                                                 Black                            n=500
Fieldwork: April 19 – April 26, 2021
                                                                                 Latinx                           n=500
                                                                                 Asian*                           n=500
                                                                           •     All racial and ethnic segments are nationally representative based on age, region and gender

                                                                         Demographic Composition

                                                                         Northeast           19%               Male                49%               Republican         28%
                                                                         Midwest             23%               Female              51%               Democrat           44%
*Asian includes Native Hawaiian and Pacific Islanders
                                                                         South               36%                                                     Ind./Third-party   23%
                                                                         West                22%               18-34               30%
   Margin of error:
                                                                                                               35-54               33%
   •   U.S. total margin of error: +/- 2.2% (n=2,000)
   •   Ethnicity-specific data margin of error: Non-Hispanic White +/-                                         55+                 37%
       2.9% (n=1,159); Black, Latinx, and Asian +/- 4.4% (n=500)
                                                                                                                                                                                2
RACIAL JUSTICE
IN AMERICA
Key findings from
2020 Business Employers Media
only institution
Edelman Trust seen as failing seen as
trusted with racism
Barometer Special to act fueling racism
response
Reports
Brands and Workplace Brands and
corporations racism corporations
2020 Reports both expected to harms the that take a stand
take a stand employer- far more likely to
Brands and Racial Justice in America
fielded June 5 – June 7, 2020 employee gain trust
Higher expectation for
relationship than lose it
brands
The Fight for Racial Justice in America
fielded August 14 – August 21, 2020; August
28 – August 31, 2020
3A LACK OF SYSTEMIC CHANGE
ONLY 1 IN 3 SEE AMERICA MAKING PROGRESS ON
RACIAL JUSTICE OVER THE LAST YEAR
Percent who say

                                                                                                                          32
How much progress do you feel the country has made over the                                                                U.S. general
past year in addressing systemic racism and racial injustice?                                                              population

27% A very small amount of progress                                               A lot
10% No progress at all                                                           9%
                                                                                           Some
18%

 8%
       Things have actually
       gotten worse
       Not a problem in our country
                                                                                            23%                                                                       %
 7%    Don’t know
                                                                                                                              Some or a lot                   White          34

                                                                                                                              of progress                     Black          28
                                                                                                                                                              Latinx         31
                                                                                                                                                              Asian          32

2021 Edelman Trust Barometer Special Report: Business and Racial Justice in America. Q13A. How much progress do you feel the country has made over the past year in addressing systemic
racism and racial injustice? General population, U.S., and among Non-Hispanic White, Black, Latinx and Asian populations. “Some or a lot of progress” is a net of codes 4 and 5.          5
A NATION DIVIDED: The biggest challenge in solving the The biggest challenge in solving the
RACIST
problem of racial injustice in this problem of racial injustice is
OR
country is changing a changing the attitudes of
INDIVIDUALS system that is racist people who are racist
44% 56%
OR A U.S. general
RACIST SYSTEM? population
Which do you agree with more?
White 40
Black 58
Latinx 47
Asian 45
Age 18-34 51
Age 35-54 45
2021 Edelman Trust Barometer Special Report: Business and
Age 55+ 37
Racial Justice in America. IDEAL. You are about to see a series of
two choices. Please choose the one that you agree with more.
General population, U.S., by age, and among Non-Hispanic White, 50%
Black, Latinx and Asian populations. 6MEDIA FAILS TO REPORT
ROOT CAUSES
Percent who agree
Communities
54 53 58
50
The mediais failing to adequately examine
and report on the root causes of racism
in this country
White Black Latinx Asian
51
Age Political Affiliation
%
57 53 50 57
44 46
U.S. general population 18-34 35-54 55+ Rep Dem Ind/3rd
2021 Edelman Trust Barometer Special Report: Business and Racial Justice in America. MED_AGR_RACE. Below is a list of statements. For each one, please rate how much you agree or
disagree with that statement using a nine-point scale where one means “strongly disagree” and nine means “strongly agree”. 9-point scale; top 4 box, agree. General population, U.S., by age and
political affiliation, and among Non-Hispanic White, Black, Latinx and Asian populations. 7MORE THAN 1 IN 4 DON’T TRUST
ANY INFORMATION SOURCE ON RACIAL JUSTICE - 0 +
Change, Aug 2020 to Apr 2021
Percent who say each information source is the best place to get the truth Most trusted source
within each community
about racism and companies’ racism response
White Black Latinx Asian
No trustworthy information sources -3 27 32 14 17 21
Advocacy/activist organizations -1 23 20 33 26 26
Major mainstream news organizations -2 20 19 25 21 22
Friends and family 0 19 18 29 23 27
Social media +1 16 14 26 21 26
Media produced by and for
my ethnic or racial community 0 14 12 25 17 19
Official government sources 0 14 14 17 16 19
2021 Edelman Trust Barometer Special Report: Business and Racial Justice in America. Q28. Which of the following information sources are the best places to go to get the truth about racism
and racial injustice in this country, and how companies and institutions are responding to calls for change? Pick all that apply. General population, U.S., and among Non-Hispanic White, Black, Latinx
and Asian populations. “Advocacy/Activist organizations” is an average of attributes 9 and 10. 8BUSINESS FALLS SHORT ON
CONCRETE ACTION AND SYSTEMIC CHANGE
Percent who agree
With few exceptions, the business community Brands and companies that issue a statement in
has done very little in the way of concrete support of racial equality need to follow it up with
actions to address systemic racism in our country concrete action to avoid being seen by me as
exploitative or as opportunists
46 53
U.S. - 0 + U.S.
Change, Aug 2020 to Apr 2021
+2
% % 63
57 55 57 57
53 51
41
0 +4 +8 +6
White Black Latinx Asian White Black Latinx Asian
2021 Edelman Trust Barometer Special Report: Business and Racial Justice in America. Q23. Please indicate how much you agree or disagree with the following statements. 9-point scale; top 4
box, agree. General population, U.S., and among Non-Hispanic White, Black, Latinx and Asian populations. 9MY EMPLOYER ONLY INSTITUTION
TRUSTED WITH RACISM RESPONSE
Percent who trust each institution to do what is right when it comes to racism - 0 +
Distrust Neutral Trust Change, Aug 2020 to Apr 2021
(1-49) (50-59) (60-100)
73
53 50 50
46
Government sees
+2 -3 0 Business fails to -1 +10 largest gains, but
gain trust
still distrusted
Your employer NGOs Business Media Government
% +/-
White 77 +4 54 -2 52 +3 50 -1 47 +12
Black 68 +9 50 +1 48 +3 52 +4 44 +10
Latinx 71 +3 57 +7 50 +3 52 +10 47 +11
Asian 74 +3 59 +1 51 -2 47 -3 46 +6
Republican 74 -9 51 -9 55 -10 42 -11 47 -9
Democrat 75 +2 59 +1 54 +3 60 +3 54 +16
Ind/3rd 67 +4 44 -12 39 -4 36 -10 31 +4
2021 Edelman Trust Barometer Special Report: Business and Racial Justice in America. Q7A. For each of the institutions and groups of people listed below, please indicate how much you trust them to do what is
right when it comes to responding to the problem of systemic racism and racial injustice in this country. 9-point scale; top 4 box, trust. Question asked among those who believe systemic racism and racial injustice
exists (Q7/1). General population, U.S., by political affiliation, and among Non-Hispanic White, Black, Latinx and Asian populations. “Your employer” only asked to those who are an employee (Q43/1). 10A RECKONING FOR BUSINESS
BRANDS AND CORPORATIONS THAT TAKE A STAND
FAR MORE LIKELY TO GAIN TRUST THAN LOSE IT
Percent who say actions taken by brands/corporations in response to
racial injustice would result in trust gain or trust loss
  Brands/corporations                           Brands/corporations
  would earn/keep my trust                      would lose my trust

                Difference,
      3x        opportunity to        3x            4.5x              3x              7x                               3x            3.5x            3.5x                               2x                5x         3.5x
                gain trust vs
                risk of trust loss               93                                                               91                                                                               92
                                                                                 90
                                                                 86
 81                                                                                                                               80                                                                                79
                                 78
                                                                                                                                                  75
                                                                                                                                                                                   68

                                                                                                                                                                                             37
                                                                           28                                               30
           25                              27
                                                                                                                                          23               23                                                  19           24
                                                         21
                                                                                           13

   U.S.                              White        Black           Latinx           Asian                             Age             Age             Age                              Rep             Dem           Ind/3rd
                                                                                                                    18-34           35-54            55+
 2021 Edelman Trust Barometer Special Report: Business and Racial Justice in America. Q29/Q20. In general, how important is it to earning or keeping your trust that [brands – the specific
 products and services people buy and use / corporations -- organizations or companies that engage in industrial and commercial activities, including producing and selling products and services] -
 do each of the following in response to systemic racism and racial injustice in this country? 6-point scale; top 3 box, important; code 1, doing this would lose my trust. Each question asked of half                          12
 of the sample. General population, U.S., by age and political affiliation, and among Non-Hispanic White, Black, Latinx and Asian populations. Data shown is a net of attributes 2-13.
HIGHER STAKES FOR TRUST:
REACTION TO RACISM RESPONSE INTENSIFIES
Percent who say actions taken by brands/corporations in response to
racial injustice would result in trust gain or trust loss
Brands/corporations Brands/corporations - 0 + Change, Aug 2020 to Apr 2021
would earn/keep my trust would lose my trust
93 91 92
90
86
81 80 79
78
75
68
37
28 30
25 27
23 23 19 24
21
13
+4 +7 +5 +8 +4 +9 +6 +9 +12 +2 +5 +15 +8 +7 +2 +1 +4 +4 +3 +12 +3 +4
U.S. White Black Latinx Asian Age Age Age Rep Dem Ind/3rd
18-34 35-54 55+
2021 Edelman Trust Barometer Special Report: Business and Racial Justice in America. Q29/Q20. In general, how important is it to earning or keeping your trust that [brands – the specific
products and services people buy and use / corporations -- organizations or companies that engage in industrial and commercial activities, including producing and selling products and services] -
do each of the following in response to systemic racism and racial injustice in this country? 6-point scale; top 3 box, important; code 1, doing this would lose my trust. Each question asked of half 13
of the sample. General population, U.S., by age and political affiliation, and among Non-Hispanic White, Black, Latinx and Asian populations. Data shown is a net of attributes 2-13.MORE PEOPLE BUY AND BOYCOTT
OVER BRAND RACISM RESPONSE - 0 + Change, Aug 2020 to Apr 2021
Percent who agree
Communities
Within the past year, I have started 54
53
or stopped using a new brand 39 43
because of its response to the
protests against systemic racism and +8 +6 +12 +4
calls for racial justice
White Black Latinx Asian
42
Age Political Affiliation
+7
%
pts 59
51 55
21 36 29
+5 +14 +3 +7 +10 -4
U.S. general population 18-34 35-54 55+ Rep Dem Ind/3rd
2021 Edelman Trust Barometer Special Report: Business and Racial Justice in America. Q23. Please indicate how much you agree or disagree with the following statements. 9-point scale; top 4
box, agree. General population, U.S., by age and political affiliation, and among Non-Hispanic White, Black, Latinx and Asian populations. Data is a net of attributes 2 and 9. 14SIGNS OF PROGRESS, BUT NO SECTOR
SEEN AS DOING WELL ON RACIAL JUSTICE
Percent who say each sector is doing well in addressing racism - 0 +
U.S. general population White Black Latinx Asian Change, Aug 2020 to Apr 2021
Sports n/a 44 44 52 41 51 Lowest performing
sector within each
community
Healthcare n/a 42 44 41 42 41
Food and beverage +6 39 39 45 40 36
Technology n/a 37 35 43 43 43
Personal care +3 36 36 41 38 39
Automotive +7 35 36 36 40 34
Pharmaceutical +8 35 34 35 42 36
Financial services +7 33 31 36 40 33
2021 Edelman Trust Barometer Special Report: Business and Racial Justice in America. Q15. How well are each of the following industry sectors currently doing when it comes to addressing the
problem of systemic racism and racial inequality in their industry? 6-point scale; top 2 box, doing well. Industries shown to half of the sample. General population, U.S., and among Non-Hispanic White,
Black, Latinx, and Asian populations. 15CORPORATIONS OVERTAKE BRANDS
ON RACISM RESPONSE
Percent who say corporations and brands are performing well on each
Change,
2020 brands in the lead 2021 corporations in the lead Aug 2020 to Apr 2021
Corporations 29 42 +13
Get your own
house in order Brands 34 35 +1
28 41 +13
Educate and
influence change 32 35 +2
25 37 +12
Create change
28 32 +4
2021 Edelman Trust Barometer Special Report: Business and Racial Justice in America. Q21. How well do you feel brands are currently doing each of the following in response to systemic
racism and racial injustice in this country? 5-point scale; top 2 box, doing well. Question asked of half of the sample. Q22. How well do you feel corporations are currently doing each of the
following in response to systemic racism and racial injustice in this country? 5-point scale; top 2 box, doing well. Question asked of half of the sample. General population, U.S. “Get your own
house in order” is an average of attributes 5,7-11; “Educate and influence change” is an average of attributes 1-3; “Create change” is an average of attributes 4, 6, and 12. 16FOR EMPLOYERS, HARD WORK AHEAD
DOUBLE-DIGIT GAINS ADDRESSING RACISM AT WORK
Percent who feel their employer is making progress in redressing racism at their workplace

                                                                   U.S.                      White                          Black                        Latinx                         Asian
                                        Change,
                         Aug 2020 to Apr 2021                   +17                            +14                           +12                            +21                            +9

                                                                                                                                                                   83
                                                                       76                             77

                                                                                                                                    65                                                          63
                                                                                             63                                                           62
                                                              59
     Is your organization                                                                                                  53                                                            54

     making progress?

         Some progress

         A lot of progress

                                                            Aug       Apr                  Aug       Apr                  Aug       Apr                 Aug       Apr                  Aug      Apr
                                                            2020      2021                 2020      2021                 2020      2021                2020      2021                 2020     2021

2021 Edelman Trust Barometer Special Report: Business and Racial Justice in America. Q26. Do you feel that the organization you work for is making any progress in redressing these forms of
racism that you are currently seeing? Question asked of employees who have seen some form of racism at work (Q43/1 AND Q24/1-16; 18-20). General population, U.S., and among Non-Hispanic
White, Black, Latinx and Asian populations.                                                                                                                                                            18
PROGRESS ON DIVERSITY;
INCLUSIVE CULTURE NOW OF GREATEST CONCERN
Percent who report seeing each type of racism at their employer
- 0 +
Change, Aug 2020 to Apr 2021
U.S. general population White Black Latinx Asian
Highest concern within
each community
Lack of inclusive +4 37 33 45 42 37
workplace culture
Lack of diversity in its -5 Lack of diversity was
35 30 47 35 49
workforce and leadership #1 concern in 2020
Bias in customer and +10 31 24 38 38 31
community engagement
Bias in employee pay +4 21 18 27 22 22
and benefits
2021 Edelman Trust Barometer Special Report: Business and Racial Justice in America. Q24. Within the organization you work for, what forms of racism, if any, do you currently see? Pick all that apply. Question asked
of those who are employed (Q43/1). General population, U.S., and among Non-Hispanic White, Black, Latinx and Asian populations. “Inclusive workplace culture” is a net of attributes 7,9,12-14; “Diversity” is a net of
attributes 1-4; “Bias in customer engagement” is a net of attributes 5,8,10, and 15; “Bias in employee pay” is a net of attributes 6, and11. 19NEARLY 1 IN 4 LACK TRUSTED SOURCE
OF DEI INFORMATION
Percent who trust each to tell them the truth about racism, diversity, equity and inclusion within their organization
U.S. general population White Black Latinx Asian
Most trusted source
I do not trust anyone in within each community
23 22 26 16 30
the organization
My direct boss/supervisor 28 30 29 26 27
My racially diverse co-workers 27 27 36 24 36 Racially diverse
co-workers most
trusted among
Black and Asian
Head of HR 23 22 18 32 17 employees
The CEO 22 28 14 21 18
Head of DEI 21 21 22 26 19
2021 Edelman Trust Barometer Special Report: Business and Racial Justice in America. VOICES. Which of the following people do you trust to tell you the truth about racism, diversity, equity and inclusion matters
within the organization you work for? Pick all that apply. Question asked of those who are employed (Q43/1). General population, U.S., and among Non-Hispanic White, Black, Latinx and Asian populations. 20MORE THAN HALF SAY WORKPLACE RACISM HAS
DAMAGED THEIR EMPLOYER RELATIONSHIP
- +
Percent of employees who agree 0 Change, Aug 2020 to Apr 2021
Communities
Racism in my workplace has
68
damaged my relationship 64 58
45
with my employer
+9 +1 +12 +13
Top three forms of damage to the employer relationship: White Black Latinx Asian
• Less trust
• Less loyalty
55
• Less advocacy
Age Political Affiliation
+14 72
%
pts 65
53 49 43
28
+19 +13 +6 +9 +17 +3
U.S. general population 18-34 35-54 55+ Rep Dem Ind/3rd
2021 Edelman Trust Barometer Special Report: Business and Racial Justice in America. Q27. How does the presence of these forms of racism affect your relationship with your employer? Pick
all that apply. Question asked of employees who have seen some form of racism at work (Q43/1 AND Q24/1-16; 18-20). General population, U.S., by age and political affiliation, and among Non-
Hispanic White, Black, Latinx and Asian populations. Data shown is rebased to be among all employees. “Advocacy” is a net of attributes 3 and 4; “Loyalty” is a net of attributes 5 and 6. 21THE MORE RACISM IN THE WORKPLACE,
THE MORE DAMAGE TO THE EMPLOYER RELATIONSHIP
Number of different types of racism seen in the workplace, and percent of employees who
say their relationship with their employer has been affected in each way
Number of types of racism seen in the workplace
The more workplace racism,
One Two-to-three Four or more
the more damage to employer-employee relationship
Trust Loyalty Advocacy
55
52
46
39
32
27
24
17
11
2021 Edelman Trust Barometer Special Report: Business and Racial Justice in America. Q27. How does the presence of these forms of racism affect your relationship with your employer?
Pick all that apply. Question asked of employees who have seen some form of racism at work (Q43/1 AND Q24/1-16; 18-20). General population, U.S., by how many forms of racism employees
are seeing in their workplace asked at Q24 (43/1). “Advocacy” is a net of attributes 3 and 4; “Loyalty” is a net of attributes 5 and 6. 224 IN 10 WOULD AVOID EMPLOYERS
THAT FAIL TO TAKE A STAND - + Change, Aug 2020 to Apr 2021
AGAINST RACISM
0
Communities
Percent who agree
51 49 45
I would not work for an organization 38
that fails to speak out publicly at this +2 +1 +6 +1
time to address racism in this country
White Black Latinx Asian
41
Age Political Affiliation
+1
% pt 50
-2
47
+6
28
-2
33
+3
53
-2
31
-3
U.S. general population 18-34 35-54 55+ Rep Dem Ind/3rd
2021 Edelman Trust Barometer Special Report: Business and Racial Justice in America. Q23. Please indicate how much you agree or disagree with the following statements. 9-point scale; top 4
box, agree. General population, U.S., by age and political affiliation, and among Non-Hispanic White, Black, Latinx and Asian populations. 23BUSINESS MUST DRIVE SYSTEMIC CHANGE
8 IN 10 EXPECT CEOS TO ACT;
ZERO TOLERANCE FOR RACISM AT WORK
Percent who believe that CEOs must do each action in response to systemic racism and racial injustice

Percent who expect                                                Top 5 expected actions,
CEOs to do something                                              U.S. general population                                             U.S.          White          Black         Latinx         Asian

                                                                   Institute a policy of zero tolerance
                                                                                                                                        37            35             41             32            47
                                                                   of racism within their organization

                                                                   Getting their own house in order
                                                                                                                                        30            28             39             27            35
                                                                   when it comes to racial equality

                  79                   %
                                                                   Ensure that there is
                                                                   ethnic diversity on the company’s board

                                                                   Foster the career growth and development of
                                                                   Black, Hispanic and Asian American employees
                                                                                                                                        30

                                                                                                                                        29
                                                                                                                                                      26

                                                                                                                                                      26
                                                                                                                                                                     40

                                                                                                                                                                     39
                                                                                                                                                                                    28

                                                                                                                                                                                    27
                                                                                                                                                                                                  40

                                                                                                                                                                                                  35
                                                                                                                                                                                                        Black respondents
                                                                                                                                                                                                        most concerned
                                                                   Consult with Black, Hispanic and Asian                                                                                               about having their
                                                                   American community leaders on what the                               26            23             42             29            34    voices heard and
                                                                   organization should be doing                                                                                                         acted upon

2021 Edelman Trust Barometer Special Report: Business and Racial Justice in America. WCEO_RESP. Which of the following things do you believe that CEOs must do in response to the
systemic racism and racial injustice in this country? Pick all that apply. General population, U.S., and among Non-Hispanic White, Black, Latinx and Asian populations. Data on the left is a net of
attributes 1-12.                                                                                                                                                                                                      25
BROAD SUPPORT FOR CEOS
TO ACT BEYOND THE BUSINESS
Which do you agree with more?
26pt difference
between Republicans
and Democrats
68 66
64
U.S. general CEOs are acting appropriately
56 56 56 54
55
population when they boycott states 51 52
because they believe the
actions of state 40
government leaders/
laws they pass are
% racially discriminatory
VS
CEOs are starting
to overstep
when they boycott states even if
they feel the actions of state government
leaders/laws they pass are racially
discriminatory
2021 Edelman Trust Barometer Special Report: Business and Racial Justice in America. IDEAL. You are about to see a series of two choices. Please choose the one that you agree with
more. General population, U.S., by age and political affiliation, and among Non-Hispanic White, Black, Latinx and Asian populations. 26REPUTATION GAINS FOR
COMPANIES THAT GET THEIR HOUSE IN ORDER
Percent who say that they would view each action by a company as…
Negative Something I expect Exceed expectations
Replacing a racist logo,
jingle, symbol or product name -18 44 21 65
with one that is non-racist
Apologizing for racist
actions it had engaged in -23 38 20 58
decades ago
Paying reparations to ethnic
groups it had discriminated against -28 29 21 50
many year in the past
2021 Edelman Trust Barometer Special Report: Business and Racial Justice in America. EXTRA_CREDIT. For each of the following actions a company could take to address racism, please
indicate whether the action would lead you to see the company as going beyond your expectations when it comes to addressing racism, whether the action is something you would expect every
company to do, or whether the action is something that would negatively impact your opinion of the company. 3-point scale; code 1, exceed expectations; code 2, something I expect; code 3, doing this
will negatively impact my opinion. General population, U.S. “Replacing a racist logo, jingle” is an average of attributes 1 and 2. 27REPUTATION GAINS FOR COMPANIES
THAT ADVOCATE FOR RACIAL JUSTICE
Percent who say that they would view each action by a company as…
Negative Something I expect Exceed expectations
Fund or support organizations that
address racism in the criminal -18 37 24 61
justice system
Create a campaign to
raise awareness regarding -19 38 24 62
systemic racism
Create a campaign that condemns
killings of Black people by police
-21 34 25 59
2021 Edelman Trust Barometer Special Report: Business and Racial Justice in America. EXTRA_CREDIT. For each of the following actions a company could take to address racism, please
indicate whether the action would lead you to see the company as going beyond your expectations when it comes to addressing racism, whether the action is something you would expect every
company to do, or whether the action is something that would negatively impact your opinion of the company. 3-point scale; code 1, exceed expectations; code 2, something I expect; code 3, doing this
will negatively impact my opinion. General population, U.S. 28REPUTATION GAINS FOR COMPANIES
THAT DRIVE SYSTEMIC CHANGE
Percent who say that they would view each action by a company as…
Negative Something I expect Exceed expectations
A health/beauty company working to make
it
illegal to discriminate against people -16 41 23 64
of color based on their hair style
A restaurant creating a program to
increase the number of Black -18 37 24 61
franchise owners
Encourage people to order from
Asian restaurants in response to -19 32 25 57
recent attacks on Asian Americans by
those who blame them for COVID
2021 Edelman Trust Barometer Special Report: Business and Racial Justice in America. EXTRA_CREDIT. For each of the following actions a company could take to address racism, please
indicate whether the action would lead you to see the company as going beyond your expectations when it comes to addressing racism, whether the action is something you would expect every
company to do, or whether the action is something that would negatively impact your opinion of the company. 3-point scale; code 1, exceed expectations; code 2, something I expect; code 3, doing this
will negatively impact my opinion. General population, U.S. 29RACIAL JUSTICE IN AMERICA:
FROM SMALL STEPS TO SYSTEMIC CHANGE
1 2 3 4
The stakes intensify A C-suite imperative Progress on Brands must move
Diversity, falling beyond campaigns
Businesses that don’t take CEOs must work to
action to address racism combat systemic racism
short on Equity and
Consumers expect brands
will lose customers and and promote equity both Inclusion to do more than talk.
employees. Companies within and outside their Brands must demonstrate
While employers have
must commit to a organization. The majority their commitment through
made progress, hiring is
meaningful, long-term of consumers support substantive efforts to
not enough. Systemic
effort to drive systemic CEOs taking on an educate, advocate and
change requires sustained
change. expanded role to lead drive change.
work across the
societal change.
organization’s culture,
operations and business
model.
30You can also read