Implementation of the Revised Fontes and Garnier radiocarbon adjustment model in NetpathXL
←
→
Page content transcription
If your browser does not render page correctly, please read the page content below
Implementation of the Revised Fontes and Garnier radiocarbon adjustment
model in NetpathXL
An analysis of the radiocarbon adjustment model of Fontes and Garnier (1979) (F&G) shows an
inadequate conceptualization in the formulation of the governing equations (Han and Plummer, 2013),
resulting in underestimation of the initial 14C values (14Co) for groundwater systems that have undergone
isotopic exchange. The degree to which 14Co is underestimated by the F&G model increases with the
extent of isotopic exchange. A new model (Han and Plummer, 2013) revises the mass balance method of
F&G by using a modified model conceptualization. The derivation yields a “global” model both for
carbon isotopic exchange dominated by gaseous CO2 in the unsaturated zone, and for carbon isotopic
exchange dominated by solid carbonate mineral in the saturated zone. The revised model requires
different parameters for exchange dominated by gaseous CO2 as opposed to exchange dominated by
solid carbonate minerals. The Revised F&G model has been implemented in NetpathXL (Parkhurst and
Charlton, 2008) which is based on NETPATH (Plummer and others, 1994). In the unsaturated zone, with
exchange dominated by gaseous CO2, the revised model generates results similar to the model of Mook
(Mook, 1976). In the saturated zone, with exchange dominated by solid carbonate minerals, the revised
model produces results similar to that of Eichinger (1983). For groundwater systems where exchange
occurs both in the unsaturated zone and saturated zone, the revised model can still be used; however,
14
Co will be slightly underestimated (Han and Plummer, 2013). Finally, in carbonate systems undergoing
complex geochemical reactions, such as oxidation of organic carbon, adjusted radiocarbon ages are best
estimated by inverse geochemical modeling techniques (Plummer and others, 1994; Parkhurst and
Charlton, 2008).
There are two ways to apply the Revised F&G model in NetpathXL: (a) radiocarbon dating of DIC in a
single water sample, in which the initial and final water are defined as the same sample (“traditional”
approach to radiocarbon dating without consideration of the geochemical mass balance reactions), and
(b) radiocarbon dating of the final water when initial and final water samples are defined separately. In
case (b) the Revised F&G model is applied to estimate the pre-bomb 14C content in the initial water and
NetpathXL is then used to compute the carbon mass transfer to the final water sample, and
subsequently to calculate the initial 14C content of the final water adjusted for geochemical reactions
(without radioactive decay).
Example
This example assumes the user has familiarity with radiocarbon dating of DIC in the NETPATH and
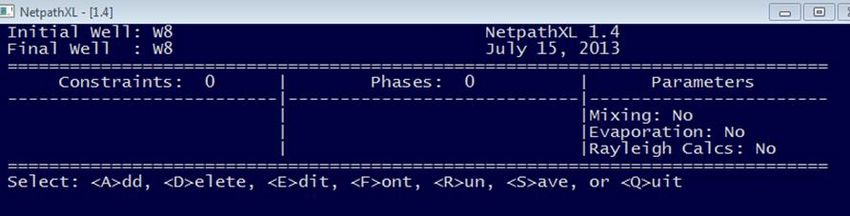
NetpathXL environments. We begin by selecting initial and final water samples from the well file. In the
example below, the initial and final waters are defined to be the same [case (a) above]. There is no need
to select phases or constraints in this case since the initial and final waters are the same. Having created
a model [for either case (a) or case (b)] in NetpathXL, enter “E” to select dit from the main screen.
1From the dit menu, select option (10), “Rayleigh calculations”.
The prompt “Do Rayleigh calculations?” appears and answer “y”es. This expands the dit menu to
include options 11) Isotopic data, 12) Model for initial C14 (with “Original Data” as default), and 13)
Carbon fractionation factors (default values from Mook). Select 12) “Model for initial C14”.
From the next screen, “Initial Carbon-14, A0, (percent modern) for Total Dissolved Carbon”, select either
Model 10 or 11. If the sample to be dated is in the recharge zone, where open- (to CO2 gas) system
conditions prevail, select Model 10 for CO2 gas isotopic exchange. If the sample is from the saturated
zone and isolated from the soil zone, select Model 11, for solid carbonate (calcite) isotopic exchange.
Although NETPATH and NetpathXL treat the total dissolved carbon system, TDC, (TDC≡DIC+DOC+CH4) for
other radiocarbon adjustment models, implementation of the Revised F&G model in NetpathXL treats
only the inorganic carbon system, which is the most common application expected.
2Typing the letter “A” permits editing all the isotopic values used in all the radiocarbon adjustment
models programmed in NetpathXL. Here is the screen after selecting Model 11, “Revised F&G solid ex”
and defining the δ13C of calcite and CO2 gas to be 2.0 and -19.6 permil (see below).
From this screen, one can type “X”, which generates a Microsoft Excel® spreadsheet that permits
examination of all the samples from the originally selected well file (.xls or .xlsx).
Typing to construct the Excel® plot for the Revised F&G model
In the example above, for well W8, the Revised F&G model for CO2 gas isotopic exchange leads to a
negative age as does that of Mook. Model 11, for solid calcite isotopic exchange leads to a positive
radiocarbon age. As the sample is from a well in the saturated zone, an initial guess would be to select
Model 11, “Revised F&G solid exchange”. The following Excel® spreadsheet is generated by NetpathXL.
In this example, the δ13C of calcite and CO2 gas are defined to be 2.0 and -19.6 permil. The
corresponding 14C values are defined to be 0.0 and 100.0 pmc.
3Revised Fontes and Garnier (Han and Plummer, 2013)* Input shaded blue Output shaded yellow Calculated Values
Well name 13C, permil 14C, pmc H2CO3 HCO3 CO3 TempC Frxn fact Relative to: TDIC
Shumanzay pine W8 -8.92 31.9 0.19 4.06 0.02 14.60 1 1--HCO3; 0--TDIC speciation 4.27
Default 1--consistent with published A0 models C13, permil C14, pmc
Tamers point -8.80 50.0
Han and Plummer Plot C13, permil C14, pmc TempK 287.75
Carbonate solid 2.00 0.0
100.0 UZ gas -19.60 100.0 Tamers X -8.80 0.0
Uncertainty 2.00 5.0 -8.80 105.0
90.0 Tamers Y -30.00 50.0
Model # A0 model A0, pmc Age, yr 10.00 50.0
80.0 Tamers X 4 Tamers 52.3 4081 Tamers area -6.80 0.0
10 Revised F&G, Gas exchange 12.3 -7862 -6.80 55.0
Tamers Y
70.0 11 Revised F&G, Solid exchange 47.8 3343 -10.80 55.0
Tamers area -10.80 0.0
Carbon-14, pmc
Zero-age (gas ex)
60.0
Zero-age (solid ex) * See Explanation Tab Mook Alpha Epsilon
50.0 UZ gas
CO2(aq)-HCO3 0.98983 -10.2
CO3-HCO3 0.99951 -0.5
CO2(aq) eq w UZ gas
40.0 Calcite-HCO3 1.00039 0.4
HCO3 eq w UZ gas CO2(g)-HCO3 0.99093 -9.1
30.0
All data CO2(aq)-CO2(g) 0.99889 -1.1
Measured CO2(g)-solution 0.99139 -8.6
20.0 Solid
Calcite-solution 1.00085 0.9
HCO3 eq w solid
10.0 C13, permil C14, pmc
Zero-age (solid ex) 1.61 0.0
0.0 -8.80 50.0
-30.00 -20.00 -10.00 0.00 10.00
Carbon-13, permil Zero-age (gas ex) -8.80 50.0
-10.53 101.8
Well name 13C, permil 14C, pmc H2CO3 HCO3 CO3 TempC CO2(aq) eq w UZ gas -20.71 99.8
S1 -10.42 86.8 0.23 4.90 0.03 14.80
W6 -10.20 83.7 0.32 4.95 0.02 10.80 HCO3 eq w UZ gas -10.53 101.8
S2 -10.23 83.6 0.38 4.80 0.02 11.00
W8 -8.92 31.9 0.19 4.06 0.02 14.60 HCO3 eq w solid 1.61 0.0
W5 -10.35 86.8 0.34 4.52 0.02 12.70
W3 -9.85 56.4 0.14 3.73 0.02 14.30
W7 -9.84 39.7 0.12 3.22 0.02 14.30
W4 -9.84 91.7 0.15 3.83 0.02 13.90
K1 -9.26 75.7 0.09 3.65 0.03 12.50
W2 -9.07 73.6 0.24 4.14 0.02 15.50
S3 -9.76 80.9 0.22 4.38 0.02 11.30
S4 -10.04 83.4 0.28 4.50 0.02 12.20
W1 -10.69 94.8 0.21 4.43 0.02 14.30
All samples from the selected well file are plotted as 14C (pmc) on the ordinate and δ13C (permil) on the
abscissa. The larger red triangle represents the selected sample to be dated (W8). The rest of the
samples from the well file are plotted as smaller green squares.
Features of the spreadsheet
1. Once generated, the spreadsheet stands alone, can be saved, used in future calculations, and must
be closed manually, external to NetpathXL.
2. The table in the lower left part of the spreadsheet contains the δ13C and 14C data for all the samples
in the well file [obtained from the NetpathXL Excel® file (.xls or .xlsx) that has been generated by
using DBXL or copied from another Excel® well file, see Parkhurst and Charlton, 2008], along with
their inorganic carbon speciation computed from the WATEQ aqueous model of NetpathXL.
3. The example shows results for well W8 (data in the blue-shaded cells in line 3). To change to
another sample, copy and paste a line from the sample table in the lower left part of the
spreadsheet to the blue-shaded columns of line 3. Note that changes made in the Revised F&G
spreadsheet have no effect on the NetpathXL model definitions.
4. Column 10, line 3 is a switch used to define “additive” fractionation factors, , for CO2(g) and calcite
as, “1”, relative to the isotopic composition of HCO3-(default), and “0”, relative to the average
isotopic composition of the DIC in the sample, the latter accounting for sample pH and distribution
of species. In most cases the results will be similar, because HCO3- usually is the predominant
inorganic carbon species in groundwater. Switching to option “0” might be more appropriate for
samples from systems with high or low pH where CO32- or CO2(aq) are relatively more important; for
example, in a closed-system quartz-sand aquifer that contains minor calcite where the pH is still low,
such that CO2(aq) predominates. Here calcite-solution might be more appropriate than calcite-
HCO3-. (See Wigley et al., 1978).
45. Cells L7–M9 contain user-defined values of δ13C (permil) and 14C pmc for the carbonate solid (usually
calcite), the unsaturated zone CO2 gas, and an estimate of the combined uncertainty in the
unsaturated zone gas isotopic composition and the solid carbonate minerals isotopic composition.
6. The yellow shaded fields of the spreadsheet are calculated within the spreadsheet. Fractionation
factors are calculated at the sample temperature. Concentrations of inorganic carbon species are in
mmol per kg of water.
Features of the plot
The plot shown in the spreadsheet is constructed for purposes of visualizing all the sample data in
relation to the sample to which the radiocarbon adjustment model is applied. The locations of key
features of the plot, such as the Tamers Point, depend on initial soil-zone PCO2, and δ13C, and 14C isotopic
composition of calcite and soil gas CO2. Because individual samples can evolve from different initial
chemical and isotopic conditions in the soil zone, the location of the Tamers Point can vary between
samples. The plot assumes that the initial soil-zone PCO2 was in the range such that HCO3- is the
predominant inorganic carbon species in calcite-saturated groundwater (e.g., 10-1.8 to 10-2.2 atm).
1. The Tamers Point is the approximate isotopic composition of a sample that has reached calcite
saturation in a closed system (Tamers, 1967; Tamers, 1975; Tamers and Scharpenseel, 1970). It is
located at the crossing of the Tamers lines X and Y. In the spreadsheet, the Tamers Point is
computed in cells Q5 and R5 from defined values of δ13C and 14C of calcite and soil gas CO2 (cells L7-
M8). The Tamers X and Tamers Y lines are vertical and horizontal extensions of the Tamers Point.
See Han and others (2012) for further examples in locating the Tamers Point.
2. Considering uncertainty in δ13C and 14C, the Tamers area is the approximate region in δ13C - 14C
space where the Tamers model applies, which is shown as the blue rectangle on the plot. The
Tamers area is computed around the Tamers Point by using the assigned uncertainty in isotopic
composition of soil gas CO2 and calcite (cells L9 and M9). The Tamers area extends to 0 pmc for
samples that have undergone radioactive decay, but have not been affected by extensive isotopic
exchange with solid carbonate minerals.
3. Five reference points are plotted: (1) the defined isotopic composition of soil-gas CO2, (2) the
isotopic composition of CO2 (aq) in equilibrium with soil-gas CO2, (3) the isotopic composition of
HCO3- in equilibrium with soil-gas CO2, (4) the defined isotopic composition of the solid (calcite), and
(5) the isotopic composition of HCO3- in equilibrium with the solid.
4. Zero-age line for systems open to soil gas CO2 (Mook model; Revised F&G model). This line is drawn
from the Tamers Point to the isotopic composition of HCO3- (or TDIC, if Frxn fact is 0) in equilibrium
with soil gas CO2. Points plotting along the line represent increasing exposure of a sample at the
Tamers point to soil gas CO2. Samples have zero age along this line representing a positive
correction in 14C to the Tamers Point and are consistent with Mook’s model (Mook, 1976). As the
isotopic composition of soil gas CO2 often is not measured, some guesswork is involved in
establishing this line, choosing, by trial and error, values of the isotopic composition of soil-gas CO2
(and calcite, L7–M8) that result in the calculated zero-age line passing through the trend in sample
points (if such a trend exists). Many data sets may not have samples plotting along this zero-age
line. Samples plotting below the zero-age (gas ex) line have radiocarbon age. The zero-age (gas ex)
line is computed in cells Q30–R31.
5. Zero-age line for systems closed to soil gas CO2 (Revised F&G model (solid ex), similar to
Eichinger,1983). The plot shows the zero-age line (with solid exchange ) drawn from the Tamers
point (cells Q5, R5) to the isotopic composition of HCO3- that is in isotopic equilibrium with calcite in
a closed system (cells Q27, R28). For reference, Pearson’s model, representing samples undergoing
simple binary mixing processes under closed-system conditions (Ingerson and Pearson, 1964) plots
5along a line (not shown) between the Tamers Point and the isotopic composition of the solid
(calcite). The zero-age line with solid exchange can be calculated from the Revised F&G equation
(Eqn. 1) (Han and Plummer, 2013):
Ca 13 C
13C Ca 0 b 13Cb 0
Ca 14 C CT CT
C0 (
14
Ca 0 b 14Cb 0 ) (14C x 14Cb 0 0.2 x / b ) (1)
CT CT C x Cb 0 x / b
13 13
(See Han and Plummer, 2013 for definition of terms, and Han and others, 2012 for examples using
this diagram).
6. Samples plotting along the zero-age line (solid ex) have zero radiocarbon age, even though their 14C
content decreases with increasing values of δ13C. Samples plotting below the zero-age line (solid ex)
have radiocarbon age.
7. For the selected sample, W8, A0 and the radiocarbon ages from the Tamers, Revised F&G (gas
exchange), and Revised F&G (solid exchange) models are computed in cells L12-M14. For another
sample, copy the values in the lower left table into the blue cells, C3–H3.
8. Changing values in any of the blue cells will cause the chart and all of the calculated values (yellow
cells) to be updated.
References cited
Eichinger, L., 1983, A contribution to the interpretation of 14C groundwater ages considering the
example of a partially confined sandstone aquifer: Radiocarbon, v. 25, p. 347–356.
Fontes, J.-Ch., and Garnier, J.-M., 1979, Determination of the initial 14C activity of the total dissolved
carbon--A review of the existing models and a new approach: Water Resources Research, v. 15, p.
399–413.
Han, Liang-Feng, and Plummer, L. Niel, 2013, Revision of Fontes & Garnier’s model for the initial 14C
content of dissolved inorganic carbon used in groundwater dating: Chemical Geology, v. 351, p.
105–114.
Han, L.-F., Plummer, L.N., and Aggarwal, P., 2012, A graphical method to evaluate predominant
geochemical processes occurring in groundwater systems for radiocarbon dating: Chemical
Geology 318-319, p. 88–112.
Ingerson, E., and Pearson, F.J., Jr., 1964, Estimation of age and rate of motion of ground water by the 14C
method, In Recent Researches in the fields of Hydrosphere, Atmosphere and Nuclear Chemistry,
1964: p. 263–283.
Mook, W.G., 1976, The dissolution-exchange model for dating groundwater with 14C, In Interpretation of
Environmental Isotope and Hydrochemical Data in Groundwater Hydrology: International Atomic
Energy Agency, Vienna, p. 213–225.
Parkhurst, D.L., and Charlton, S.R., 2008, NetpathXL—An Excel® interface to the program NETPATH: U.S.
Geological Survey Techniques and Methods 6- A-26, 11 p.
Plummer, L.N., and Glynn, P.D., 2013, Radiocarbon Dating in Groundwater Systems, In IAEA, 2013,
Isotope Methods for Dating Old Groundwater, International Atomic Energy Agency, Vienna, April,
2013: Chap. 4, p. 33–89. STI/PUB/1587, ISBN 978–92–0–137210–9, 357p. http://www-
pub.iaea.org/books/IAEABooks/8880/Isotope-Methods-for-Dating-Old-Groundwater.
Plummer, L.N., Prestemon, E.C., and Parkhurst, D.L., 1994, An interactive code (NETPATH) for modeling
NET geochemical reactions along a flow PATH—Version 2.0: U.S. Geological Survey Water-
Resources Investigations Report 94-4169, 130 p.
6Tamers, M.A. 1967, Surface-water infiltration and groundwater movement in arid zones of Venezuela, In
Isotopes in Hydrology: International Atomic Energy Agency, Vienna, p. 339–351.
Tamers, M.A., 1975, Validity of radiocarbon dates on groundwater: Geophysical Surveys, v. 2, p. 217–
239.
Tamers, M.A., and Scharpenseel, H.W., 1970, Sequential sampling of radiocarbon in groundwater, In
Isotope Hydrology 1970: International Atomic Energy Agency, Vienna, p. 241–256.
Wigley, T.M.L., Plummer, L.N., and Pearson, F.J., Jr., 1978, Mass transfer and carbon isotope evolution in
natural water systems: Geochimica et Cosmochimica Acta, v. 42, p. 1117–1139.
7You can also read