ORCHIMIC (v1.0), a microbe-mediated model for soil organic matter decomposition - GMD
←
→
Page content transcription
If your browser does not render page correctly, please read the page content below
Geosci. Model Dev., 11, 2111–2138, 2018
https://doi.org/10.5194/gmd-11-2111-2018
© Author(s) 2018. This work is distributed under
the Creative Commons Attribution 4.0 License.

ORCHIMIC (v1.0), a microbe-mediated model for soil organic
matter decomposition
Ye Huang1 , Bertrand Guenet1 , Philippe Ciais1 , Ivan A. Janssens2 , Jennifer L. Soong2,3 , Yilong Wang1 , Daniel Goll1 ,
Evgenia Blagodatskaya4,5 , and Yuanyuan Huang1
1 Laboratoire   des Sciences du Climat et de l’Environnement, LSCE/IPSL, CEA-CNRS-UVSQ, Université Paris-Saclay,
91191 Gif-sur-Yvette, France
2 University of Antwerp, Department of Biology, 2610 Wilrijk, Belgium
3 Lawrence Berkeley National Laboratory, Berkeley, CA 94720, USA
4 Department of Agricultural Soil Science, University of Göttingen, Büsgenweg 2, 37077 Göttingen, Germany
5 Institute of Physicochemical and Biological Problems in Soil Science, 142290 Pushchino, Russia

Correspondence: Ye Huang (ye.huang@lsce.ipsl.fr)

Received: 23 December 2017 – Discussion started: 13 February 2018
Revised: 7 May 2018 – Accepted: 17 May 2018 – Published: 8 June 2018

Abstract. The role of soil microorganisms in regulating soil        temporal dynamics of microbial biomass. We then applied
organic matter (SOM) decomposition is of primary impor-             different idealized changes to the model input data, i.e., a 5 K
tance in the carbon cycle, in particular in the context of global   stepwise increase of temperature and/or a doubling of plant
change. Modeling soil microbial community dynamics to               litter inputs. Under 5 K warming conditions, ORCHIMIC
simulate its impact on soil gaseous carbon (C) emissions and        predicted a 0.002 K−1 decrease in the C use efficiency (de-
nitrogen (N) mineralization at large spatial scales is a recent     fined as the ratio of C allocated to microbial growth to the
research field with the potential to improve predictions of         sum of C allocated to growth and respiration) and a 3 % loss
SOM responses to global climate change. In this study we            of SOC. Under the double litter input scenario, ORCHIMIC
present a SOM model called ORCHIMIC, which utilizes in-             predicted a doubling of microbial biomass, while SOC stock
put data that are consistent with those of global vegetation        increased by less than 1 % due to the priming effect. This lim-
models. ORCHIMIC simulates the decomposition of SOM                 ited increase in SOC stock contrasted with the proportional
by explicitly accounting for enzyme production and distin-          increase in SOC stock as modeled by the conventional SOC
guishing three different microbial functional groups: fresh         decomposition model (CENTURY), which can not repro-
organic matter (FOM) specialists, SOM specialists, and gen-         duce the priming effect. If temperature increased by 5 K and
eralists, while also implicitly accounting for microbes that        litter input was doubled, ORCHIMIC predicted almost the
do not produce extracellular enzymes, i.e., cheaters. OR-           same loss of SOC as when only temperature was increased.
CHIMIC and two other organic matter decomposition mod-              These tests suggest that the responses of SOC stock to warm-
els, CENTURY (based on first-order kinetics and representa-         ing and increasing input may differ considerably from those
tive of the structure of most current global soil carbon mod-       simulated by conventional SOC decomposition models when
els) and PRIM (with FOM accelerating the decomposition              microbial dynamics are included. The next step is to incorpo-
rate of SOM), were calibrated to reproduce the observed res-        rate the ORCHIMIC model into a global vegetation model to
piration fluxes of FOM and SOM from the incubation experi-          perform simulations for representative sites and future sce-
ments of Blagodatskaya et al. (2014). Among the three mod-          narios.
els, ORCHIMIC was the only one that effectively captured
both the temporal dynamics of the respiratory fluxes and the
magnitude of the priming effect observed during the incuba-
tion experiment. ORCHIMIC also effectively reproduced the

Published by Copernicus Publications on behalf of the European Geosciences Union.
2112               Y. Huang et al.: ORCHIMIC (v1.0), a microbe-mediated model for soil organic matter decomposition

1   Introduction                                                     ics on SOC decomposition, but not always with an explicit
                                                                     representation of microbial processes (Schimel and Wein-
Soils contain the largest stock of organic carbon (C) in             traub, 2003; Moorhead and Sinsabaugh, 2006; Lawrence et
terrestrial ecosystems (MEA, 2005), ranging from 1220 to             al., 2009; Wang et al., 2013; Wieder et al., 2014; Kaiser et
2456 Pg C (Batjes, 2014; Jobbágy and Jackson, 2000). Rela-           al., 2014, 2015; He et al., 2015). In those models, SOC de-
tively small changes (< 1 %) in this global soil organic car-        composition is mediated by soil enzymes released by mi-
bon (SOC) pool are, therefore, of a similar order of mag-            croorganisms (Allison et al., 2010; Schimel and Weintraub,
nitude as anthropogenic CO2 emissions. Warming-induced               2003; Lawrence et al., 2009). Although different groups of
SOC losses may consequently represent a large feedback to            microorganisms can produce different enzymes, with large
climate change (Jenkinson et al., 1991). Thus, a realistic rep-      redundancy (Nannipieri et al., 2003), the production of en-
resentation of SOC dynamics in Earth system models is nec-           zymes in models is typically modeled as a fixed fraction
essary to ensure accurate climate projections, and reduce the        of total microbial biomass (Allison et al., 2010; He et al.,
uncertainty of SOC stock responses to global climate change;         2015) or as a fixed fraction of the uptake of C or N (Schimel
therefore this has been put forward as a research priority           and Weintraub, 2003; Kaiser et al., 2014, 2015). However,
(Arora et al., 2013; Friedlingstein, 2015).                          negative priming effects, i.e., reduced SOC decomposition
   In most Earth system models, the decomposition of soil            in response to FOM addition, as occasionally observed in
organic matter (SOM) is represented by first-order kinetics          soil incubation experiments (Guenet et al., 2012; Hamer and
(Todd-Brown et al., 2013). The role of microbes during de-           Marschner, 2005; Tian et al., 2016), suggest that the prefer-
composition is not explicitly represented in these models,           ential production of enzymes decomposing FOM or an in-
rather, the decomposition flux, modified by environmental            hibited production of enzymes decomposing SOC is possi-
factors, is dependent on the size of the substrate pool. How-        ble. Moreover, it has been reported that enzyme activity can
ever, these global models fail to accurately reproduce the ob-       be stimulated by substrate addition and be suppressed by nu-
served global spatial distribution of SOC (Todd-Brown et al.,        trient addition (Allison and Vitousek, 2005). These observa-
2013) even when adjusting parameters (Hararuk et al., 2014),         tions suggest that the production of enzymes is modulated
suggesting structural problems in their formulations. One of         by substrate availability and quality, and not just by micro-
the underlying reasons might be that microbial community             bial uptake or microbial biomass.
structure and activity are not explicitly represented (Creamer          Logically, SOC models ignoring microbial dynamics also
et al., 2015).                                                       do not distinguish between active and dormant microbial
   Typical SOC models rapidly distinguish decomposing                biomass, thereby neglecting the different physiology of mi-
from slowly decomposing plant litter and SOC pools. With             crobes during these two states (Wang et al., 2014). For in-
first-order kinetics, the decomposition rate of each pool is in-     stance, only active microbes are involved in decomposing
dependent from the other pools, as decomposition rates are           SOC (Blagodatskaya and Kuzyakov, 2013) and in producing
decoupled from microbial dynamics. As a result, the prim-            enzymes (He et al., 2015). However, with 80 % of microbial
ing effect, defined as changes in SOC decomposition rates            cells typically being dormant in soils, dormancy is the most
induced by the addition of fresh, energy-rich organic matter         common state of microbial communities (Lennon and Jones,
(FOM) (Blagodatskaya and Kuzyakov, 2008), can not be re-             2011). Reactivation of dormant microbes due to the addition
produced by these SOC models (Guenet et al., 2016). How-             of labile substrates is one of the proposed mechanisms ex-
ever, priming effects have been widely observed in labora-           plaining the priming effect (Blagodatskaya and Kuzyakov,
tory studies, which use different types of soil with differ-         2008). Thus, explicitly representing the active fraction of mi-
ent types of FOM added during soil incubation experiments            crobial biomass, rather than the entire microbial biomass is a
at timescales of less than one day to several hundred days           promising avenue to help improve SOC models.
(Fontaine et al., 2003; Kuzyakov and Bol, 2006; Tian et al.,            In previous models that explicitly simulate microbial dy-
2016), as well as in field experiments (Prévost-Bouré et al.,        namics, enzyme-mediated decomposition rates were mod-
2010; Subke et al., 2004, 2011; Xiao et al., 2015). The influ-       eled using Michaelis–Menten kinetics (Allison et al., 2010),
ence of priming on SOC dynamics on long timescales, from             or reverse Michaelis–Menten kinetics (Schimel and Wein-
years to decades, and at large spatial scales remains uncer-         traub, 2003; Lawrence et al., 2009). Michaelis–Menten ki-
tain. However, these influences can not be neglected in future       netics were also used to model the uptake of C by microbes
SOC stock simulations, considering the projected increase of         (Allison et al., 2010). In comparison to these two formula-
plant litter inputs to soil in response to the fertilizing effects   tions, first-order accurate equilibrium chemistry approxima-
of elevated CO2 , globally increasing nitrogen (N) deposition        tion (ECA) kinetics performed better than Michaelis–Menten
and lengthening growing seasons (Burke et al., 2017; Qian et         kinetics for a single microbe feeding on multiple substrates
al., 2010).                                                          or for multiple microbes competing for multiple substrates
   Soil microbial dynamics are believed to be responsible            (Tang and Riley, 2013). ECA kinetics combine the advan-
for the priming effect (Kuzyakov et al., 2000). Recently,            tages of Michaelis–Menten and reverse Michaelis–Menten
new models have included the effects of microbial dynam-

Geosci. Model Dev., 11, 2111–2138, 2018                                               www.geosci-model-dev.net/11/2111/2018/
Y. Huang et al.: ORCHIMIC (v1.0), a microbe-mediated model for soil organic matter decomposition                           2113

kinetics (Tang, 2015), making this formulation more suitable      and N from plant litter or from other sources and plant uptake
for application in conceptual microbial models.                   of N. In return, the model predicts soil carbon and nitrogen
   Nutrient dynamics are often ignored in SOC models (Al-         pools and respired CO2 fluxes.
lison et al., 2010; Wang et al., 2013, 2014; He et al., 2015;        A total of 11 pools are considered for both C and N
Guenet et al., 2016), in particular in the SOC models used        (Fig. 1). The two FOM pools are metabolic (LM) and struc-
with Earth system models (Anav et al., 2013), despite the         tural (LS) plant litter. The three SOM pools are the active
fact that nutrients can be a rate-limiting for many biological    (SA), slow (SS) and passive (SP) pools with short, medium
processes in ecosystems (Vitousek and Howarth, 1991). By          and long turnover times (Parton et al., 1987). SA consists of
providing rhizosphere microbes with energy-rich, nutrient-        dead microbes and deactivated enzymes with a short turnover
poor exudates, roots may elicit microbial growth, their need      time. SS contains SOM generated during the decomposi-
for nutrients and subsequently their production of SOC-           tion of litter and SOM in the SA pool, which is chemically
decomposing enzymes. Thus nutrient availability, especially       more recalcitrant and/or physically protected with a medium
that of the macroelement nitrogen (N), regulates the priming      turnover time. SP is a pool of SOM generated during the de-
effect of microbes in response to root exudation (Janssens et     composition of SOM in other pools; it is the most resistant
al., 2010). Including N dynamics in SOC models is, there-         to decomposition and has a long turnover time. The major
fore, also a necessity for accurate projections of future SOC     outgoing C and N fluxes from the substrate pools are the de-
stocks.                                                           composition of the FOM pools by EF enzymes and the SOM
   In this study, a microbe-driven SOM decomposition model        pools by ES enzymes. In addition to these major fluxes, there
– ORCHIMIC – is described and tested against incubation           are fluxes from the FOM pools to the SS pool, from SA to
experiment results. In ORCHIMIC, enzyme production is             both the SS and SP pools and from the SS pool to the SP
dynamic and depends on the availability of carbon and ni-         pool; these fluxes implicitly represent physicochemical pro-
trogen in FOM and SOM substrates and on a specific pool of        tection mechanisms, such as the occlusion of substrates in
available C and N. Three microbial function types (MFTs)          macroaggregates (Parton et al., 1987).
– generalists, FOM specialists and SOM specialists – are             The available pools (Avail) represent C and N that are di-
included, along with an explicit representation of their dor-     rectly available to microbes. The Avail pool receives inputs
mancy; however a fraction of these microbes being cheaters        from substrate decomposition, desorption from mineral sur-
do not invest in producing SOC decomposing enzymes them-          faces, microbial mortality and decay. The Avail pool is de-
selves, but profit from the investments of others. ORCHIMIC       pleted by the uptake of C and N by active microbes, ad-
has been developed with the aim of being incorporated in the      sorption on mineral surfaces and leaching losses. The Adsorb
ORCHIDEE land biosphere model (Krinner et al., 2005), al-         pool represents C and N that are unavailable to microbes be-
though its generic input data would allow it to be embedded       cause of adsorption by mineral surfaces.
in any other global land surface model for grid-based simu-          Four MFTs, including SOM specialists, FOM specialists,
lations.                                                          generalists and cheaters, are explicitly or inexplicitly repre-
   The ORCHIMIC model is described in Sect. 2 and the             sented, as described in Sect. 2.1. Each MFT is further divided
two conceptually simpler models – a first-order kinetics          into active (BA) and dormant (BD) biomass. The outgoing C
model called CENTURY, which was derived from Parton et            fluxes from active microbes are growth respiration, mainte-
al. (1987) and constitutes the SOC decomposition module           nance respiration, overflow respiration, dormancy, death and
of the ORCHIDEE model (Krinner et al., 2005); and a first-        enzyme production. During dormancy, death and enzyme
order kinetics model called PRIM, which is a variant of the       production, corresponding amounts of N are also lost from
CENTURY model modified to include interactions between            active microbes. N is furthermore released from active mi-
pools to enable the representation of priming of decompo-         crobes when maintenance respiration is at the cost of their
sition rates (Guenet et al., 2016) – are described in Sect. 3.    own biomass. Dormant microbes can be reactivated (a flux
The model parameters were calibrated against soil incuba-         of C and N from dormant to active microbes) and lose C and
tion data from Blagodatskaya et al. (2014) (Sect. 4). Different   release N during maintenance respiration but at a slower rate
idealized tests of the ORCHIMIC model response including          than active microbes.
doubling FOM input and/or a stepwise increase in tempera-            The two enzyme pools include enzymes that can decom-
ture were performed (Sect. 5).                                    pose either FOM (EF) or SOM (ES). Enzyme pools re-
                                                                  ceive inputs through microbial enzyme production and de-
                                                                  cline through enzyme turnover. The equations corresponding
2   ORCHIMIC description                                          to each process (shown in Fig. 1) are given in Sect. 2.2, and
                                                                  for fluxes between pools in Sect. 2.3.
The ORCHIMIC model is zero-dimensional and considers
biology and soil physics homogenous within the soil grid to
which it is applied. The model simulates C and N dynamics
at a daily time step. Inputs of the model are additions of C

www.geosci-model-dev.net/11/2111/2018/                                              Geosci. Model Dev., 11, 2111–2138, 2018
2114               Y. Huang et al.: ORCHIMIC (v1.0), a microbe-mediated model for soil organic matter decomposition

Figure 1. Model structure of the ORCHIMIC model. Rectangles and circles represent pools and arrows represent fluxes for Carbon (C;
black) and Nitrogen (N; red). The C and N pools are described in Sect. 2.2. Equations describing the dynamics of each pool and the fluxes
are shown in brackets in the figure and can be found in more detail in Sect. 2.2 and 2.3. Arrows between the FOM and SOM pools and
within the SOM pools represent fluxes due to physicochemical protection by mineral association and microaggregate occlusion. Veguptake,N
is uptake of N by plants and is not explicitly simulated by ORCHIMIC.

2.1    Microbial functional types                                      duction coefficient (Ke ); the ability to produce FOM specific
                                                                       enzymes EF (EFri ) and SOM specific enzymes ES (ESri );
                                                                       and the dissolvable fraction of dead microbial biomass (sC
Four MFTs, SOM specialists, FOM specialists, generalists
                                                                       for C and sN for N) (Table 1). Generalists, SOM special-
and cheaters, are represented with a set of parameters, in-
                                                                       ists and FOM specialists are the three enzyme-producing
cluding the following: a MFT specific C / N ratio (BCNi ) and
                                                                       MFTs that are explicitly considered. The main differences
maximum uptake rate of C (Vmaxuptak,i ) for the ith MFT; op-
                                                                       among them are their C / N ratio and their maximum ca-
timum soil moisture (θ0 ) and pH (pH0 ) for microbial uptake;
                                                                       pacity to produce enzymes for decomposing specific pools.
parameters controlling the microbial uptake sensitivities to
                                                                       The C / N ratios BCNi are set to 4.59 and 8.30 for SOM and
soil moisture (θs ) and pH (pHs ); the maximum enzyme pro-

Geosci. Model Dev., 11, 2111–2138, 2018                                                  www.geosci-model-dev.net/11/2111/2018/
Y. Huang et al.: ORCHIMIC (v1.0), a microbe-mediated model for soil organic matter decomposition                            2115

Table 1. List of variables and parameters used in this study.

                  Variables used in ORCHIMIC
                  Variables          Description                                                  Units
                  dt                 Time step                                                    24 h
                  i                  Represents microbial functional type (MFT) i                 [1, 2, 3]
                  j                  Represents substrate j or parameter KM (only in Eq. 16)      [LM, LS, SA, SS, SP]
                  X                  Represents C or N element                                    [C, N]
                  LMX                X in litter metabolic pool                                   g X (kg soil)−1
                  LSX                X in litter structural pool                                  g X (kg soil)−1
                  SAX                Soil active organic matter pool                              g X (kg soil)−1
                  SSX                Soil slow organic matter pool                                g X (kg soil)−1
                  SPX                Soil passive organic matter pool                             g X (kg soil)−1
                  LLf                Lignin fraction of the LS pool                               unitless
                  AvailX             X pool directly available for microbe’s uptake               g X (kg soil)−1
                  AdsorbX            X pool adsorbed on mineral surfaces                          g X (kg soil)−1
                  BAX,i              X in active microbial biomass of MFT i                       g X (kg soil)−1
                  BDX,i              X in dormant microbial biomass of MFT i                      g X (kg soil)−1
                  EFX,i              X in enzyme produced by MFT i that can decompose FOM         g X (kg soil)−1
                  ESX,i              X in enzyme produced by MFT i that can decompose SOM         g X (kg soil)−1
                  FOMX               Fresh organic matter pools for X (LMX + LSX )                g X (kg soil)−1
                  SOMX               Soil organic matter pools for X (SAX + SSX + SPX )           g X (kg soil)−1
                  LMX,in             Input of X for LM                                            g X (kg soil)−1 dt −1
                  LSX,in             Input of X for LS                                            g X (kg soil)−1 dt −1
                  EFgX,i             X in new EFi produced in one time step                       g X (kg soil)−1 dt −1
                  ESgX,i             X in new ESi produced in one time step                       g X (kg soil)−1 dt −1
                  EFdX,i             X in EFi that is deactivated in one time step                g X (kg soil)−1 dt −1
                  ESdX,i             X in ESi that is deactivated in one time step                g X (kg soil)−1 dt −1
                  BAgX,i             X in new BAi produced in one time step                       g X (kg soil)−1 dt −1
                  BAdX,i             X in BAi that died in one time step                          g X (kg soil)−1 dt −1
                  BAmX,i             BAX,i lost due to maintenance respiration in one time step   g X (kg soil)−1 dt −1
                  BDmX,i             BDX,i lost due to maintenance respiration in one time step   g X (kg soil)−1 dt −1
                  BAtoD,X,i          X transformed from BAX,i to BDX,i in one time step           g X (kg soil)−1 dt −1
                  BDtoA,X,i          X transformed from BDX,i to BAX,i in one time step           g X (kg soil)−1 dt −1
                  AdsorbAvail,X      Adsorbed AvailX in one time step                             g X (kg soil)−1 dt −1
                  DesorbAdsorb,X     Desorbed AdsorbX in one time step                            g X (kg soil)−1 dt −1
                  UptakeX,i          Uptake of X by MFT i in one time step                        g X (kg soil)−1 dt −1
                  UptakeadjX,i       Adjusted UptakeX,i                                           g X (kg soil)−1 dt −1
                  gC,i               Growth rate if only considering C for MFT i                  g X (kg soil)−1 dt −1
                  gN,i               Growth rate if only considering N for MFT i                  g X (kg soil)−1 dt −1
                  Rgi                Growth respiration of MFT i                                  g X (kg soil)−1 dt −1
                  Roi                Overflow respiration of MFT i                                g X (kg soil)−1 dt −1
                  RAmj               Maintenance respiration of active MFT i                      g X (kg soil)−1 dt −1
                  RDmi               Maintenance respiration of dormant MFT i                     g X (kg soil)−1 dt −1
                  Rmi                RAmi + RDmi                                                  g X (kg soil)−1 dt −1
                  DX,j               Flux of X decomposed from substratej                         g X (kg soil)−1 dt −1
                  DlossN,j           Gaseous N losses during decomposition of substrate j         g X (kg soil)−1 dt −1
                  Veguptake,N        N uptake by vegetation                                       g X (kg soil)−1 dt −1

FOM specialists, respectively (Mouginot et al., 2014), based           zyme production capacities are set to be the same for each
on the assumption that SOM decomposers are mainly bac-                 MFT. FOM specialists (i = 1) can produce more enzymes
teria and FOM decomposers are mainly fungi (Kaiser et al.,             that decompose FOM (EFr1 : ESr1 = 0.75 : 0.25); SOM spe-
2014). The C / N ratio of generalists is set to 6.12, in-between       cialists (i = 2) can potentially produce more enzymes that
that of FOM and SOM specialists. The maximum total en-                 decompose SOM (EFr2 : ESr2 = 0.25 : 0.75); whereas gener-

www.geosci-model-dev.net/11/2111/2018/                                                    Geosci. Model Dev., 11, 2111–2138, 2018
2116 Y. Huang et al.: ORCHIMIC (v1.0), a microbe-mediated model for soil organic matter decomposition
Table 1. Continued.
Parameters used in ORCHIMIC
Parameters Description Units
LLfin Lignin fraction of input litter Unitless
LCNin C / N mass ratio of input litter Unitless
LMf Fraction of input litter allocated to LM Unitless
Tref Reference temperature K
T Soil temperature K
θ Soil moisture: fraction of field capacity [0–1] Unitless
pH Soil pH pH units
pH0,ENZ Optimum pH for decomposing substrate pH units
pHs,ENZ Sensitivity parameter to pH for decomposing substrate pH units
θ0,i Optimum θ for growth of MFT i Unitless
pH0,i Optimum pH for growth of MFT i pH units
θs,i Growth sensitivity parameter to θ for MFT i Unitless
pHs,i Growth sensitivity parameter to pH for MFT i pH units
LtoSS The fraction of decomposed LM and non-lignin LS that go to SS pool Unitless
SAtoSS The fraction of decomposed SA that goes to SS pool Unitless
SAtoSP The fraction of decomposed SA that goes to SP pool Unitless
SStoSP The fraction of decomposed SS that goes to SP pool Unitless
BCNi C / N ratio for MFT i Unitless
CC Soil clay content Unitless
Vmaxuptake,i Maximum uptake rate of C at optimum conditions for MFT i h−1
Ke Maximum enzyme production coefficient h−1
EFri Maximum FOM decomposing enzyme production capacity of MFT i Unitless
ESri Maximum SOM decomposing enzyme production capacity of MFT i Unitless
Krref Maintenance respiration coefficient of microbes at Tref h−1
Kr Maintenance respiration coefficient of microbes at T h−1
b Ratio of maintenance respiration rate for BD to BA Unitless
dMFT,i Death rate of MFT i h−1
dENZ Turnover rate of enzymes h−1
R Ideal gas constant, 0.008314 kJ mol−1 K−1
Eamain Activation energy for maintenance respiration kJ mol−1
Eaj Activation energy for decomposition of substrate j kJ mol−1
Vmaxj Maximum decomposition rate for substrate j at Tref g C (g ENZ C)−1 h−1
AdjLS Ratio of decomposition rate of LM to that of LS Unitless
AdjSA Ratio of decomposition rate of SA to that of SS Unitless
AdjSP Ratio of decomposition rate of SS to that of SP Unitless
KMF Michaelis–Menten constant for decomposition of FOM g C (kg soil)−1
KMS Michaelis–Menten constant for decomposition of SOM g C (kg soil)−1
EaKM Activation energy for Michaelis–Menten constants kJ mol−1
CAE Carbon assimilation efficiency Unitless
NAE Nitrogen assimilation efficiency Unitless
sC Soluble fraction of dead microbial for C Unitless
sN Soluble fraction of dead microbial for N Unitless
Kads Avail pool adsorption coefficient at Tref h−1
Kdes Adsorb pool desorption coefficient at Tref h−1
Adsorbmax Max adsorption capacity of soil g C (kg soil)−1
KBA Soil binding affinity, Kads /Kdes Unitless
TAvailX Total available X considering that from decomposition and dead microbes g X (kg soil)−1
KMuptake,X,i Michaelis–Menton constant for uptake of X for MFT i g X (kg soil)−1
Eauptake Activation energy for uptake kJ mol−1
8C,i Saturation ratio of directly available organic C for MFT i Unitless
Kemin Minimum (or constitutive) enzyme production coefficient, defined as ratio of maximum capacity Unitless
Availr Ratio of C in Avail pool to total soil C at beginning Unitless
FEr Parameter for initial total EF concentration Unitless
SEr Parameter for initial total ES concentration Unitless
BAr Initial active biomass ratio Unitless
AdsorbX,0 Initial X (C or N) concentration in Adsorb pool g X (kg soil)−1
FEX,i,max Theoretical maximum initial X concentrations in EF enzyme pools g X (kg soil)−1
SEX,i,max Theoretical maximum initial X concentrations in ES enzyme pools g X (kg soil)−1
B0,i Initial total microbial biomass for MFT i g C (kg soil)−1
Kj Decomposition coefficient of substrate j in CENTURY or PRIM model dt −1
cSA , cSS , cSP Priming parameters for decomposition of SA, SS and SP for PRIM, respectively kg soil (g C)−1
Geosci. Model Dev., 11, 2111–2138, 2018 www.geosci-model-dev.net/11/2111/2018/Y. Huang et al.: ORCHIMIC (v1.0), a microbe-mediated model for soil organic matter decomposition 2117
alists (i = 3) can potentially produce both FOM decompos- of this pool are described by the following:
ing and SOM decomposing enzymes in equal proportions
dSAX X X
(EFr3 : ESr3 = 0.5 : 0.5). However, the real production of the = BAdX,i × (1 − sX ) + EFdX,i + ESdX,i
dt i i
two enzymes depends on availability of substrates and avail-
able C. − DX,SA , (4)
Cheaters are microbes that do not produce substrate- where the first term on the right of the equation represents
decomposing enzymes but profit from the enzymes produced input from non-soluble active microbial biomass mortality
by the other MFTs (Allison, 2005; Kaiser et al., 2015). In summed over all the MFTs; BAdX,i is the input of C or N
ORCHIMIC, enzyme production per unit of active microbial due to the mortality of MFT i (see Sect. 2.3.6); sX is the
biomass decreases with increasing available C availability proportion of microbial biomass that is soluble; the second
(see Sect. 2.3.7 for this dynamic enzyme production mech- term represents the input from enzymes that lost their ac-
anism). This corresponds to a larger fraction of the micro- tivity; EFdX,i and ESdX,i are the inputs of C or N due to
bial biomass behaving as cheaters than when considering turnover of EF and ES enzymes, respectively, produced by
that enzyme production per unit of non-cheaters is constant. MFT i (see Sect. 2.3.7); and DX,SA is the loss of C or N due
Because all three MFTs that are explicitly represented can to decomposition of SA (see Sect. 2.3.1).
partly act as cheaters, and do so to variable degrees, cheaters Regarding the SS pool, there is a flux going from the FOM
are a fourth MFT that is inexplicitly included in the model. pool to the SS pool without being processed by microbes.
Following the CENTURY model (Parton et al., 1987; Stott
2.2 Carbon and nitrogen pools et al., 1983), 70 % of lignin in LS is assumed to go to the
SS pool without microbial uptake. LtoSS is the fraction of
2.2.1 Litter pools decomposed LM and non-lignin LS that goes into the SS
pool. Similarly, there is also a flux from the SA pool to the
The two FOM pools, LM and LS, receive prescribed inputs SS pool that represents non-biological SOM protection pro-
from plant litter fall. The distribution of FOM carbon be- cesses, such as physical protection (Von Lützow et al., 2008).
tween the LM and LS compartments is a prescribed function The dynamics of the SS pool are given by
of the lignin to N ratio of plant material (Eq. 1) following
Parton et al. (1987) (see Sect. 2.3.1). The C / N ratio of the dSSX
= DX,LM × LtoSS + DX,LS × (1 − LLf) × LtoSS
LS pool is set to 150 (Parton et al., 1988) and the C / N ratio dt
of the LM pool is variable depending on the C / N ratio of + DX,LS × LLf × 0.7 + DSX,A × SAtoSS
the FOM input (a forcing of ORCHIMIC representing litter − DX,SS . (5)
quality). The dynamics of the FOM pools are described by
the following: In the above equation the first term represents the input of
X (C or N) from the LM pool without microbial process-
LLfin ing; the second and third terms represent input from the non-
LMf = 0.85 − 0.018 × (1) lignin part and the lignin part of the LS pool, respectively;
LCNin
dLMx the fourth term represents input from the SA pool; LLf is the
= LMX,in − DX,LM (2) lignin fraction of the LS pool; DX,SS is the loss of C or N
dt
dLSX from the decomposition of the SS pool (see Sect. 2.3.1); and
= LSX,in − DX,LS , (3) SAtoSS is the fraction of decomposed SA becoming phys-
dt
ically or chemically protected and added to the SS pool, as
where LMf is the fraction of litter input C allocated to the modified by the soil clay content (CC) (Parton et al., 1987):
LM pool; LLfin and LCNin are the respective lignin content SAtoSS = 0.146 + 0.68 × C. (6)
and C / N ratio of litter input to the FOM pools; X represents
C or N; LMx,in and LSx,in are the litter input partitioned to The SP pool is more resistant to decomposition than the SS
the LM and LS pools based on LMf and C / N ratio of litter pool. It receives fluxes from the SA and SS pools and its
input, respectively; DX,LM and DX,LS are loss of X due to the dynamics are described as follows:
enzymatic decomposition of LM and LS, respectively (see
dSPX
Sect. 2.3.1). = DX,SA × SAtoSP + DX,SS × SStoSP − DX,SP , (7)
dt
2.2.2 Soil organic matter pools where the first and second terms represent input from
the SA and SS pools, respectively; SAtoSP = 0.004 and
The three SOM pools (SA, SS and SP) represent substrates SStoSP = 0.03 are the respective fractions of decomposed
that are decomposed by SOM decomposing enzymes. The SA and SS that go into the SP pool (Parton et al., 1987);
SA represents the insoluble part of dead microbes and deac- and DX,SP is the loss of C or N due to decomposition (see
tivated enzymes that have a fast turnover time. The dynamics Sect. 2.3.1).
www.geosci-model-dev.net/11/2111/2018/ Geosci. Model Dev., 11, 2111–2138, 20182118 Y. Huang et al.: ORCHIMIC (v1.0), a microbe-mediated model for soil organic matter decomposition
2.2.3 Pools of C and N available for microbial and Veguptake,N is N taken up by plants, a boundary condition
plant uptake, and gaseous N loss of the model; and leachingC and leachingN are the respective
losses of C and N due to leaching.
The available C and N pool (Avail in Fig. 1) represents C and
N directly available for microbial uptake. It receives C and N 2.2.4 Adsorbed C and N on mineral surfaces
decomposed from FOM and SOM pools, the soluble part of
dead microbes (Schimel and Weintraub, 2003; Kaiser et al., The C and N in the Avail pool can be reversibly adsorbed
2014) and C and N desorbed from mineral surfaces. C and N (Adsorb pool in Fig. 1) and rendered unavailable to microbes
from this pool can also be taken up by microbes or adsorbed and plants (for N). The dynamics of the Adsorb pool are
onto mineral surfaces. N released from microbial biomass af- given by
ter maintenance respiration by dormant and active microbes dAdsorbX
(only when C uptake is not sufficient) is also assumed to be = AdsorbAvail,X − DesorbAdsorb,X , (10)
dt
a input source for the Avail pool. In addition, uptake of N by
plant roots (a forcing of ORCHIMIC in the case of coupling where the first term is the C or N adsorbed onto mineral sur-
with a vegetation model) and loss of C and N due to leach- face and the second term is the C or N desorbed from mineral
ing are modeled as fluxes removed from this pool. Gaseous surface (see Sect. 2.3.8).
N loss due to nitrification and denitrification (see Eq. 26 in
2.2.5 Enzymes pools
Sect. 2.3.1) is considered as a decreased input from substrate
decomposition. The dynamics of the Avail pool are described We distinguish between two types of enzymes (EF and ES),
by Eqs. (8) and (9) for C and N, respectively. which catalyze the decomposition of FOM and SOM, respec-
dAvailC tively. Each MFT produces enzymes according to their spe-
= DC,LM × (1 − LtoSS) + DC,LS × LLf × 0.3 cialization. The turnover rate of both types of enzymes is as-
dt
sumed to be the same. The dynamics of the FOM and SOM
+ DC,LS × (1 − LLf) × (1 − LtoSS) + DC,SA
decomposing enzyme pools are described by the following:
× (1 − SAtoSS − SAtoSP) + DC,SS
X dEFX,i
=EFgX,i − EFdX,i (11)
× (1 − SStoSP) + DC,SP + BAdC,i × sC
dt
i
X dESX,i
− UptakeadjC,i + DesorbAdsorb,C =ESgX,i − ESdX,i , (12)
dt
i
where EFgX,i and ESgX,i are the respective production rates
− AdsorbAvail,C − leachingC (8)
of enzymes EF and ES by MFT i, with i = 1 for FOM spe-
dAvailN cialists, i = 2 for FOM specialists and i = 3 for generalists
= DN,LM × (1 − LtoSS) + DN,LS × LLf × 0.3
dt (see Sect. 2.3.7). EFdX,i and ESdX,i are the turnover rates
+ DN,LS × (1 − LLf) × (1 − LtoSS) + DN,SA of the enzymes EF and ES, respectively, produced by MFT i
× (1 − SAtoSS − SAtoSP) + DN,SS (see Sect. 2.3.7).
!
X 2.2.6 Active and dormant microbial biomass pools
× (1 − SStoSP) + DN,SP − DlossN,j
j
X X In ORCHIMIC, each MFT can be active or dormant and can
+ BAdN,i × sN − BAgN,i switch from one state to the other depending on environmen-
i i tal conditions. When active, the mass of each MFT is defined
+ DesorbAdsorb,N − DesorbAvail,N by the balance between their growth, death, production of en-
+
X
BAmN,i + BDmN,i − Veguptake,N zymes, maintenance and growth respiration and exchange of
i
mass with dormant biomass (BD). If the uptake of C can not
meet the need for maintenance respiration, the active mass of
− leachingN , (9)
a MFT will respire part of its biomass as CO2 . When micro-
where UptakeadjC,i is C taken up by MFT i (see Sect. 2.3.2); bial biomass becomes dormant, its carbon can be reactivated
DesorbAdsorb,C and DesorbAdsorb,N are the fluxes of C and N or respired through maintenance respiration. When respira-
desorbed from mineral surface, respectively (see Sect. 2.3.8); tion is at the cost of their biomass, a corresponding amount
AdsorbAvail,C and AdsorbAvail,N are C and N absorbed by of N is assumed to be lost from dormant microbial biomass
mineral surface, respectively (see Sect. 2.3.8); DlossN,j is and goes to the Avail pool so that the stoichiometry of the
the gaseous N loss; BAgN,i is N assimilated by MFT i (see dormant microbes remains unchanged. The dynamics for ac-
Sect. 2.3.4); BAmN,i and BDmN,i are N released from the tive and dormant microbes are described by the following:
maintenance respiration of active and dormant biomass for dBAX,i
MFT i to the AvailN pool, respectively (see Sect. 2.3.3); =BAgX,i + BDtoA,X,i − BAdX,i − EFgX,i
dt
Geosci. Model Dev., 11, 2111–2138, 2018 www.geosci-model-dev.net/11/2111/2018/Y. Huang et al.: ORCHIMIC (v1.0), a microbe-mediated model for soil organic matter decomposition 2119
− ESgX,i − BAtoD,X,i − BAmX,i (13) where Fθ , FT ,j , FpH , Fclay and Flignin are the respective func-
dBDX,i tions of soil moisture (θ ), temperature (T ), pH, clay con-
=BAtoD,X,i − BDmX,i − BDtoA,X,i , (14) tent (CC) and lignin content (LLf) that modify substrate de-
dt
composition rates; j represents substrate which are LM, LS,
where BAgX,i is the increase of BAX due to growth for SA, SS or SP or parameter KM; Eaj is the activation en-
MFT i (see Sect. 2.3.4); BDtoA,X,i is the X in microbes ergy of substrate j ; Tref is a reference temperature, which
transformed from dormant state to active state for MFT i; was set to 285.15 K; pH0,ENZ is the optimum pH of enzy-
BAtoD,X,i is the X in microbes transformed from active state matic decomposition; pHs,ENZ is a sensitivity parameter of
to dormant state for MFT i (see Sect. 2.3.5); BAdX,i is the enzymatic decomposition; and R is the ideal gas constant
loss of X due to death of active biomass of MFT i; and (0.008314 kJ mol−1 K−1 ).
BAmX,i and BDmX,i are the loss of X in active biomass and Thus, the decomposition of C in LM, LS, SA, SS and SP
dormant biomass, respectively, due to maintenance respira- pools can be described by Eqs. (20), (21), (22), (23) and (24),
tion of MFT i. respectively. The decomposition of N follows the C / N ratio
of the corresponding substrate (Eq. 25). N can be lost through
2.3 Modeling the processes controlling fluxes between volatilization of N products (NH3 , N2 , N2 O) generated dur-
pools ing decomposition, nitrification and denitrification (Schimel,
1986; Mosier et al., 1983). Like in the CENTURY model
2.3.1 Organic matter decomposition (Parton et al., 1987, 1988), we assumed that 5 % of total N
mineralized during decomposition is lost to the atmosphere
as a first-order approximation of volatilization, nitrification
The substrate used by microorganisms includes FOM and
and denitrification losses (DlossN,j , Eq. 26).
SOM. The FOM and SOM pools are decomposed by en-
zymes EF and enzymes ES, respectively. The decomposi-
X
DC,LM = VmaxLM × FT ,LM × i
EFi
tion process is modeled using a combination of Arrhenius
and Michaelis–Menten equations (Allison et al., 2010), with LMC
× P
different Vmax values for each substrate pool and different KMF × FT ,KM + LMC + i EFC,i
Michaelis–Menten constants (KM) for FOM and SOM. To × Fθ × FpH × dt (20)
avoid unrealistic decomposition rates when enzyme concen- VmaxLM X
trations are high, an enzyme-dependent term was added in DC,LS = × FT ,LS × i
EFC,i
AdjLS
the denominator (ECA kinetics). Vmax values are consid-
ered to be sensitive to temperature and modeled using an LSC
× P
Arrhenius equation (Eq. 16), with higher activation energy KMF × FT ,KM + LSC + i EFC,i
(Ea) for more recalcitrant substrates (Allison et al., 2010). × Fθ × FpH × Flignin × dt (21)
KM is also considered to be sensitive to temperature (Allison X
DC,SA = VmaxSS × AdjSA × FT ,SA × ESC,i
et al., 2010; Wang et al., 2013) and the dependency of KM i
on temperature is modeled using an Arrhenius equation with SAC
×
an activation energy (EaKM ) of 30 kJ mol−1 (Davidson and
P
KMS × FT ,KM + SAC + i ESC,i
Janssens, 2006) (Eq. 16). All decomposition functions are × Fθ × FpH × Fclay × dt (22)
modulated by soil moisture (θ ) and pH. The decomposition X
function of LS is further modified by its lignin content (Par- DC,SS = VmaxSS × FT ,SS × i
ESC,i
ton et al., 1987). The decomposition function of SA is fur- SSC
×
ther modified by soil clay content (CC) (Parton et al., 1987).
P
KMS × FT ,KM + SSC + i ESC,i
The functions modifying substrates’ decomposition rates by
× Fθ × FpH × dt (23)
θ (Krinner et al., 2005), T (Wang et al., 2012), pH (Wang et
al., 2012), lignin content (Parton et al., 1987) and soil clay VmaxSS X
DC,SP = × FT ,SP × i
ESC,i
content (Parton et al., 1987) are given by the following: AdjSP
SPC
× P
KMS × FT ,KM + SPC + i ESC,i
h i
Fθ = max 0.25, min 1, −1.1 × θ 2 + 2.4 × θ − 0.29 (15)
−Eaj × Fθ × FpH × dt (24)
1
R T − T1
FT ,j = e ref (16) jN
DN,j = DC,j × (25)
(
− pH−pH0,ENZ )2 jC
pH2s,ENZ
FpH = e (17) DlossN,j = DN,j × 0.05 (26)
−3×LLf
Flignin = e (18) In the abovementioned equations DC,LM , DC,LS , DC,SA ,
Fclay = 1 − 0.75 × CC, (19) DC,SS and DC,SP are C flux from LM, LS, SA, SS, and SP
www.geosci-model-dev.net/11/2111/2018/ Geosci. Model Dev., 11, 2111–2138, 20182120 Y. Huang et al.: ORCHIMIC (v1.0), a microbe-mediated model for soil organic matter decomposition
pools due to enzymatic decomposition, respectively; DN,j is than total available C (Eq. 31).
the N flux from substrate j due to enzymatic decomposition;
DlossN,j is the gaseous N loss from substrate j ; j represents UptakeC,i = Vmaxuptake,C,i × 8C,i × BAC,i × fT ,i
substrate which are LM, LS, SA, SS or SP; VmaxLM and × fpH,i × dt (30)
VmaxSS are maximum decomposition rates of C in LM and UptakeadjC,i = (31)
SS pool, respectively; KMF and KMS are KM for FOM and P
SOM pools, respectively; dt is the time step in unit of hour; UptakeC,i , i UptakeC,i ≤ TAvailC
TAvailC X
AdjLS is the ratio of maximum decomposition rate of C in UptakeC,i × P , i
UptakeC,i > TAvailC
LM to that in LS; AdjSA and AdjSP are the ratios of maxi- i UptakeC,i
mum decomposition rate of C in SA to that in SS and that in The total available C or N includes the C and N in the Avail
SS to that in SP, respectively; and jC and jN are the respec- pool as well as that rendered available during decomposition
tive mass concentrations of C and N in substrate j pool. and that recycled from deceased microbes (Eqs. 32 and 33).
X X
2.3.2 Uptake of C and N by microbes TAvailC = AvailC + i
BAd C,i × S C + D
j C,j
(32)
X
TAvailN = AvailN + BAdN,i × SN
The uptake of C from the Avail pool is modeled as a function X i
of microbial active biomass (Wang et al., 2014), and uptake + DN,j − DlossN,j (33)
j
rates are modulated by T , θ and pH. The effect of T on the
uptake rate is modeled using an Arrhenius equation follow- The uptake of N by microbes follows the C / N ratio of total
ing Allison et al. (2010). The effect of θ and pH are modeled available C and N (Eq. 34):
using exponential quadratic functions (Reth et al., 2005). Ad-
TAvailN
ditionally, the uptake rate is also affected by the saturation UptakeadjN,i = UptakeadjC,i × , (34)
ratio of the available C pool (AvailC ) they feed on. ECA ki- TAvailC
netics formulation (Tang and Riley, 2013) is used to estimate where UptakeC,i is the theoretical uptake of C by MFT i
the saturation ratio of the Avail pool. With this formula, the under given 8C,i without considering the total available C;
saturation ratio depends not only on the concentration of the UptakeadjC,i and UptakeadjN,i are the real uptake of C and
Avail pool but also on the concentration of the active micro- N by MFT i, respectively; the KMuptake,C,i is KM for the up-
bial biomass. Thus, competition for the Avail pool among take of C by MFT i and is set to be the same for all MFTs;
different MFTs and limitation for one MFT is implicitly in- Vmaxuptake,C,i is the maximum uptake rate of C by MFT i
cluded due to the fact that the uptake rate is modulated by and is also set to be the same for all MFTs; and TAvailC and
active biomass concentration and the level of the Avail pool. TAvailN are the total available C and N, respectively.
Therefore, when active biomass is high, the uptake rate per
unit of active biomass is reduced, mimicking the competi- 2.3.3 Maintenance respiration
tion. The functions modifying microbes’ uptake rates by T
and pH are given by Eqs. (27) and (28), respectively. The The maintenance respiration of MFTs (bacteria and fungi) is
saturation ratio of the available C pool is given by Eq. (29). modeled as a fixed ratio (maintenance respiration coefficient)
of their biomass (Schimel and Weintraub, 2003; Lawrence et
−Eauptake 1 al., 2009; Allison et al., 2010; Wang et al., 2014; He et al.,
− T1
fT ,i = e R T ref (27) 2015) modulated by temperature using an Arrhenius equa-
2 tion following Tang and Riley (2015) (Eq. 35). Dormant mi-
(
− pH−pH0,i )
pH2s,i
crobes still need a minimum of energy for maintenance, al-
fpH,i = e (28) beit at a much lower rate compared that of active microbes
AvailC (Lennon and Jones, 2011). The maintenance respiration co-
8C,i = P (29)
KMuptake,C,i × FT ,KM + AvailC + i BAC,i efficient of dormant microbes is set to be a ratio (b) (be-
tween zero and one) of that of active microbes (Wang et
In the abovementioned equations fT ,i and fpH,i are temper- al., 2014; He et al., 2015). Thus maintenance respiration can
ature and pH function modifying uptake rate of MFT i, re- be described by Eqs. (36) and (37) for active and dormant
spectively; 8C,i is the saturation ratio of the available carbon microbes, respectively. Dormant microbes respire their own
pool; Eauptake is the activation energy for uptake; pH0,i is the biomass for survival (Eqs. 38 and 39). Active microbes take
optimum pH for uptake by MFT i; and pHs,i is a sensitivity up C from the Avail C pool to meet their maintenance respi-
parameter for uptake by MFT i to pH. ration requirement. If the C taken up does not suffice, active
Potential uptake of C is given by Eq. (30). Total uptake microbes will use part of their own biomass for maintenance
of C by all microbes should not exceed the total available respiration (Eqs. 40 and 41).
C, therefore all microbes decrease their uptake by the same −Eamain
1
R T − T1
proportion as a trade off when total demand of C is larger Kr = Krref × e ref (35)
Geosci. Model Dev., 11, 2111–2138, 2018 www.geosci-model-dev.net/11/2111/2018/Y. Huang et al.: ORCHIMIC (v1.0), a microbe-mediated model for soil organic matter decomposition 2121
RAmi = Kr × BAC,i × dt (36) Roi = UptakeadjC,i − RAmi − BAgC,i − Rgi (47)
RDmi = b × Kr × BDC,i × dt (37)
In the abovementioned equations gC,i and gN,i are theoretical
BDmC,i = RDmi (38) growth rates when only considering C-limited and N-limited
BDmC,i growth rates, respectively; BAgC,i and BAgN,i are the re-
BDmN,i = (39)
BCNi spective increases of C and N in microbial biomass; CAE
n
0, RAm ≤ Uptake is the carbon assimilation efficiency; NAE is the nitrogen as-
BAmC,i = RAm −i Uptakeadjadji , RAm > Uptakeadj (40)
i C,i i C,i similation efficiency, which is set to one in this study; Rgi is
BAmC,i growth respiration by MFT i; and Roi is overflow respiration
BAmN,i = (41)
BCNi by MFT i.
In the abovementioned equations RAmi and RDmi are the 2.3.5 Transformation between active and dormant
maintenance respiration of active and dormant biomass for states
MFT i, respectively; BDmC,i and BDmN,i are the respec-
tive C and N loss from dormant biomass for MFT i due Microbes can be active and dormant in the environment and
to maintenance respiration; BAmC,i and BAmN,i are C and can transform between these two states (Blagodatskaya and
N loss from active biomass for MFTi due to maintenance Kuzyakov, 2013). Active microbes take up carbon and invest
respiration, respectively; Eamain is the activation energy of it in maintenance, growth and enzyme production. Microbes
the maintenance respiration coefficient; and Krref and Kr are become dormant to lower their maintenance cost and survive
the maintenance respiration coefficient at temperature T and under unfavorable conditions. The maintenance energy cost
Tref , respectively. is thought to be one of the key factors regulating the dor-
mancy strategy (Lennon and Jones, 2011). Wang et al. (2014)
2.3.4 Growth of microbes, growth respiration and
assumed that transformation between the two states was de-
overflow respiration
termined by the saturation ratio of substrates and the mainte-
If C uptake exceeds the maintenance respiration flux, the nance rate of active microbes. In ORCHIMIC, microbes feed
excess C can be allocated to microbial growth and growth on the Avail pool instead of on substrates, as in their model,
respiration. The allocation between biomass production and and considering that C is the sole energy source, the satura-
growth respiration is controlled by the carbon assimilation tion ratio of the substrate is replaced here by the saturation
efficiency (CAE), defined as the maximum fraction of C ratio of the AvailC pool (8C,i ). With 8C,i , the effect of com-
taken up that can be allocated to microbial biomass. The al- petition on the microbes’ dormancy strategy is implicitly in-
location of N uptake to microbial biomass is controlled by cluded. The transformation from the active to dormant phase
the nitrogen assimilation efficiency (NAE), which is defined (BAtoD,X,i ) or the reverse (BDtoA,X,i ) are given by
as the maximum fraction of N uptake that can be allocated to
BAtoD,X,i = 1 − 8C,i × Kr × BAX,i × dt (48)
microbial biomass and is assumed equal to one (Manzoni and
Porporato, 2009; Porporato et al., 2003). The final growth of BDtoA,X,i = 8C,i × Kr × BDX,i × dt. (49)
microbial biomass depends on the availability of C and N and
is restricted by C or N depending on which element is more 2.3.6 Death of microbes
limiting. Growth of microbial biomass and growth respira-
The death rate of microbes is modeled as a fraction (dMFT,i )
tion are described by Eqs. (42)–(45) and (46), respectively.
of their active biomass (Schimel and Weintraub, 2003; Alli-
Under C limited conditions, the excess N in the microbes is
son et al., 2010) (Eq. 17). Dormant microbes never die, but
released back to the Avail pool. Under N limited conditions,
their biomass can be drawn to a minimal value in the case of
the C that can not be incorporated by microbes is assumed to
maintenance respiration over a long period of time. The loss
be respired through overflow metabolism (Eq. 47) (Schimel
of C (BAdC,i ) and N (BAdN,i ) from microbial biomass due
and Weintraub, 2003), defined as overflow respiration.
to the death of microbes is described by
(
UptakeadjC,i − RAmi × CAE,
gC,i = if UptakeadjC,i − RAmi > 0 (42) BAdX,i = dMFT,i × BAX,i × dt. (50)
0 , if UptakeadjC,i − RAmi ≤ 0
UptakeadjN,i × NAE 2.3.7 Enzyme production and turnover
gN,i = (43)
BCNi The production of enzymes is modeled as a fraction of active
BAgC,i = minimum gC,i , gN,i (44) microbial biomass (Allison et al., 2010; He et al., 2015) de-
BAgC,i pending on the MFT, the saturation ratio of FOM (for enzyme
BAgN,i = (45) EF) or SOM (for enzyme ES), and the saturation ratio of the
BCNi
1 − CAE AvailC pool. The effects of the saturation ratio of substrate
Rgi = BAgC,i × (46) (FOM or SOM) and the AvailC pool on enzyme production
CAE
www.geosci-model-dev.net/11/2111/2018/ Geosci. Model Dev., 11, 2111–2138, 20182122 Y. Huang et al.: ORCHIMIC (v1.0), a microbe-mediated model for soil organic matter decomposition
are modeled using ECA kinetics (see Eqs. 51, 52 and 53). ing Eqs. (58) and (59), respectively:
The secondary effects of substrate pools and the AvailC pool
Eaads 1
on enzyme production are considered following the methods − R × T − T1
AdsorbAvail,C = AvailC × Kads × e ref
of Sinsabaugh and Follstad Shah (2012), which considered
the co-limiting effects of multiple resource acquisition. Fur- AdsorbC
× 1− (58)
thermore, a minimum amount of enzyme is produced as con- Adsorbmax
Eades
stitutive enzyme and is synthesized even under extremely un- − × 1
− T1
DesorbAvail,C = Kdes × e R T ref
favorable conditions (Koroljova-Skorobogat’ko et al., 1998;
Kaiser et al., 2015). The production of FOM and SOM de- AdsorbC
× . (59)
composing enzymes are given by Eqs. (54) and (55), respec- Adsorbmax
tively. The deactivation of enzyme is modeled as first-order
The adsorption (AdsorbAvail,N ) and desorption
kinetics of the enzyme pool (Schimel and Weintraub, 2003;
(DesorbAvail,N ) of N are assumed to follow the C / N
Lawrence et al., 2009; Allison et al., 2010; He et al., 2015)
ratio of the Avail and Adsorb pool, respectively (Eqs. 60 and
and is given by Eqs. (56) and (57) for EF and ES, respec-
61).
tively.
LMC + LSC AvailN
K1,FOM = (51) AdsorbAvail,N = AdsorbAvail,C × (60)
P
KMF × FT ,KM + LMC + LSC + i EFC,i AvailC
AdsorbN
SAC + SSC + SPC DesorbAvail,N = DesorbAvail,C × (61)
K1,SOM = P (52) AdsorbC
KMS × FT ,KM + SAC + SSC + SPC + i ESC,i
K2,i = 1 − 8C,i (53) In the above equations Kads and Kdes are adsorption and des-
EFgX,i = BAX,i × Ke × EFri orption coefficients for C, respectively, and the former can
1
be calculated from the production of the latter and the soil
2
× max K1,FOM × K2,i , Kemin (54) binding affinity (KBA ) as follows:
ESgX,i = BAX,i × Ke × ESri Kads = Kdes × KBA . (62)
1
× max K1,SOM × K2,i 2 , Kemin (55)
3 CENTURY and PRIM soil carbon models
EFdX,i = EFX,i × dENZ (56)
ESdX,i = ESX,i × dENZ (57) Here we give a brief summary of CENTURY and PRIM,
the two benchmark models with which we compare OR-
In the abovementioned equations EFgX,i and ESgX,i are the CHIMIC for simulating incubation experiments. The CEN-
X in newly produced enzymes EF and ES by MFT i, respec- TURY model is the SOM module of the ORCHIDEE global
tively; K1,FOM and K1,SOM are the saturation ratios of FOM land biosphere model (Krinner et al., 2005). It is a sim-
and SOM, respectively; Ke × EFri and Ke × ESri are the re- plification of the original CENTURY model (Parton et al.,
spective maximum enzyme production capacities for EF and 1987, 1988), as it does not consider nitrogen interactions.
ES per unit of active biomass; Kemin is the constitutive en- The PRIM variant of CENTURY was developed to capture
zyme production constant, which is defined as a fraction of the magnitude of the priming of SOM decomposition in-
maximum capacity; and dENZ is the turnover rate of enzymes. duced by varying litter inputs (Guenet et al., 2016). Both
are C-only models and have the same structure with simi-
2.3.8 Adsorption and desorption lar pools and fluxes as shown in Fig. 2. The effects of soil
moisture, temperature, pH, lignin and clay content on the de-
Adsorption and desorption fluxes between the Avail and Ad-
composition of each substrate pool are also the same as those
sorb pools are modeled as first-order kinetic functions of
used in ORCHIMIC. Both models do not explicitly represent
the size of those pools, respectively (Wang et al., 2013).
microbial dynamics. The decomposition rates of FOM pools
Both adsorption and desorption coefficients are modulated
in both CENTURY and PRIM (Eqs. A1 and A2) and the de-
by temperature with a respective activation energy of 5
composition rates of SOM pools in CENTURY (Eqs. A6–
(Eaads ) kJ mol−1 and 20 (Eades ) kJ mol−1 (Wang et al., 2013).
A8) are described by first-order kinetics. The decomposition
The soil has a maximum adsorption capacity (Adsorbmax )
rates of the SOM pools in PRIM are modified by the size of
(Kothawala et al., 2008) due to the limited mineral surface
the FOM pool and the more labile SOM pools (Eqs. A6–A8).
available for adsorption (Sohn and Kim, 2005). The satura-
The fluxes from one pool to another are exactly the same as
tion ratio of the Adsorb pool (defined as Adsorb/Adsorbmax )
those described by Parton et al. (1987).
is an important factor controlling adsorption and desorp-
tion rates (Wang et al., 2013). The mass of C adsorbed
(AdsorbAvail,C ) and desorbed (DesorbAvail,C ) is calculated us-
Geosci. Model Dev., 11, 2111–2138, 2018 www.geosci-model-dev.net/11/2111/2018/Y. Huang et al.: ORCHIMIC (v1.0), a microbe-mediated model for soil organic matter decomposition 2123
measured DOC and DON (dissolved organic nitrogen) con-
centration with an a priori uncertainty range of 50–150 %
of the observed values. The initial ratio of active biomass
(BAr) was set to 0.3 (ranging from 0 to 1). By assuming that
the Avail and Adsorb pools were at equilibrium, the initial
concentration of C and N in the Adsorb pool (AdsorbX,0 )
can be calculated from AvailX,0 by Eq. (63). The theoretical
possible maximum initial enzyme concentrations (EFX,i,max
and SEX,i,max for EF and ES, respectively) can be estimated
based on Ke, EFri , ESri , dENZ and active microbial biomass
by assuming equilibrium between active microbial biomass
and enzyme concentrations (calculated by Eqs. (64) and (65),
Figure 2. Pools and fluxes of the CENTURY and PRIM models. respectively). The initial enzyme concentrations for EF and
ES is set to be any value between zero and the theoretical
possible maximum initial enzyme. FEr and SEr, defined as
4 Parameter optimization for incubation experiments the ratio of true initial enzyme concentration for EF and ES
to their theoretical possible maximum initial enzyme concen-
4.1 Data description and model initial conditions trations, respectively, were both set to 0.1 (with a range of
0–1). The initial concentrations for EF and ES are initialized
Data from soil incubation experiments (Blagodatskaya et al., as FEr × FEX,i,max and SEr × SEX,i,max , respectively.
2014) were used to optimize the parameters of ORCHIMIC,
CENTURY and PRIM using a Bayesian calibration proce- AdsorbX,0 =
Eaads 1
dure described in Sect. 4.2. − R × T − T1
Kads × e ref × Adsorbmax × AvailX,0
Although there are many studies investigating the priming Eades
1
Eaads
(63)
− R × T − T1 − R × 1
T − T1
effects of FOM addition on SOM decomposition, few studies Kdes × e ref + Kads × e ref × AvailX,0
actually provided SOM derived respiration fluxes with and Ke × EFri
FEX,i,max = × B0,X,i . (64)
without FOM addition and simultaneous FOM derived respi- dENZ
ration fluxes and microbial biomass changes throughout the Ke × ESri
incubation experiment. In Blagodatskaya et al. (2014), not SEX,i,max = × B0,X,i , (65)
dENZ
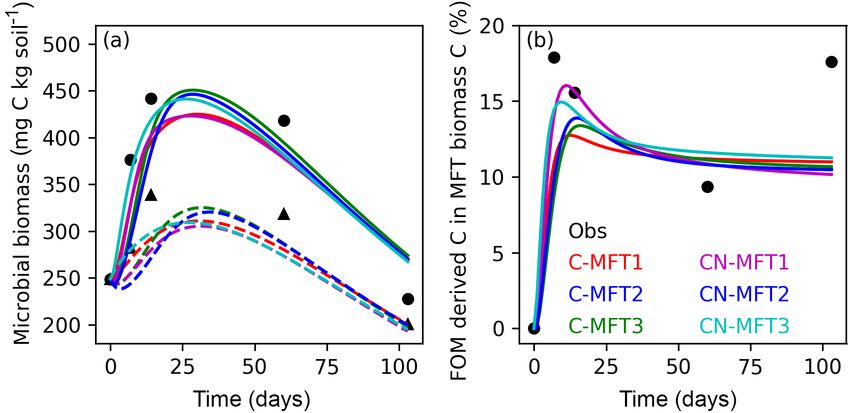
only were the variables mentioned above measured, the frac-
tion of FOM derived C in both microbial biomass and DOC where AdsorbX,0 is the initial X (C or N) concentration in the
was also measured, which are both very useful for calibrating Adsorb pool; FEX,i,max and SEX,i,max are theoretical maxi-
parameters related to microbial dynamics. As a brief sum- mum initial X concentrations in EF and ES enzyme pools,
mary of their incubation experiment, 14 C labeled cellulose respectively; and B0,X,i is the X in initial total microbial
was added into soil as powder at a dose of 0.4 g C (kg soil)−1 biomass of MFT i.
at the beginning of the incubation. The C content of the soil 4.2 Calibration of the parameter values in different
was 24 g C (kg soil)−1 with a C / N ratio of 12. Soil sam- models
ples with and without cellulose addition were incubated at
293.15 K at 50 % of water holding capacity for 103 days. 14 C The Bayesian parameter inversion method with priors has
activity and the total amount of trapped CO2 were measured often been used to optimize model parameters with obser-
at day 1, 4, 7, 9, 12, 14, 19, 23, 27, 33, 48, 61, 71, 90 and vations (Santaren et al., 2007; Guenet et al., 2016), and was
103. In the meantime, microbial biomass and 14 C activity in also applied in this study. The optimized parameters were
both microbial biomass and DOC were measured at days 0, determined by minimizing the following cost function J (x)
7, 14, 60 and 103. (Eq. 66):
Nonetheless, some information required for ORCHIMIC
was still not available and some assumptions were needed. 1h
J (x) = (y − H (x))t R−1 (y − H (x))
The fractions of C in active, slow and passive pools were as- 2 i
sumed to equal the fractions of C in the corresponding pools +(x − x 0 )t P−1 (x − x 0 ) , (66)
of ORCHIDEE under equilibrium at the same site where the
incubated soil was sampled (Guenet et al., 2016). The C / N where x is the parameters vector for optimization; x 0 is
ratios for the three soil carbon pools were assumed equal the prior values vector; P is the parameter error vari-
to the ratio of total soil C and N, and the initial microbial ances/covariances matrix; y is the observations vector; H(x)
biomass was assumed to be equal for each MFT when more is the model outputs vector; and R is the observation error
than one MFT was considered. The initial AvailC (AvailC,0 ) variances/covariances matrix. Errors are assumed to be Gaus-
and AvailN (AvailN,0 ) pools were initialized by the initial sian distributed and independent.
www.geosci-model-dev.net/11/2111/2018/ Geosci. Model Dev., 11, 2111–2138, 2018You can also read