Paleoenvironmental response of midlatitudinal wetlands to Paleocene-early Eocene climate change (Schöningen lignite deposits, Germany)
←
→
Page content transcription
If your browser does not render page correctly, please read the page content below

Clim. Past, 15, 1741–1755, 2019
https://doi.org/10.5194/cp-15-1741-2019
© Author(s) 2019. This work is distributed under
the Creative Commons Attribution 4.0 License.

Paleoenvironmental response of midlatitudinal wetlands to
Paleocene–early Eocene climate change (Schöningen
lignite deposits, Germany)
Katharina Methner1 , Olaf Lenz2 , Walter Riegel2 , Volker Wilde2 , and Andreas Mulch1,3
1 Senckenberg   Biodiversity and Climate Research Centre, 60325 Frankfurt am Main, Germany
2 Senckenberg   Research Institute and Natural History Museum Frankfurt, 60325 Frankfurt am Main, Germany
3 Institute of Geosciences, Goethe University Frankfurt, 60438 Frankfurt am Main, Germany

Correspondence: Katharina Methner (katharina.methner@senckenberg.de)

Received: 11 February 2019 – Discussion started: 14 February 2019
Accepted: 18 July 2019 – Published: 16 September 2019

Abstract. The early Paleogene is marked by multiple neg-           Compared to other nearby peat mire records (Cobham,
ative carbon isotope excursions (CIEs) that reflect massive     UK; Vasterival, F) it appears that wetland deposits around
short-term carbon cycle perturbations that coincide with sig-   the Paleogene North Sea have a consistent CIE magnitude
nificant warming during a high-pCO2 world, affecting both       of ca. −1.3 ‰ in δ 13 CTOC . Moreover, the Schöningen record
marine and terrestrial ecosystems. Records of such hyper-       shares major characteristics with the Cobham Lignite PETM
thermals from the marine–terrestrial interface (e.g., estuar-   record, including evidence for increased fire activity prior to
ine swamps and mire deposits) are therefore of great inter-     the CIE, minor plant species change during the hyperthermal,
est as their present-day counterparts are highly vulnerable     a reduced CIE in δ 13 CTOC , and drowning of the mire (marine
to future climate and sea level change. Here, we assess pa-     ingressions) during much of the Schöningen CIE event. This
leoenvironmental changes of midlatitudinal late Paleocene–      suggests that either the Schöningen CIE reflects the PETM
early Eocene peat mire records along the paleo-North Sea        or that early Paleogene hyperthermals similarly affected pa-
coast. We provide carbon isotope data of bulk organic mat-      leoenvironmental conditions of a major segment of the paleo-
ter (δ 13 CTOC ), organic carbon content (%TOC), and paly-      North Sea coast.
nological data from an extensive peat mire deposited at
a midlatitudinal (ca. 41◦ N) coastal site (Schöningen, Ger-
many). The δ 13 CTOC data show a carbon isotope excursion
of −1.3 ‰ (mean decrease in δ 13 CTOC ; −1.7 ‰ at the onset     1   Introduction
of CIE) coeval with a conspicuous Apectodinium acme. Due
to the exceptionally large stratigraphic thickness of the CIE   Early Cenozoic short-term hyperthermals, such as the
at Schöningen (10 m of section) we established a detailed pa-   Paleocene–Eocene Thermal Maximum (PETM) and the
lynological record that indicates only minor changes in pale-   Eocene Thermal Maximum 2 (ETM2), reflect rapid global
ovegetation leading into and during this event. Instead, pa-    warming events that punctuate the already warm Paleogene
leovegetation changes mostly follow natural successions in      climate. These events coincide with perturbations in the
response to changes along the marine–terrestrial interface.     global carbon cycle, manifested in negative carbon isotope
The available age constraints for the Schöningen Formation      excursions (CIE) due to a rapid and massive 13 C-depleted
hamper a solid assignment of the detected CIE to a particular   carbon input into the ocean–atmosphere system. CIEs are a
hyperthermal such as the Paleocene–Eocene Thermal Maxi-         recurrent phenomenon of early and middle Eocene climate
mum (PETM) or any succeeding hyperthermal event such as         dynamics (e.g., Kennett and Scott, 1991; Cramer et al., 2003;
the Eocene Thermal Maximum 2 (ETM2).                            Lourens et al., 2005; Zachos et al., 2003, 2008, 2010; Sluijs
                                                                and Dickens, 2012).

Published by Copernicus Publications on behalf of the European Geosciences Union.
1742                                                 K. Methner et al.: Paleoenvironmental response of midlatitudinal wetlands

   Among the early Cenozoic climate perturbations, the                lands are likely to contribute significantly to future CO2
Paleocene–Eocene Thermal Maximum (PETM) at ∼ 56 Ma                    emissions (e.g., Dorrepaal et al., 2009; Rumpel et al., 2018)
is one of the best-investigated Cenozoic hyperthermals with           and likely did so during the PETM (Pancost et al., 2007). Ex-
local warming of up to 10 ◦ C (e.g., Dunkley Jones et al.,            tensive wetlands with peat-forming mires and swamps were
2013; Frieling et al., 2014; Sluijs et al., 2006, 2011; Zachos        widespread in the European realm during the Cenozoic and
et al., 2003). In general, the PETM-related CIE consists of a         may have significantly contributed to Cenozoic climate evo-
rapid onset, the main body of the excursion, and a recovery           lution on a global scale (e.g., Kurtz et al., 2003; Pancost et
composed of an early rapid phase followed by a more gradual           al., 2007).
increase in δ 13 C values (McInerney and Wing, 2011). De-                Here, we explore carbon isotope ratios of bulk or-
spite this general pattern, the magnitude of the CIE varies           ganic matter (δ 13 CTOC ) and the total organic matter con-
largely between different environmental settings (on average          tent (%TOC) from the lower part of the Paleocene–Eocene
−2.5 ‰ to −5.5 ‰) and within individual records (−0.6 ‰               Schöningen Formation (Germany). We evaluate the corre-
to −8.0 ‰) (see compilation of McInerney and Wing, 2011).             sponding palynological record to assess the paleoenviron-
The CIE is typically larger in continental than in marine             mental evolution of this wetland and compare our results to
depositional environments. Subsequent to the PETM, the                associated Paleogene lignite records along the paleo-North
ETM2 at ∼ 54 Ma represents the next prominent hyperther-              Sea (Cobham, UK; Vasterival, F) to identify potential region-
mal similarly associated with rapid 13 C-depleted carbon in-          ally coherent paleoenvironmental patterns.
put to the ocean–atmosphere system, resulting in a marine
CIE of ∼ −1.5 ‰ and global warming by several degrees
(∼ 3–5 ◦ C) (Cramer et al., 2003; Lourens et al., 2005; Sluijs        2   Study site and age constraints of the Schöningen
et al., 2009; Stap et al., 2010; Frieling et al., 2014).                  Formation
   Multiple hypotheses exist to explain the 13 C-depleted
carbon input to the atmosphere–ocean system during the                The Schöningen opencast mine (northern Germany) is the
early Cenozoic, including methane clathrate destabilization           type locality of the Schöningen Formation (Riegel et al.,
on continental slopes (Dickens et al., 1995), thermogenic             2012) and offers the opportunity to study Paleocene–Eocene
methane formation by magma injections into organic-rich               climate change in wetland deposits along the paleo-North
mudstones (Svensen et al., 2004), oxidation of vast amounts           Sea coast (Fig. 1a) (Riegel et al., 2012). The Schöningen For-
of organic matter by drying of epicontinental seas (Higgins           mation is mainly early Eocene in age but probably includes
and Schrag, 2006), orbitally triggered permafrost thawing             the topmost part of the Paleocene. It comprises ∼ 150 m
(DeConto et al., 2012), and wildfires and burning of peat-            of alternating lignite seams and clastic interbeds (Fig. 1b)
lands (Kurtz et al., 2003) due to natural causes or triggered         (Brandes et al., 2012; Osman et al., 2013; Riegel et al.,
by a meteorite impact (Cramer and Kent, 2005; Kent et al.,            2012). Detailed age constraints of the Schöningen Forma-
2003). The magnitude of CIEs, taking into account (1) vari-           tion are weak and restricted to dinocyst assemblages and
able preservation of the CIEs in terms of magnitude and dura-         scattered radiometric ages from a core at Emmerstedt ca.
tion in different archives (Trampush and Hajek, 2017; Lyons           20 km north of Schöningen that were tentatively correlated
et al., 2019) and (2) carbon source effects resulting in lo-          with the Schöningen lignite succession (Riegel et al., 2012).
cal variations of CIEs (Sluijs and Dickens, 2012), potentially        It has been speculated that the lower part of the Schöningen
reveals the source of carbon input to the ocean–atmosphere            Formation covers the PETM, as the shallow marine deposits
system. The mixing of terrestrial and marine organic carbon,          of Interbed 2 exhibit a conspicuous peak in the abundance
in particular, exerts a strong effect on the preserved CIE and        of dinoflagellate cysts of the genus Apectodinium (Riegel et
calls for careful disentangling of the carbon isotope signal          al., 2012). The occurrence of high abundances of the species
between these two components (Sluijs and Dickens, 2012).              Apectodinium augustum in midlatitudinal to high-latitudinal
   Thus, assessing the duration and magnitude of CIEs re-             sediments (Schöningen paleolatitude is ∼ 41◦ N; van Hins-
lated to global carbon cycle perturbations at the marine–             bergen et al., 2015; see also Supplement Table S1) has been
terrestrial interface is of great interest, as near-coastal ecosys-   proven to be indicative of the PETM (Bujak and Brinkhuis,
tems are especially vulnerable to global climate change and           1998; Crouch et al., 2001; Heilmann-Clausen et al., 1985;
sea level rise causing large ecological and economic threats          Iakovleva et al., 2001; Sluijs and Brinkhuis, 2009; Sluijs
(IPCC, 2014). Near-coastal wetlands play a major role in              et al., 2006, 2007). The dinoflagellate cysts of the marine-
the global carbon cycle by storing large quantities of ter-           influenced Interbeds 1 and 2 only allow for an assignment of
restrial organic carbon (e.g., Raghoebarsing et al., 2005;            these deposits to dinocyst zone D5, which is characterized by
Rumpel et al., 2018) but are simultaneously a primary source          the mass occurrence of Apectodinium spp. and includes the
of methane emissions to the atmosphere (Christensen et al.,           Paleocene–Eocene boundary (Ahrendt et al., 1995; Köthe,
2003; Kirschke et al., 2013). Peatland conservation has thus          2003). A further distinction in subzones D5na (uppermost
become one of the pressing tasks to meet the Paris Agree-             Paleocene) and D5nb (lowermost Eocene) is based on the
ment (Rumpel et al., 2018), as under global warming peat-             last occurrence of Apectodinium augustum (Köthe, 2003)

Clim. Past, 15, 1741–1755, 2019                                                                 www.clim-past.net/15/1741/2019/
K. Methner et al.: Paleoenvironmental response of midlatitudinal wetlands                                                      1743

Figure 1. (a) Paleogeographic map of northwestern Europe during the early Eocene (adapted from Ziegler, 1990) showing the locations
of the Schöningen opencast mine (D), Cobham (UK), and Vasterival (F). (b) Schematic stratigraphy of the Schöningen area (adapted from
Brandes et al., 2012).

(now Axiodinium augustum; Williams et al., 2015), which              3     Material and methods
is the marker species for the PETM in open marine envi-
ronments (Bujak and Brinkhuis, 1998). This species has not           3.1    Studied sections and sampling
been found in samples from the interbeds at Schöningen and
is also unknown from other Paleocene–Eocene records in               Active lignite mining (1978–2016) yielded excellent expo-
northern and central Germany (Köthe, 2003). Therefore, un-           sures in the now-abandoned opencast mines at Schöningen
equivocal proof for the PETM as based on the occurrence of           (Fig. 1a, Sect. S1, and Fig. S1 in the Supplement). This al-
A. augustum does not exist for the lower part of the Schönin-        lowed for dense sampling of the Paleocene–Eocene Schönin-
gen Formation. However, A. augustum may not have been                gen Formation (Fig. 1b) in the western rim syncline of
present in marginal marine areas under reduced salinities and        the NW–SE-trending Helmstedt–Staßfurt salt wall. From the
could therefore be absent from the Apectodinium acme at              > 4000 samples, collected from more than 50 individual sec-
Schöningen for purely ecological reasons. Frequent occur-            tions over ∼ 30 years accompanying the mining activities in
rences of Apectodinium species have also been noted at other         Schöningen–Südfeld, we selected 121 samples for isotopic
times during the late Paleocene and early Eocene (Bijl et            analyses. These samples comprise two of the lower lignite
al., 2013; Frieling et al., 2018; Heilmann-Clausen, 2018). In        seams (Seam 1 and Seam 2) and the corresponding clastic
the North Sea basin they existed in geographically restricted        interbed, presumably covering the latest Paleocene and early
and marginal marine areas similar to the paleoenvironment            Eocene. The ca. 16 m record consists of three individual sec-
at Schöningen, while at the same time Apectodinium was               tions recovered laterally within 50 m. Stratigraphic continua-
missing in nearby open marine settings (Heilmann-Clausen,            tion could be ensured by the well-exposed, undisturbed, and
2018). In the Schöningen record, for example, another but            laterally traceable lignite seams (e.g., Riegel et al., 2012).
smaller Apectodinium acme could be noticed below Seam                The transitions between the seams and the marine interbeds
6 (Riegel et al., 2012). Increased nutrient supply and re-           are rather abrupt (see Sect. S1 and Fig. S1); however, there is
duced salinity in the marginal marine environment may have           no evidence for any major hiatus. In order to get a more com-
favored Apectodinium, which was therefore not necessar-              prehensive picture of environmental and vegetation change in
ily associated only with warming events such as the PETM             the latest Paleocene–early Eocene, samples from the under-
(Heilmann-Clausen, 2018).                                            lying sediments (Main Seam and Interbed 1) are included in
                                                                     our palynological analyses.
                                                                        The lower three seams (Main Seam, Seams 1 and 2;
                                                                     Fig. 1b) resemble each other in their petrographic and pa-
                                                                     lynological characteristics. In general, the lignite seams are
                                                                     composed of an alternation of dark and medium brown lay-

www.clim-past.net/15/1741/2019/                                                                 Clim. Past, 15, 1741–1755, 2019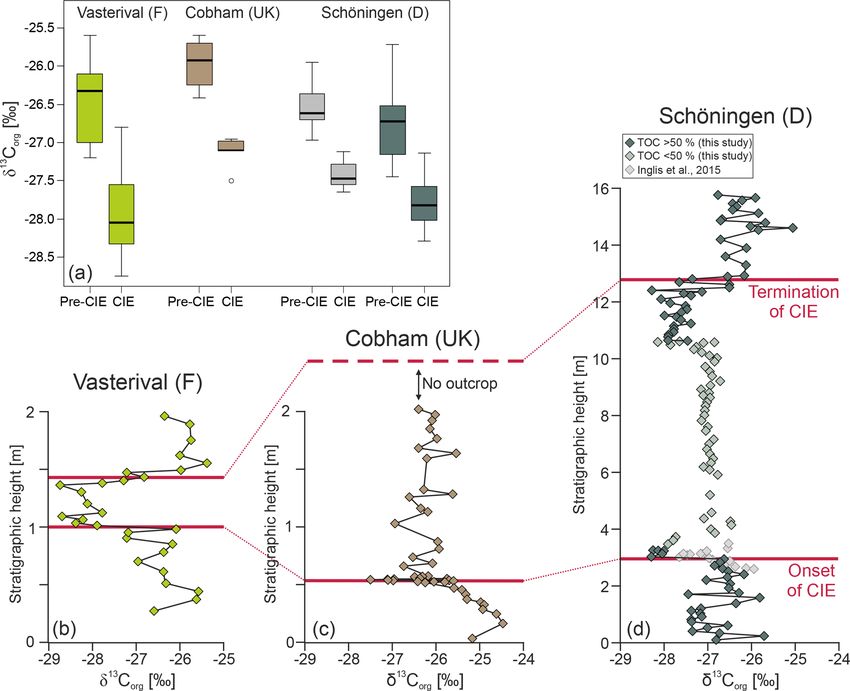
1744                                               K. Methner et al.: Paleoenvironmental response of midlatitudinal wetlands

ers, which often have tree stumps at their base and layers or      samples were further treated with 30 % hydrofluoric acid
lenses of charcoal with tissue preservation in the coal matrix     (HF) for several days. HF was removed by five to six
(Riegel et al., 2012; Robson et al., 2015). Silts to medium-       steps of decanting and diluting. All samples were sieved
grained sands dominate the clastic interbeds. There is still       through a 10 µm mesh sieve. Residues are stored in glycer-
debate about the prevailing deposition conditions of the clas-     ine, and permanent glycerine jelly slides were made. To ob-
tic interbeds (Osman et al., 2013; Riegel et al., 2012). In-       tain a representative dataset, at least 300 individual grains
terbed 1 includes Apectodinium spp., mostly in low num-            of pollen and spores were counted per sample at ×400
bers, and shows little evidence for fully marine conditions but    magnification (data in Table S3). The palynomorphs were
rather indicates local emergence (occurrence of driftwood          mainly identified based on the systematic–taxonomic stud-
and occasional rooting). In contrast, Interbed 2, containing       ies of Thomson and Pflug (1953), Krutzsch (1970), Thiele-
rich dinocyst assemblages with peak abundances of Apec-            Pfeiffer (1988), Nickel (1996), Hammer-Schiemann (1998),
todinium homomorphum and other Apectodinium species                and Lenz (2005). The simplified pollen diagram shows the
(Fig. S4), is indicative of shallow marine depositional con-       abundance of the most important palynomorphs in percent-
ditions (Riegel et al., 2012). For a more detailed description     ages. Pollen and spores were calculated to 100 %, whereas
of the lithology of the sampled sections, the reader is referred   dinoflagellate cysts (Apectodinium spp.) and other algae were
to Riegel and Wilde (2016) and Riegel et al. (2012) as well        added as additional percentages (in percent of the total pollen
as to the detailed logs in the Supplement (Sect. S1, Fig. S1).     sum).
                                                                      To reveal compositional differences between the different
3.2    Carbon isotope analyses
                                                                   coal seams and interbeds, nonmetric multidimensional scal-
                                                                   ing (NMDS; Shepard, 1962a, b; Kruskal, 1964) was per-
A total of 121 samples were selected for analysis of total         formed for the pollen and spore dataset excluding algae.
organic carbon content (%TOC) and carbon isotope compo-            NMDS is the most robust unconstrained ordination method
sition of bulk organic matter (δ 13 CTOC ), providing a %TOC       in ecology (Minchin, 1987) and has been successfully ap-
and δ 13 CTOC record of 16 m with an average sample spac-          plied to palynological data in previous studies (e.g., Os-
ing of ∼ 13 cm. Sample preparation included freeze-drying,         wald et al., 2007; Jardine and Harrington, 2008; Mander
grinding, removal of inorganic carbon (using 10 % HCl              et al., 2010; Ghilardi and O’Connell, 2013; Broothaerts et
for 24 h at 40 ◦ C), centrifugation (four times at 2800 to         al., 2014; Lenz and Wilde, 2018). The method avoids the
3000 rpm for 4 to 8 min), and sample drying (24 h at 40 ◦ C).      assumption of a linear response model or a unimodal re-
About ∼ 0.2 mg (lignite samples) and up to ∼ 6 mg (ma-             sponse model between the palynomorph taxa and the under-
rine interbed samples) were analyzed using a Flash EA 1112         lying environmental gradients and avoids the requirement of
(Thermo Finnigan) coupled to a MAT 253 gas source mass             normality of data. For NDMS the Bray–Curtis dissimilarity
spectrometer (Thermo Finnigan) at the Goethe University–           and the Wisconsin double standardized raw data values have
Senckenberg BiK-F Joint Stable Isotope Facility (Frankfurt).       been used (Bray and Curtis, 1957; Gauch and Scruggs, 1979;
USGS 24 and IAEA-CH-7 standard materials were analyzed             Oksanen, 2007). Wisconsin standardization scales the abun-
on a daily basis, and replicate measurements of reference ma-      dance of each taxon to its maximum value and represents
terials and samples indicate an uncertainty of < 0.2 ‰ for         the abundance of each taxon by its proportion in the sample
measured δ 13 CTOC values. Total organic carbon concentra-         (Mander et al., 2010). This equalizes the effects of rare and
tions (%) were calculated by relating the signal size of the       abundant taxa and removes the influence of sample size on
samples and the averaged signal size of the daily standards        the analysis (Von Tongeren, 1995; Jardine and Harrington,
(USGS 24, n = 8). The typical error is ∼ 0.5 % based on            2008).
mass spectrometric analysis and the maximum difference in
TOC contents of replicate measurements (including weigh-
                                                                   4     Results and discussion
ing uncertainties) was ∼ 7 %.
                                                                   4.1    The CIE in the basal Schöningen Formation
3.3    Palynological analyses
                                                                   The total organic carbon content across the analyzed section
The palynological analysis is primarily based on revised           ranges from ∼ 0.2 % to 69 % and correlates with lithology,
data of 59 samples from a section between the top of the           with TOC contents generally > 50 % in the lignite seams and
Main Seam and the top of Seam 2 (Hammer-Schiemann,                 < 10 % in the clastic interbed (Fig. 2a). Carbon isotope ra-
1998). For palynological processing, lignite samples were          tios of bulk organic matter range from −25.1 ‰ to −28.3 ‰
crushed to a particle size of 1 to 2 mm. All lignite and in-       (Fig. 2b). In the basal part (0 to 2.9 m) of the section δ 13 CTOC
terbed samples were carefully treated with hot 15 % hy-            varies between −25.7 ‰ and −27.4 ‰ (average δ 13 CTOC =
drogen peroxide (H2 O2 ) and ca. 5 % potassium hydroxide           −26.76 ± 0.46 ‰, n = 26). At 3.0 m of section, δ 13 CTOC
(KOH) for 1 to 2 h. In our experience this does not al-            abruptly decreases to values as low as −28.3 ‰ and remains
ter the palynomorph record to a major extent. The clastic          low within the next 0.7 m (average δ 13 CTOC = −28.02 ±

Clim. Past, 15, 1741–1755, 2019                                                               www.clim-past.net/15/1741/2019/
K. Methner et al.: Paleoenvironmental response of midlatitudinal wetlands 1745
depleted in 13 C compared to terrestrial organic matter (e.g.,
Sluijs and Dickens, 2012). However, given the near-coastal
setting of the Schöningen locality during the early Paleogene
we can expect a significant terrestrial contribution to the
TOC content (confirmed by the presence of abundant ter-
restrially derived pollen; Fig. 5), which would increase the
δ 13 CTOC values (Sluijs and Dickens, 2012). Interestingly, the
average δ 13 CTOC value (−27.68 ± 0.43 ‰) agrees well with
CIE-related δ 13 CTOC values with high (∼ 80 %) terrestrial
contributions of organic matter (data from IODP site 4A;
Sluijs and Dickens, 2012). The low δ 13 CTOC values at the
base of Interbed 2 (three samples with ∼ −28 ‰) may
indicate reworking of the underlying peat deposits, which is
supported by scattered lignite material in the sediments.
Detailed biogeochemical investigations of Seam 1 in a
nearby section from Schöningen also showed a gradual de-
pletion in δ 13 CTOC as well as in mid- and long-chain n-
alkanes at the top of Seam 1 (Inglis et al., 2015, 2017).
Moreover, the absolute %TOC and δ 13 CTOC values (Inglis
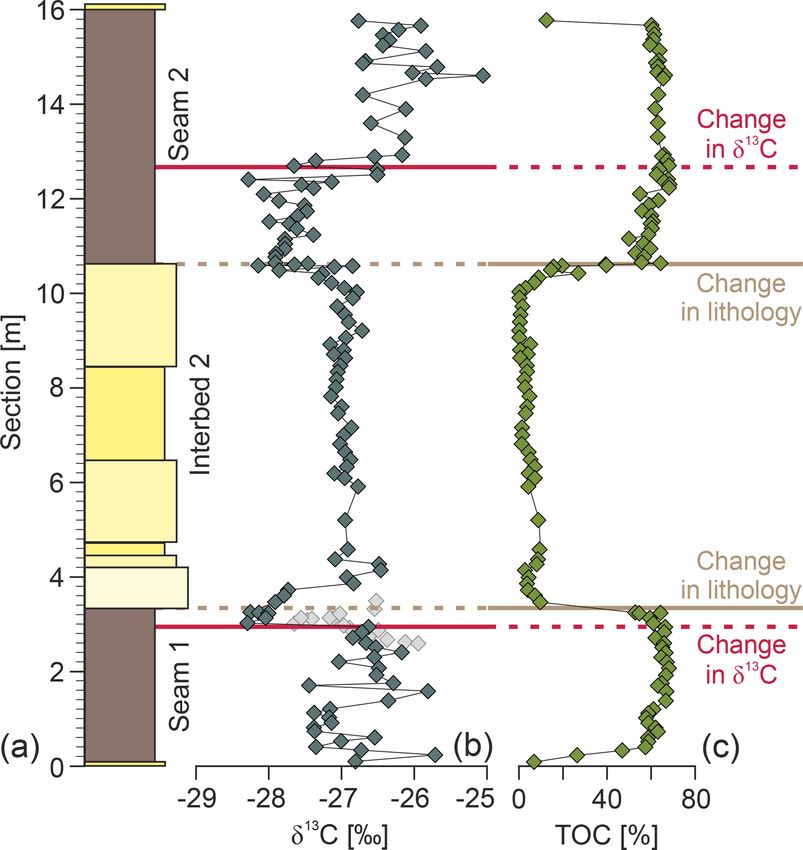
Figure 2. (a) Composite stratigraphic section, (b) δ 13 C values of
et al., 2015) are in very good agreement with our newly
bulk organic matter, and (c) total organic carbon (%TOC). Lines
denote lithological changes between the marine interbed and the derived data and reveal a statistically significant (single-
lignite seams (brown) and changes in δ 13 C values independent of tailed t test p < 0.000003) negative shift in δ 13 CTOC values
lithological changes (red). at the top of Seam 1 with 1δ 13 CTOC =∼ −1.0 ‰ (from av-
erage δ 13 CTOC = −26.53 ± 0.30 ‰ to δ 13 CTOC = −27.52 ±
0.09 ‰) (Fig. 3a).
We consider the excursion in δ 13 CTOC within the lignite
0.19 ‰, n = 8). At 3.9 m of section, δ 13 CTOC values increase seams, which is thus independent of lithological changes,
to 26.95 ± 0.16 ‰ (n = 37) and remain constant (−26.5 ‰ to demark the onset and termination of a CIE in the basal
to −27.3 ‰) for the next 6.5 m before they decrease again part of the Schöningen Formation. It shows an abrupt de-
to −28.1 ‰ (at 10.6 m) and reach values as low as −28.3 ‰ crease (1δ 13 CTOC = −1.7 ‰ within 0.08 m of section; 2.94
(at 12.4 m). Between 12.4 and 12.9 m δ 13 CTOC increases to to 3.02 m) but a more gradual increase in δ 13 CTOC values
a value of −26.2 ‰ (at 12.9 m) and attains an average of (1δ 13 CTOC = +2.1 ‰ within 0.52 m of section; 12.41 to
δ 13 CTOC = −26.20 ± 0.43 ‰ (n = 18, 12.9 to 15.8 m), very 12.93 m). The major shift in δ 13 CTOC occurs entirely within
similar to the pre-excursion δ 13 CTOC values in the 0–2.9 m the lignite seam with uniform %TOC, virtually unaffected
part of the section. by marine influences at this stratigraphic level as indicated
Overall, the δ 13 CTOC data show four conspic- by rather abrupt lithological transitions on a centimeter–
uous shifts across the record (Fig. 2b): the basal decimeter scale (see Sect. SI1) and defined palynological
shift at 3.0 m of section to lower δ 13 CTOC values transitions between the terrestrial peat deposits to the marine
(1δ 13 CTOC, single samples at ∼3 m = −1.7 ‰) and the uppermost interbed (see Sect. 4.3). Thus, we exclude potential mixing
gradual increase between 12.4 and 12.9 m back to higher of terrestrial and marine (with generally lower δ 13 C values)
δ 13 CTOC values (1δ 13 CTOC, 12.4–12.9 m = +2.1 ‰) occur organic matter to be the main driver for the detected carbon
within individual lignite seams. Thus, these two shifts are isotope excursion.
independent of major lithological changes (Fig. 2). In con- The described CIE occurs in the two seams surrounding
trast, the δ 13 CTOC shifts at 3.9 m (1δ 13 CTOC, 3.9 m = +0.9) the clastic interbed that includes a prominent Apectodinium
and between 10.3 and 10.6 m (1δ 13 CTOC, 10.6 m = −1.3 ‰) acme (Riegel et al., 2012). This indicates significant differ-
correlate with lithological changes. Most importantly, the ences in paleoenvironmental conditions when compared to
remarkably stable δ 13 CTOC values in the central part of the the majority of marine interbeds of the Schöningen Forma-
section (3.9 to 10.6 m) are restricted to the clastic Interbed 2 tion that lack abundant Apectodinium spp. Thus, the detected
deposited under marine conditions. Omitting these marine CIE is very likely associated with carbon cycle perturbation
samples (with %TOC < 10 %) indicates that the low δ 13 CTOC during an early Paleogene hyperthermal. At present, how-
values smoothly tie between Seam 1 and Seam 2 with an ever, we cannot unequivocally assign the Schöningen CIE to
average value of −27.68 ± 0.43 ‰, whereas δ 13 CTOC values the PETM or the ETM2.
in the shallow marine sediments (Interbed 2) are ∼ 0.7 ‰
higher. Higher δ 13 CTOC values in the clastic interbed may be
surprising at first as marine organic matter is generally more
www.clim-past.net/15/1741/2019/ Clim. Past, 15, 1741–1755, 2019
1746                                                  K. Methner et al.: Paleoenvironmental response of midlatitudinal wetlands

Figure 3. Comparison of midlatitudinal wetland δ 13 CTOC records surrounding the paleo-North Sea (see Fig. 1): (a) carbon isotopic dif-
ferences at the onset of the CIE, (b) Vasterival, France (Storme et al., 2012), (c) Cobham, UK (Collinson et al., 2003), (d) Schöningen,
Germany (this study: green symbols; Inglis et al., 2015: grey symbols). Note the different stratigraphic thicknesses due to different sediment
accumulation and preservation conditions in the individual depositional environments.

4.2    The magnitude of the CIE in European lignite                      the Vasterival section (France) (Garel et al., 2013; Storme
       records                                                           et al., 2012) that were both assigned to the PETM. Interest-
                                                                         ingly, all three lignite deposits share characteristic features
Even though the magnitudes of the CIE vary widely among                  (Table 1; Figs. 3 and 4).
proxy records across the PETM and to a lesser extent across                1. Absolute δ 13 CTOC values and the range in δ 13 CTOC val-
the ETM2 event (see McInerney and Wing, 2011; Sluijs and                      ues (∼ 3.2 ‰) are very similar (Fig. 3 and Table 1).
Dickens, 2012), the Schöningen CIE is small given the gen-
erally large CIE in bulk organic carbon in terrestrial settings            2. All three records attain similar minimum δ 13 CTOC val-
(McInerney and Wing, 2011). Terrestrial CIEs related to the                   ues during the CIE (−27.5 ‰ to −28.8 ‰), averaging
PETM are commonly enhanced by ∼ 1 ‰–3 ‰ compared to                           28.05 ± 0.5 ‰ (Fig. 4).
those inferred from marine organic matter (typically in the
range of −2 ‰ to −3 ‰; e.g., Cramer and Kent, 2005; McIn-                  3. At the onset of the CIE the magnitude of changes in
erney and Wing, 2011; Sluijs and Dickens, 2012) and the                       δ 13 CTOC (calculated as the difference between the last
same may apply for the terrestrial expression of the ETM2.                    pre-CIE value and the first CIE value) ranges only be-
Thus, it may be questioned whether the reduced magnitude                      tween −1.4 ‰ and −1.8 ‰ (Fig. 3).
of the CIE at Schöningen is unique due to (1) local condi-                 4. Magnitudes of the CIE in bulk organic matter calcu-
tions and can actually be related to the PETM, (2) repre-                     lated as the difference between the mean pre-CIE and
sents another early Eocene hyperthermal, or (3) is an inde-                   the mean CIE values range from −0.9 ‰ to −1.6 ‰.
pendent feature of midlatitudinal European near-coastal en-                   CIEs calculated as the difference between the mean pre-
vironments.                                                                   CIE values and the most negative value during the CIE
   In order to address this question, we compare our δ 13 CTOC                (following McInerney and Wing, 2011; see Fig. 4) yield
record and the adjacent Schöningen record of Inglis et                        magnitudes of −1.1 ‰ to −2.3 ‰ (Table 1).
al. (2015) with published peat mire records along the paleo-
North Sea coastline (Fig. 1), namely the Cobham Lignite                    Even though suggestive, these similarities do not provide
(UK) (Collinson et al., 2003, 2009; Pancost et al., 2007) and            unequivocal evidence that the Schöningen CIE reflects the

Clim. Past, 15, 1741–1755, 2019                                                                       www.clim-past.net/15/1741/2019/
K. Methner et al.: Paleoenvironmental response of midlatitudinal wetlands 1747
Table 1. Compilation of δ 13 CTOC datasets from European lignite deposits.
Record Min. and max. δ 13 C range CIE onsetb CIE magnitude CIE magnitude Reference
δ 13 C value of (‰) (‰) (“mean–mean”)c (“mean–most
each record (‰) negative”)d
(‰)
Schöningen (D) −25.06 to −28.29 3.23 −1.66 −1.26 −1.53 this study
Schöningen (D) −25.95 to −27.65 1.70 −0.68 −0.92 −1.11 Inglis et al. (2015)
Cobham (UK) −24.47 to −27.50 3.03 −1.40 −1.60 (−1.16)e −1.97 (−1.53)e Collinson et al. (2003)
Vasterival (F) −25.4 to −28.8a 3.4 −1.8 −1.5 −2.3 Storme et al. (2012)
a Exact data are not given in the paper but are manually extracted from the published figure. b CIE onset is calculated as the difference between the last pre-CIE and the first
CIE sample. c CIE magnitude calculated as the difference between the mean pre-CIE and the mean CIE value. d CIE magnitude calculated as the difference between the mean
pre-CIE and the most negative value of the CIE (following McInerney and Wing, 2011). e CIE magnitude omitting the described increase in δ 13 CTOC at the basal part of the
Cobham record (Collinson et al., 2003) and only taking the last six samples prior to the onset of the CIE as a reference.
tion of the CIE, the average magnitude is −1.27 ± 0.29 ‰
(“mean–mean”) or −1.74 ± 0.46 ‰ (“mean–most negative
value”). The average decrease in δ 13 CTOC values at the onset
of the CIE is −1.39 ± 0.43 ‰ (Table 1). There are multiple
possibilities to explain the dampened magnitude in these de-
posits, such as mixing and dilution of the input signal, oc-
currence of local signal perturbation (e.g., due to vegetation
changes), or the differential degradation and/or preservation
of organic matter during the climatic perturbation.
Mixing and dilution of the CIE in the Schöningen es-
tuarine depositional context, where multiple flooding and
thus reworking events may have occurred, appear unlikely
as the observed CIE onset is sharp (i.e., between two sam-
ples within 8 cm) and within a lignite seam where no mix-
ing of sediment has been detected (see Sect. 4.1). The or-
ganic matter of the original peat likely resulted from an om-
brotrophic (rain-fed) peat mire (consisting mostly of mosses,
Figure 4. Comparison of terrestrial carbon isotope excursions
ferns, and associated hardwood mire forest; see Sect. 4.3)
(CIE). Data from plant-derived lipids (yellow) and soil organic mat- (Inglis et al., 2015; Riegel et al., 2012) and has to be regarded
ter (green) are from McInerney and Wing (2011). Data from peat- as autochthonous with transport (if any) only on very short
derived bulk organic matter are compiled from new (this study) and distances, likely meters.
published studies (Collinson et al., 2003; Inglis et al., 2015; Storme It is possible that the reduced CIE magnitude is a lo-
et al., 2012). Whereas the pre- and post-CIE values represent mean cal signal derived by changes in plant communities dur-
δ 13 C values, the CIE is given as the most negative values, following ing the associated hyperthermal. For instance, variable an-
McInerney and Wing (2011). giosperm : gymnosperm ratios caused significant variations
in the recovered δ 13 CTOC values of Miocene lignites from
Austria (Bechtel et al., 2003), and a similar scenario appears
possible at the Paleogene Schöningen locality. However, in
PETM; it may well represent another early Eocene CIE.
our pollen record we do not observe particular changes from
However, the similarity of the CIEs (two of them assigned
angiosperms to gymnosperms in conjunction with the CIE.
to the PETM; Collinson et al., 2003, 2009; Pancost et al.,
Similar to the Schöningen record, the Cobham palynologi-
2007; Garel et al., 2013; Storme et al., 2012) between these
cal record lacks major changes in the paleofloral community
adjacent lignite records is striking and may argue for a quite
along with the CIE (Collinson et al., 2003, 2009). Collinson
uniform behavior of these wetlands during latest Paleocene–
et al. (2009) found only subtle vegetation changes across
early Eocene thermal events.
the PETM in the Cobham lignites and primarily attributed
Overall, the comparison of these geographically adjacent
these to changes in the local fire regime. In addition to this,
deposits shows that all reported CIE magnitudes of lignite
Collinson et al. (2003) also discussed the possibility that the
records along the paleo-North Sea are dampened compared
carbon isotope variability in the Cobham lignites may have
to purely continental terrestrial archives but yield a very con-
been caused by local changes in the depositional environ-
sistent and robust signal (Fig. 4). Depending on the defini-
www.clim-past.net/15/1741/2019/ Clim. Past, 15, 1741–1755, 20191748 K. Methner et al.: Paleoenvironmental response of midlatitudinal wetlands ment, the preservation states, or the plant communities but at ues of hopanes at the top of Seam 1, coinciding with the po- the same time excluded those mechanisms because the major sition of our detected CIE, may indicate slight changes in shift in the carbon isotope values occurred without any ma- the bacterial communities associated with the inferred hy- jor lithological or floral changes. These findings are similar perthermal, even though no significant warming trend based to our observations for the Schöningen lignites. on branched glycerol dialkyl glycerol tetraethers (brGDGTs) Moreover, marine sediments from the paleo-North Sea was detected here (Inglis et al., 2015, 2017). Higher-than- exhibit an enhanced CIE of 6 ‰–8 ‰ that has been ex- expected δ 13 CTOC values during the CIE relative to pre- plained by increased terrigenous input (Heilmann-Clausen CIE values could result from enhanced microbial degrada- and Schmitz, 2000; Schmitz et al., 2004; Sluijs and Dickens, tion processes and changed microbial communities that de- 2012). Land-plant-derived δ 13 C values of n-alkanes from compose more 13 C-depleted recalcitrant matter. Generally two sections of the paleo-North Sea (Denmark) record a enhanced respiration rates and changes in the microbial com- decrease of 4 ‰–7 ‰ (Schoon et al., 2015), clearly show- munities due to warming (and wetting) are also likely to ap- ing that the PETM affected the biosphere around the paleo- pear on a regional scale and are thus consistent with our find- North Sea in terms of recording the CIE. However, Schoon ing of generally reduced CIEs in peat mires along the paleo- et al. (2015) also noted that the differences in the CIE likely North Sea. arose from local differences in the plant communities or precipitation patterns. Taken together, we think that a local change in vegetation, altering the carbon isotope “input sig- 4.3 Environmental changes in the Schöningen peat mire nal” to the peat mires, is unlikely to account for the reduced CIE in the Schöningen lignites. The repeated change from open-estuary or marine to An alternative scenario is differential degradation and/or meandering-river and peat mire environments is characteris- preservation of organic matter in the Schöningen peat mires tic for the Schöningen Formation and continues even into the during a hyperthermal event. Carbon isotope discrimination middle Eocene Helmstedt Formation (Fig. 1b) (Riegel et al., between litter input and stored (soil) organic matter during 2012, 2015). We extended our palynological dataset down- degradation or decomposition is governed by fractionation section to the underlying Interbed 1 and Main Seam in order processes during metabolism (typically enriching the resid- to disentangle the effects of transgressions or regressions in ual carbon stock in 13 C) and the selective utilization of com- the coastal setting, which were governed by an interplay of pounds (with differing δ 13 C values) (e.g., Santruckova et al., eustatic sea level changes, withdrawal of salt towards the salt 2000). The latter process apparently dominates and can either wall, and/or changes in precipitation and subsequent runoff enhance or suppress a metabolism-related fractionation sig- from the direct effects of climate perturbation during the po- nal (Santruckova et al., 2000). Minor warming of ∼ 1 ◦ C can tential hyperthermal associated with the CIE. cause significant increases in carbon respiration rates in mod- During the late Paleocene and early Eocene, mire forests, ern high-latitude peatlands (on average by 52 % in spring to typical for coastal areas along the edge of the paleo-North 60 % in summer; Dorrepaal et al., 2009). Contemporaneous Sea basin, existed in the area of Schöningen (e.g., Allen, to the increased respiration rates, an increase in the carbon 1982; Willumsen, 2004; Collinson et al., 2009). As inferred isotope ratios of the respired CO2 has been interpreted as a from pollen records they consisted essentially of wet swamp shift towards respiration of less 13 C-depleted carbon stocks, forests dominated by Nyssaceae and Cupressaceae s.l. and likely due to a change in microbial communities. drier hardwood mire and background forests characterized Even though the paleoenvironmental setting of the Paleo- by Fagaceae and Myricaceae or Betulaceae (Riegel et al., gene peat mire clearly differs from the modern high-latitude 2012, 2015). Three groups of palynomorphs can be distin- mires (Dorrepaal et al., 2009), it seems likely that warming guished (Fig. 5): (1) taxa that occur throughout the entire related to a hyperthermal generally affected peat mires by in- succession but with frequency maxima in the Interbeds 1 and creasing respiration rates and causing changes in the micro- 2 such as pollen of Cupressaceae s.l. (Inaperturopollenites bial community. This could have resulted in specific changes spp., Cupressacidites sp.), Fagaceae or Leguminosae (Tri- in the δ 13 C values of the respired and residual carbon stocks colpopollenites liblarensis), Fagaceae (Tricolporopollenites in peatlands. Indeed, Pancost et al. (2007) attributed the shift cingulum), or Myricaceae-Betulaceae (Triporopollenites ro- in δ 13 C values of hopanes, a biomarker derived from bac- bustus group); (2) taxa that are especially abundant in some teria, in the Cobham Lignite to an increase in the popula- of the interbed–lignite seam transitions, such as the jug- tion of methanotrophic bacteria and, possibly, decreased het- landaceous pollen Plicapollis pseudoexcelsus (Main Seam– erotrophic biomass in this peatland during the PETM. Thus, Interbed 1 and Interbed 1–Seam 1) and Thomsonipollenites this study documents a major shift in the microbial commu- magnificus (Interbed 2–Seam 2 and to a lesser extent Main nity across the PETM (Pancost et al., 2007). Hopane data Seam–Interbed 1) (the latter with unknown botanical affin- from Schöningen have been interpreted in terms of a gener- ity); and (3) taxa that are strictly confined to lignite seams, ally mixed methanotrophic and heterotrophic bacterial popu- e.g., spores of peat mosses (Sphagnaceae) or spores of poly- lation (Inglis et al., 2015). The decreasing trend in δ 13 C val- podiaceous ferns. Clim. Past, 15, 1741–1755, 2019 www.clim-past.net/15/1741/2019/
K. Methner et al.: Paleoenvironmental response of midlatitudinal wetlands                                                           1749

Figure 5. Simplified pollen diagram of the top of the Main Seam up to the top of Seam 2, showing frequency and palynological abundance
changes between pre-, peak-, and post-CIE intervals. The carbon isotope data are shown for comparison. Due to the different thicknesses
of the sections (see Fig. 2), it has been tied to the top and base of Seam 1 and the top and base of Seam 2. The red bar indicates the
carbon isotope excursion. The palynological record is characterized by three palynological groups: (1) elements with frequency maxima
in the clastic interbeds (representing the hinterland), (2) interbed–lignite seam transitional elements and back mangrove equivalents, and
(3) elements dominating the lignite seams.

   The separation of samples based on the dominance of one             are considered to have grown on better-drained, remote mire
of these three palynomorph groups is reflected by the NMDS             areas and are therefore less affected by sea level fluctuations
of the palynomorph data (Fig. 6a). Samples from Seams 1                (Riegel et al., 2012).
and 2 plot on the left side of NMDS axis 1 in the ordina-                 Floral successions at marine interbed–lignite transitions
tion space, clearly separated from interbed samples that plot          at Schöningen differ significantly from those of the middle
on the right side of the ordination space. This indicates the          Eocene Helmstedt Formation in nearly lacking pollen of the
completely different palynological composition of interbed             tropical mangrove elements Rhizophora, Avicennia, Nypa,
and lignite samples with the dominance of fagaceous and                and Psilodiporites of unknown botanical affinity (Lenz,
myricaceous or betulaceous pollen in the interbeds and of              2005; Lenz and Riegel, 2001; Riegel et al., 2012, 2015;
spores of peat mosses and polypodiaceous ferns in the lig-             this study). Instead, transitions at Schöningen are character-
nites (Fig. 6a, b). Samples from the Main Seam plot in the             ized by Thomsonipollis magnificus, Pistillipollenites mcgre-
center of the NMDS ordination space, indicating that there             gorii (Figs. 5 and 6), Plicapollis pseudoexcelsus, and Pom-
are slight compositional differences in comparison to Seams            peckjoidaepollenites subhercynicus. The latter two are also
1 and 2. However, the samples are only from the top of the             known from the middle Eocene of the Helmstedt Forma-
Main Seam and may therefore not reflect the typical lignite-           tion (Lenz and Riegel, 2001). The absence of tropical man-
forming vegetation as recorded in Seams 1 and 2 but more               grove elements, especially Nypa, has been interpreted as
the vegetation of lignite–interbed transitions.                        indicating extratropical conditions during the deposition of
   The fagaceous pollen T. liblarensis and T. cingulum ap-             the Schöningen Formation in contrast to the true tropical
pear to be essentially confined to the CIE (9–14 m in Fig. 5).         conditions during the middle Eocene (Helmstedt Formation)
However, when compared with the older part of the succes-              (Riegel et al., 2012).
sion (0–6 m in Fig. 5), these taxa appear more frequently in              Spores of Sphagnaceae (peat mosses) and polypodiaceous
the marine interbeds. Presumably, with the rise of the sea             ferns are typical lignite-related elements throughout much of
level the respective forests shifted landward and the small            the Schöningen Formation and often dominate the palyno-
wind-transported fagaceous pollen became enriched in the               logical assemblages (Figs. 5 and 6; Inglis et al., 2015; Riegel
interbeds at this site. For the same reason, pollen of the Cu-         and Wilde, 2016; Riegel et al., 2012). The frequent and close
pressaceae s.l., indicative of a swamp forest, occur more fre-         association of these spores (Sphagnumsporites spp., Distan-
quently in the marine interbeds. Myricaceae- or Betulaceae-            corisporis sp., Tripunctisporis sp., Laevigatosporites spp.)
dominated forests as represented by T. robustus-group pollen           with charcoal horizons is characteristic for Seam 1 and Seam

www.clim-past.net/15/1741/2019/                                                                     Clim. Past, 15, 1741–1755, 2019
1750                                                      K. Methner et al.: Paleoenvironmental response of midlatitudinal wetlands

                                                                            This Sphagnum-free interval coincides with the range of the
                                                                            detected Schöningen CIE and could potentially reflect a re-
                                                                            sponse to the CIE-related climate perturbation. However, a
                                                                            similar distribution pattern of Sphagnum spores has been ob-
                                                                            served in the lower part of Seam 1 (Fig. 5 and Inglis et al.,
                                                                            2015) as well as in the Main Seam (Hammer-Schiemann,
                                                                            1998), suggesting that the return of peat mosses is typical for
                                                                            post-fire successions of peat-forming mires following marine
                                                                            incursions at Schöningen. Even though Storme et al. (2012)
                                                                            reported dry–wet cycling across the late Paleocene and early
                                                                            Eocene with rather dry conditions during the main part of the
                                                                            CIE at Vasterival (France), we exclude overall drying as the
                                                                            cause of suppressed proliferation of Sphagnaceae at Schönin-
                                                                            gen. Similar to the Cobham Lignite (Collinson et al., 2003),
                                                                            waterlogged conditions are indicated at the top of Seam 1 by
                                                                            the presence of freshwater phytoplankton and confirmed by
                                                                            multiple biomarker analyses (Inglis et al., 2015). Regional
                                                                            proxy records indicate increased terrestrial runoff during the
                                                                            warmth of the PETM (Bornemann et al., 2014; Heilmann-
                                                                            Clausen and Schmitz, 2000; Schmitz and Pujalte, 2003), con-
                                                                            sistent with climate model outputs that show generally in-
                                                                            creased but also more variable rainfall during the PETM
                                                                            (e.g., Carmichael et al., 2016, 2017). Therefore, either in-
                                                                            creased nutrient inputs to the mire and/or climatic changes
                                                                            during the PETM or the subsequent early Eocene hyperther-
                                                                            mals may have restrained the proliferation of Sphagnaceae
                                                                            and promoted the spread of higher plants (e.g., Cupressaceae
                                                                            s.l. and parent plants of T. cingulum and T. liblarensis).
                                                                               Compared to other Paleocene and early Eocene palyno-
                                                                            logical records in the North Sea basin, which indicate signif-
                                                                            icant vegetation changes due to short-lived climate perturba-
                                                                            tions such as the PETM (e.g., Beerling and Jolley, 1998; El-
                                                                            drett et al., 2014), our palynological data indicate only minor
                                                                            changes in plant taxa associated with the detected CIE. This
                                                                            is confirmed by NMDS, which shows that there are no major
                                                                            changes in the composition of the palynological assemblages
                                                                            when comparing Seams 1 and 2 as well as Interbeds 1 and 2,
                                                                            as both lignite samples and interbed samples overlap in the
Figure 6. Nonmetric multidimensional scaling (NMDS) of palyno-
                                                                            ordination space of the NMDS (Fig. 6b). Furthermore, com-
logical data from the Schöningen Formation, comprising 59 sam-
                                                                            parison of post-CIE with pre-CIE (Seam 1) samples as well
ples from the top of the Main Seam up to the top of Seam 2, using
the Bray–Curtis dissimilarity and the Wisconsin double standard-            as comparison of CIE with pre-CIE (Interbed 1) samples re-
ized raw data values. (a) Scatter plot of the first two axes showing        veals no significant differences in the composition of the pa-
the arrangement of samples and taxa. The different symbols repre-           lynomorph assemblages (Fig. 6c). Therefore, long-term envi-
sent samples of the different lithological units. (b) Scatter plot of the   ronmental records are needed to identify whether plant com-
first two axes showing the arrangement of samples with frames that          munity changes were forced by (1) lithological or environ-
indicate different lithological units in the succession. (c) Scatter plot   mental changes, (2) (hyperthermal-related) climate changes,
of the first two axes showing the arrangement of samples separated          or (3) a combination of both. Hitherto, changes in plant com-
by different symbols in pre-, peak-, and post-CIE samples.                  munities at Schöningen seem to follow natural successions at
                                                                            marine–terrestrial interfaces rather than climatic patterns.

2 and has been interpreted as the secondary vegetation suc-                 4.4   Schöningen in relation to other European lignite
ceeding forest fires (Hammer-Schiemann, 1998; Riegel et al.,                      records
2012; Inglis et al., 2015; Robson et al., 2015). Sphagnum
spores sharply decline at the top of Seam 1 and reappear                    In order to place our paleoenvironmental observations in a re-
with considerable delay in Seam 2 (above 13.2 m in Fig. 5).                 gional framework, we compare the Schöningen record with

Clim. Past, 15, 1741–1755, 2019                                                                       www.clim-past.net/15/1741/2019/
K. Methner et al.: Paleoenvironmental response of midlatitudinal wetlands 1751
the nearby lignite sites of Cobham (UK) and Vasterival (F) 5 Summary and conclusion
in which the reported CIEs have been assigned to the PETM,
even though we cannot ensure (or exclude) that these records Bulk organic carbon isotopic and palynological data from
are time equivalent and represent the same hyperthermal. an alternating succession of lignite and clastic deposits in
However, we feel that such a comparison is still valuable in the basal Schöningen Formation (Germany) show a nega-
order to detect similar behaviors of these Paleogene wetlands tive CIE (1δ 13 CTOC = −1.7 ‰) and an Apectodinium acme.
during carbon cycle perturbations. Our CIE record highlights the fact that the interval of highest
In the Cobham Lignite record minor qualitative changes fire frequency in the Schöningen Formation (Seam 1; Rob-
among plant species contrast with major changes in the com- son et al., 2015) is clearly associated with the carbon ex-
position of plant communities across the PETM onset, which cursion. These characteristics together with the available age
includes the disappearance of ferns and the increase in cu- constraints for the formation do not allow for a robust cor-
pressaceous conifers (Collinson et al., 2003, 2009). This is relation with a particular Paleocene–early Eocene hyperther-
similar to Schöningen, where the disappearance of ferns prior mal, but they do not exclude the possibility that this CIE is
to the onset of the CIE is followed by a similarly high but related to the PETM. Paleofloral changes related to the CIE
more fluctuating occurrence of Cupressaceae during the CIE. time interval are minor and most changes follow natural suc-
However, such a fluctuation of Cupressaceae can be seen cessions. Thus, only long-term environmental records appear
throughout the whole record (Fig. 5). suitable to distinguish if plant communities changed due to
Strikingly similar at both localities, Schöningen and Cob- (1) lithological or environmental changes, (2) climate change
ham, is the high abundance of charcoal prior to the detected associated with the CIE, or (3) a combination of both.
CIEs. At Cobham, this charcoal is in close association with Tentative comparison with the δ 13 CTOC records of nearby
abundant fern spores and is most likely derived from a sec- peat mire records along the paleo-North Sea coastline (Cob-
ondary vegetation succeeding wildfires at the onset of the ham, UK; Vasterival, F) that have been associated with the
PETM (Collinson et al., 2003, 2009). At Schöningen, a high PETM shows that the carbon isotopic composition of these
abundance of charcoal occurs in Seam 1 and Seam 2 (Riegel lignites yields a reduced, compared to marine or other ter-
et al., 2012; Robson et al., 2015) with particularly high char- restrial archives, but consistent CIE with a magnitude of
coal contents in the upper part of Seam 1 compared to its ∼ −1.3 ‰ that appears to be a robust regional signal along
base (Inglis et al., 2015; Robson et al., 2015). This increase coastal sites of the paleo-North Sea.
in fire intensity immediately precedes the CIE. Evidence for Common features of the Schöningen and the Cobham Lig-
a high frequency of wildfires from Schöningen and Cobham nite records emerge, such as a similar CIE, similar paleo-
prior to the reported CIEs is compatible with the possibility floral successions, and drowning of peat mires during the
that the Schöningen CIE could be related to the PETM and major body of the CIE. Furthermore, both records yield ev-
the hypothesis that peat burning was an important trigger for idence of increased fire activity, such as increased charcoal
the CIE (Kurtz et al., 2003; Moore and Kurtz, 2008). contents in combination with the appearance of ferns and
Another common characteristic of the lignite records at peat mosses prior to the CIE. Overall, the similarities be-
Schöningen, Cobham, and Vasterival is drowning of the tween these Paleogene–Eocene European wetland records
peat mires just subsequent to the onset of the detected CIE are striking and it can be hypothesized that they either repre-
(Collinson et al., 2003; Garel et al., 2013; this study; Brandes sent the same hyperthermal or that different Paleocene–early
et al., 2012; Riegel et al., 2012). If the CIE in the Schönin- Eocene carbon cycle perturbations and associated hyperther-
gen record is associated with the PETM, the global trans- mals had similar effects on midlatitudinal wetlands along the
gressional phase (e.g., Sluijs et al., 2011) likely resulted in paleo-North Sea.
the deposition of the marine clastic Interbed 2 at Schönin-
gen during much of the PETM (Fig. 2). The return of the
Schöningen peat mire (Seam 2) may have been caused by a Data availability. All shown and discussed data are available in
decrease in the thermal expansion of the ocean and a con- the Supplement.
comitant global regression during cessation of the PETM. At
the same time, increased sediment supply from the hinterland
Sample availability. Samples are stored in the Senckenberg col-
during the PETM (e.g., Bornemann et al., 2014; Heilmann-
lections and are available upon request.
Clausen and Schmitz, 2000) filled the available accommoda-
tion space. Any subsequent Eocene hyperthermal may have
resulted in a similar behavior.
Supplement. The supplement related to this article is available
online at: https://doi.org/10.5194/cp-15-1741-2019-supplement.
www.clim-past.net/15/1741/2019/ Clim. Past, 15, 1741–1755, 20191752 K. Methner et al.: Paleoenvironmental response of midlatitudinal wetlands
Author contributions. WR, VW, and AM designed the study. Shrivastava, P. K., Sugisaki, S., Tuo, S., van de Flierdt, T., Welsh,
KM composed the paper. KM and AM conducted the geochemi- K., and Yamane, M.: Eocene cooling linked to early flow across
cal analyses and evaluated the results. WR, VW, and OL provided the Tasmanian Gateway, P. Natl. Acad. Sci. USA, 110, 9645–
sample material and regional geological expertise, as well as con- 9650, 2013.
ducting palynological analyses. All authors edited the final version Bornemann, A., Norris, R. D., Lyman, J. A., D’Haenens, S., Groen-
of this paper. eveld, J., Röhl, U., Farley, K. A., and Speijer, R. P.: Persistent en-
vironmental change after the Paleocene–Eocene Thermal Maxi-
mum in the eastern North Atlantic, Earth Planet. Sc. Lett., 394,
Competing interests. The authors declare that they have no con- 70–81, 2014.
flict of interest. Brandes, C., Pollok, L., Schmidt, C., Wilde, V., and Winsemann, J.:
Basin modelling of a lignite-bearing salt rim syncline: insights
into rim syncline evolution and salt diapirism in NW Germany,
Acknowledgements. Olaf Lenz acknowledges support through Basin Res., 24, 699–716, 2012.
DFG LE 2376/4-1. We further thank Karin Schmidt for valuable Bray, J. R. and Curtis, J. T.: An ordination of the upland forest com-
field support and Jens Fiebig, Sven Hofmann, and Ulrich Treffert munities of southern Wisconsin, Ecol. Monogr., 27, 326–349,
for technical assistance. Gordon Inglis kindly supplied his original 1957.
δ 13 C dataset for the top of Seam 1. We are grateful to the Helm- Broothaerts, N., Verstraeten, G., Kasse, C., Bohncke, S., Note-
stedter Revier of MIBRAG (formerly BKB and later EoN) for ac- baert, B., and Vandenberghe, J.: Reconstruction and semi-
cess to the sections and technical assistance in the field. We thank quantification of human impact in the Dijle catchment, central
Joost Frieling and an anonymous referee for their insightful reviews Belgium: a palynological and statistical approach, Quaternary
as well as Carlos Jaramillo and Gerald Dickens for their comments Sci. Rev., 102, 96–110, 2014.
that helped to significantly improve this paper. Bujak, J. P. and Brinkhuis, H.: Global warming and dinocyst
changes across the Paleocene/Eocene Epoch boundary, in: Late
Paleocene–early Eocene climatic and biotic events in the marine
and terrestrial records, edited by: Aubry, M.-P., Lucas, S. G., and
Financial support. This research has been supported by the
Berggren, W. A., Columbia University Press, New York, 277–
Deutsche Forschungsgemeinschaft (grant no. LE 2376/4-1).
295, 1998.
Carmichael, M. J., Lunt, D. J., Huber, M., Heinemann, M., Kiehl,
The publication of this article was funded by the
J., LeGrande, A., Loptson, C. A., Roberts, C. D., Sagoo, N.,
Open Access Fund of the Leibniz Association.
Shields, C., Valdes, P. J., Winguth, A., Winguth, C., and Pan-
cost, R. D.: A model–model and data–model comparison for
the early Eocene hydrological cycle, Clim. Past, 12, 455–481,
Review statement. This paper was edited by Julie Loisel and re- https://doi.org/10.5194/cp-12-455-2016, 2016.
viewed by Joost Frieling and one anonymous referee. Carmichael, M. J., Inglis, G. N., Badger, M. P. S., Naafs, B. D.
A., Behrooz, L., Remmelzwaal, S., Monteiro, F. M., Rohrssen,
M., Farnsworth, A., Buss, H. L., Dickson, A. J., Valdes, P. J.,
References Lunt, D. J., and Pancost, R. D.: Hydrological and associated bio-
geochemical consequences of rapid global warming during the
Ahrendt, H., Köthe, A., Lietzow, A., Marheine, D., and Ritzkowski, Paleocene-Eocene Thermal Maximum, Global Planet. Change,
S.: Lithostratigraphie, Biostratigraphie und radiometrische 157, 114–138, 2017.
Datierung des Unter-Eozäns von Helmstedt (SE-Niedersachsen), Christensen, T. R., Ekberg, A., Ström, L., Mastepanov, M., Panikov,
Zeitschrift der Deutschen Geologischen Gesellschaft, 146, 450– N., Öquist, M., Svensson, B. H., Nykänen, H., Martikainen, P. J.,
457, 1995. and Oskarsson, H.: Factors controlling large scale variations in
Allen, L. O.: Palynology of the Palaeocene and early Eocene of the methane emissions from wetlands, Geophys. Res. Lett., 30, 67,
London Basin, PhD, University College London, 1982. https://doi.org/10.1029/2002GL016848, 2003.
Bechtel, A., Gruber, W., Sachsenhofer, R. F., Gratzer, R., Lücke, Collinson, M., Hooker, J., and Grocke, D.: Cobham lignite bed
A., and Püttmann, W.: Depositional environment of the Late and penecontemporaneous macrofloras of southern England: A
Miocene Hausruck lignite (Alpine Foreland Basin): insights from record of vegetation and fire across the Paleocene-Eocene Ther-
petrography, organic geochemistry, and stable carbon isotopes, mal Maximum, Special Papers-Geological Society of America,
Int. J. Coal Geol., 53, 153–180, 2003. 333–350, 2003.
Beerling, D. J. and Jolley, D. W.: Fossil plants record an at- Collinson, M. E., Steart, D. C., Harrington, G. J., Hooker, J. J.,
mospheric CO2 and temperature spike across the Palaeocene- Scott, A. C., Allen, L. O., Glasspool, I. J., and Gibbons, S. J.:
Eocene transition in NW Europe, J. Geol. Soc. London, 155, Palynological evidence of vegetation dynamics in response to
591–594, 1998. palaeoenvironmental change across the onset of the Paleocene-
Bijl, P. K., Bendle, J. A. P., Bohaty, S. M., Pross, J., Schouten, Eocene Thermal Maximum at Cobham, Southern England,
S., Tauxe, L., Stickley, C. E., McKay, R. M., Rohl, U., Olney, Grana, 48, 38–66, 2009.
M., Sluijs, A., Escutia, C., Brinkhuis, H., Klaus, A., Fehr, A., Cramer, B. S. and Kent, D. V.: Bolide summer: The Pale-
Williams, T., Carr, S. A., Dunbar, R. B., Gonzalez, J. J., Hayden, ocene/Eocene thermal maximum as a response to an extraterres-
T. G., Iwai, M., Jimenez-Espejo, F. J., Katsuki, K., Kong, G. S., trial trigger, Palaeogeogr. Palaeoecl., 224, 144–166, 2005.
Nakai, M., Passchier, S., Pekar, S. F., Riesselman, C., Sakai, T.,
Clim. Past, 15, 1741–1755, 2019 www.clim-past.net/15/1741/2019/You can also read