Proceedings Healthy, Intelligent and Resilient Buildings and Urban Environments ibpc2018.org #ibpc2018
←
→
Page content transcription
If your browser does not render page correctly, please read the page content below
7th International Building Physics Conference

Proceedings

Healthy, Intelligent and Resilient
Buildings and Urban Environments
ibpc2018.org #ibpc2018
7th International Building Physics Conference, IBPC2018

Lighting Quality Study of Shopping Malls in China Based on the Evaluation
Experiment
Rui Dang1,*, Yanhui Bu1, Qingchen Wang1, Gang Liu1,*
1
 School of Architecture Tianjin University, Tianjin Key Laboratory of Architectural Physics
and Environmental Technology, 92 Weijin Road, Tianjin, China.
*
    Corresponding email 1: dr_tju@163.com
*
    Corresponding email 2: LGLGMIKE@163.com

ABSTRACT
The lighting environment of the shopping malls will greatly influence the customer's visual
comfort and product sales. This experiment studied the lighting environment of jewelry stores
with the highest lighting energy consumption in shopping malls. The jewelry store scene
which was built in the Key Laboratory of Building Environment Simulation had a total of 150
lighting conditions. Then, we measured lighting parameters, and subjective evaluation of
lighting quality (including lighting comfort and commodities display effect) with 30
participants were carried out. We analyzed the experimental data to get the influence law of
lighting parameters on lighting quality. Finally, this paper introduces an emerging ensemble
learning algorithm XGBoost (extreme gradient boosting) to construct evaluation models of
multiple lighting parameters for lighting quality in jewelry stores, which were verified to have
good accuracy. It is of great significance to save energy on the basis of ensuring the lighting
quality of the shopping malls.

KEYWORDS
Jewellery stores, Lighting quality, Experimental study, XGBoost, Evaluation model

INTRODUCTION
With the development of economy in China, the increasing number of shopping malls have
very high requirements for visual comfort of the indoor light environment, resulting in high
energy consumption (Hou et al. 2016). However, visual comfort of shopping malls is poor due
to incomplete lighting design standards (MOHURD 2013); lighting in shopping malls
accounts for 30%-40% of total energy consumption, so energy conservation has become an
urgent problem (Xu et al. 2013; Lowry 2016). Because the establishment of the light
environment index system is based on human subjective feelings, the impact mechanism of
different spatial and lighting parameters on visual comfort is studied through evaluation
experiments and parameter analysis. And to build the lighting evaluation model is the main
means to solve the above problems, but there are still some problems in the current studies:

(1) In the aspect of evaluation experiments, there are mainly three kinds of research methods:
a) The evaluation experiment in real buildings can not change lighting parameters. Therefore,
it is difficult to obtain the influence rules to establish an index system (Jin et al. 2017;
Ricciardi and Buratti 2018); b) Constrained by the laboratory environment, evaluation
experiments in the laboratories can not study the impact of spatial parameters (Ampenberger
et al. 2018); c) There is some controversy over using virtual reality technology to study
lighting environment (Heydarian et al. 2015; Natephra et al. 2017). (2) In the aspect of
lighting parameters analysis, regression equations were used to fit the visual comfort formula
which continuous number could be predicted. However, the sample size was usually limited,

                                             829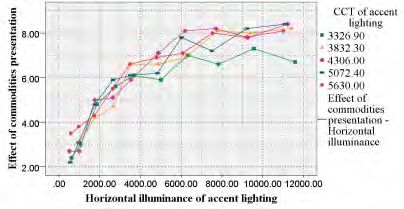
7th International Building Physics Conference, IBPC2018

and the existing methods greatly reduced the accuracy of the evaluation formula (Deng et al.
2018; Jin et al. 2017).
In order to solve the above problems, the real store scene was built in the Key Laboratory of
Building Environment Simulation to conduct an evaluation experiment; XGBoost (Hassan et
al. 2017; Urraca et al. 2017) was used to solve the classification problem of big data. Based on
this, the impact of lighting parameters on the lighting quality were studied, and lighting
evaluation models were established to ensure visual health, to improve visual comfort, and to
save lighting energy consumption, while satisfying the functions of lighting. It has important
scientific and practical significance for achieving a healthy, comfortable and energy-saving
light environment of shopping malls.

METHODS
Experimental setup
We designed and built the Key Laboratory for building light environment simulation in
Tianjin University, which is biggest and high performance in Asia (Figure 1). The plan, the
height and all the luminaires of the laboratory can be adjusted. Therefore, the light
environment of various architectural spaces can be restored and monitored in the laboratory.

                                     a)                  b)

Figure 1. Key Laboratory of Building Environment Simulation. a) Exterior, b) Interior.

The jewelry stores with the highest lighting energy consumption in the shopping malls were
selected as the research object, and the jewelry store experiment scene was set up in the
laboratory (Figures 2). 12 downlights (Dimension: ∮282*H130; Beam angle: 120°; Power:
60w) embedded in the ceiling were as ambient lighting; 12 spotlights (Dimension: ∮
158*H100mm; Light source: LED; Beam angle: 24°; Power: 30w) embedded in the crane
span structure and the strip light (Dimension: W39*H9mm; Light source: LED (SMT 2835);
Beam angle: 110°; Power: 12w) in the counters were as accent lighting. The luminous flux
and CCT (correlated color temperature) of all luminaires can be adjusted intelligently which
can constitute a large number of lighting conditions.

                 a)             b)                  c)                  d)

Figure 2. The simulated jewelry store. a) Store plan, b) Luminaire plan, c) Elevation, d) Photo.

Lighting variable setting and measurement methods
According to the standards and the field investigation, we determined the extreme values of
the variables of lighting conditions to cover most of actual conditions. In the experiment, all
luminaires were intelligently controlled to set up a total of 150 lighting conditions (Table 1).

                                             830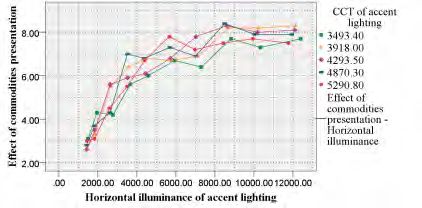
7th International Building Physics Conference, IBPC2018

Using the center-distribution method, measurement points are shown in Figure 3. And the
measurement height was 0.75m (SAC 2009). The measurement instrument was CL-500A
spectroradiometer. The stores scene without windows avoided the effect of natural light while
measuring.

Table 1. Lighting variable setting.
Lighting system         Variable      Number of levels                       Value
Ambient lighting      illuminance           3                       500 lx, 1000 lx, 1500 lx
                                                          1000 lx, 1500 lx, 2000 lx, 3000 lx, 4000 lx,
Accent lighting       illuminance           10           5500 lx, 7000 lx, 8500 lx, 10000 lx, 12000 lx
                          CCT               5              3500 K, 4000 K, 4500 K, 5000 K, 5500 K

Figure 3. Measurement points plan.       Figure 4. The process of the experiment.

Subjective lighting quality assessment
In the experimental scene of jewelry stores, a questionnaire survey (Table 2) was conducted to
subjectively evaluate 150 lighting conditions. Thirty research participants who aged 22 to 26
years (15 female and 15 male subjects) were divided into 6 groups to evaluate the randomly
disturbed lighting conditions in 5 days. In the experiment scene, participants simulated the
shopping process, fully experienced the light environment and then subjectively evaluated the
lighting quality. The experimental process is shown in Figure 4. Participants were asked to
wear eye masks to avoid interference between two lighting conditions. After evaluating every
10 lighting conditions, participants rested for 20 minutes to eliminate the effect of fatigue
experiment on the experiment results.

Table 2. Lighting quality questionnaire.
                                             Very bad          Bad            Good           Excellent
 Lighting Visual comfort                        1 2        3    4 5      6     7 8      9      10
 condition
 number Effects of commodities               Very bad          Bad            Good           Excellent
           presentation                        1    2      3     4   5    6     7 8      9     10

RESULTS
Processed experimental data and conducted preliminary analysis. 150 lighting conditions were
discussed separately in accordance with three ambient lighting conditions. In each ambient
lighting scene, CCT of the accent lighting was set in five levels. But in the actual
measurement, CCT changed due to the change of the illumination. In order to analyze the
results, the average number of CCT was obtained from the CCT which were set up as same.

The influence of lighting parameters on lighting quality
Figure 5 describes the influence of illuminance and CCT of accent lighting on visual comfort
when ambient CCT is 4000 K which is the most commonly used and ambient illuminance is
in three levels. The abscissa is horizontal illuminance of accent lighting, and the ordinate is

                                                 831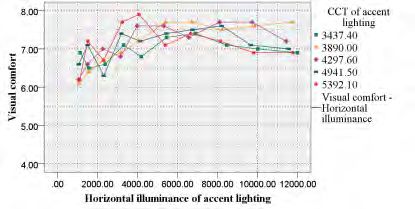
7th International Building Physics Conference, IBPC2018
the value of visual comfort. The different colored lines represent different CCT of accent
lighting. The question of visual comfort had a scale value from 1(very bad) to 10(excellent)
which greater values indicated more comfort.
As shown in Figure 5, within the range of experimental values, (1) When the ambient
illuminance is different: visual comfort increases with the increased ambient illuminance.
With the increase of ambient illuminance, visual comfort increases smaller and smaller with
increased accent illuminance. When ambient illuminance increases to more than 8000 lx,
visual comfort of some conditions begin to decrease. (2) When the ambient illuminance is the
same: visual comfort increases with the increase of illuminance, and the increase tends to be
smaller and smaller. When the accent CCT is about 4000K (medium color temperature), the
jewelry store has better visual comfort. (3) As shown in Figure 5-c, when the ambient
illuminance is 1500 lx, the reason for the special point is: the sequence of lighting conditions
to evaluate was random. The lighting condition of special point (Accentuated CCT is 5290.8K,
and accent illuminance is 10000 lx) was evaluated after the condition (Ambient illuminance is
500 lx, and the accent illuminance is 576 lx). The difference in illuminance between the two
lighting conditions is too large, causing visual discomfort.
a) b) c)
Figure 5. Influence of lighting parameters on visual comfort. a) Illuminance of ambient lighting
is 500 lx, b) Illuminance of ambient lighting is 1000 lx, c) Illuminance of ambient lighting is 1500 lx.
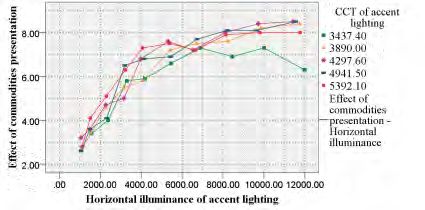
Fig. 6 describes the lighting parameters on the presentation effect of the commodities when
the ambient CCT is 4000K. The abscissa is horizontal illuminance of accent lighting, and the
ordinate is effect of commodities presentation. The scale value of presentation effect is from
1(very bad) to 10(excellent), and larger values indicate better presentation.
As shown in Figure 6, within the range of the experiment values, (1) When the ambient
illuminance is different: the ambient illuminance has small effect on the presentation effect. (2)
When the ambient illuminance is the same: the effect of commodity presentation increases
with the increased accent illumination. When the accent illuminance is greater than 10000 lx,
the presentation effect decreases or stays the same. When the accent CCT is medium
CCT(4000K) or high CCT(4000K-5600K), the presentation effect is better. Accent lighting in
low CCT in the jewelry store has poorer presentation effect.
a) b) c)
Figure 6. Influence of lighting parameters on effects of commodities presentation. a) Ambient
illuminance is 500 lx, b) Ambient illuminance is 1000 lx, b) Ambient illuminance is 1500 lx.
832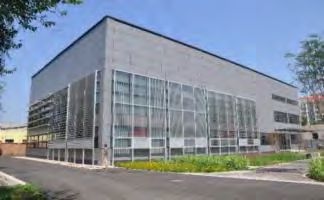
7th International Building Physics Conference, IBPC2018
Evaluation model
XGBoost is an extension of the Gradient Boosting Machine. The Boosting classifier belongs
to the ensemble learning model (Hassan et al. 2017; Urraca et al. 2017). XGBoost is widely
used in energy consumption prediction (Touzani et al. 2018; Robinson et al. 2017) and power
distribution due to its high efficiency and accuracy. This paper introduces XGBoost into the
evaluation of lighting quality in shopping malls and establishes a multi-parameter evaluation
model.
Evaluation model of visual comfort in the jewelry store
Data preprocessing was performed, the outliers of visual comfort experiment data were
removed by using an interquartile range method, and then the end points of the interval were
used as the comfort label values. We obtained the visual comfort distribution of all lighting
conditions of the jewelry store.
We used python to build an evaluation model of visual comfort in the jewelry store based on
the XGBoost ensemble learning classification algorithm. Experimental data was randomly
divided into training sets and test sets in a ratio of 4:1. And we built XGBoost classification
models on the training sets and adjusted parameters according to the classification prediction
accuracy rate of the test sets. Finally, the optimal combination of parameters are as follows:
max_depth=3, n_estimators=50, learning_rate=0.1, subsample=0.95. The prediction accuracy
rate of the model on the test sets is 0.9, which shows that the model has good generalization
ability, and the accuracy rate of the training sets is 0.942, which can effectively prevent the
model from overfitting. According to the weights, the order of features of well-trained
XGBoost model is: accent illuminance (0.3483), accent CCT (0.2780), Ra(general color
rendering index) of accent lighting (0.2161), ambient illuminance (0.1573) (Figure 7).
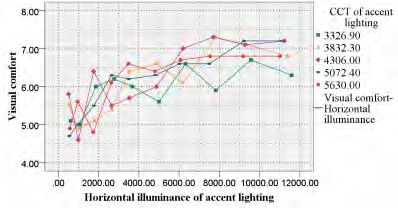
Evaluation model of commodities presentation effect in the jewelry store
Similarly, an evaluation model of product presentaition effect in jewelry store was obtained.
When ambient CCT is approximately 4000K, the order of the features is: accent illuminance
(0.5244), accent CCT (0.2502), Ra of accent lighting (0.1934) and ambient illuminance
(0.0319) according to the weights (Figure 8).
Figure 7. Weights of the features that affect visual comfort of the jewelry store. Figure 8.
Weights of the features that affect commodity presentation effect of the jewelry store.
DISCUSSIONS
In the aspect of illuminance, visual comfort and commodity display effect increase with the
increase of illuminance, but the increasing trend gradually flattens. And for the effect of
commodities display, the accent illuminance has a greater influence, and the influence of the
ambient illuminance is smaller (Figure 8). However, when the accent illuminance is greater
than 8000 lx, most of the visual comfort and display effect begin to decrease. In the aspect of
CCT, when accent CCT is about 4000K, the jewelry store has better visual comfort and
product display effect. Store lighting design should consider both sides.
When the ambient CCT is about 4000K, the well-trained XGBoost model can be used to
predict the visual comfort and the commodities display effect to guide the lighting design of
the jewelry stores. The evaluation model has the following limitation: In order to avoid the
fatigue test of participants from affecting the results, the ambient CCT is unified to the
833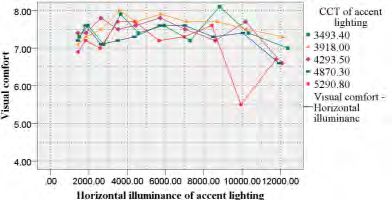
7th International Building Physics Conference, IBPC2018

commonly used value (4000 K) according to the field investigation. Therefore, this evaluation
model can not evaluate other lighting conditions except that the ambient CCT is 4000K.
CONCLUSIONS
This study proposes the influence laws of lighting parameters on lighting quality of jewelry
stores in shopping malls, and obtains an evaluation model of lighting environment in jewelry
stores. Based on advanced machine learning algorithms, the proposed model can predict and
evaluate lighting quality (visual comfort and effect of commodity display) through multiple
lighting parameters (illuminance of ambient lighting, illuminance of accent lighting, CCT of
accent lighting, and Ra of accent lighting). The results show that the model achieves an ideal
predicting accuracy. This method can be extended to lighting design in shopping malls to
improve lighting quality and to achieve energy saving.

ACKNOWLEDGEMENT
This work is funded by the National Key Research and Development Program of China
(2016YFB0601700), The National Natural Science Foundation of China (51338006); Peiyang
scholar program (1801).

REFERENCES
Hou J, et al. 2016. Comparative study of commercial building energy-efficiency retrofit
    policies in four pilot cities in China. Energy Policy, Vol. 88, pp. 204-215.
MOHURD. 2013. Standard for lighting design of buildings (GB 50034-2013). Beijing:
    Ministry of housing and Urban-Rural Development of the People’s Republic of China.
Xu P, et al. 2013. Commercial building energy use in six cities in Southern China. Energy
    Policy, Vol. 53, pp. 76-89.
Lowry, G. 2016. Energy saving claims for lighting controls in commercial buildings. Energy
    and Buildings, Vol. 133, pp. 489-497.
Jin H, et al. 2017. An evaluation of the lighting environment in the public space of shopping
    centres. Energy and Buildings, Vol. 115, pp. 228-235.
Ricciardi P. and Buratti C. 2018. Environmental quality of university classrooms: Subjective
    and objective evaluation of the thermal, acoustic, and lighting comfort conditions. Energy
    and Buildings, Vol. 127, pp. 23-36.
Ampenberger A, Staggl S, and Pohl W. 2017. Attention Guidance, Perceived Brightness and
    Energy Demand in Retail Lighting. Energy Procedia, Vol. 111, pp. 658-668.
Heydarian A, et al. 2015. Immersive virtual environments, understanding the impact of
    design features and occupant choice upon lighting for building performance. Building and
    Environment, Vol. 89, pp. 217-228.
Deng H, Fannon D, and Eckelman M.J. 2018. Predictive modeling for US commercial
    building energy use: A comparison of existing statistical and machine learning algorithms
    using CBECS microdata. Energy and Buildings, Vol. 163, pp. 34-43.
SAC. 2009. Measurement methods for lighting (GB/T 5700-2008). Beijing: Standardization
    and Ministration of the People’s Republic of China
Hassan M.A., et al. 2017. Exploring the potential of tree-based ensemble methods in solar
    radiation modeling. Applied Energy, Vol. 203, pp. 897-916.
Urraca R, et al. 2017. Estimation methods for global solar radiation: Case study evaluation of
    five different approaches in central Spain. Renewable and Sustainable Energy Reviews,
    Vol. 77, pp. 1098-1113.
Touzani S, et al. 2018. Gradient boosting machine for modeling the energy consumption of
    commercial buildings. Energy and Buildings, Vol. 158, pp. 1533-1543.
Robinson C, et al. 2017. Machine learning approaches for estimating commercial building
    energy consumption. Reviews Applied Energy, Vol. 208, pp. 889-904.

                                            834
You can also read