INTRODUCTION OF OSCAR-4 AT THE HIGH FLUX REACTOR (PETTEN)
←
→
Page content transcription
If your browser does not render page correctly, please read the page content below
EPJ Web of Conferences 247, 10029 (2021)                                                               https://doi.org/10.1051/epjconf/202124710029
PHYSOR2020

                 INTRODUCTION OF OSCAR-4 AT THE HIGH FLUX REACTOR
                                    (PETTEN)

             B. Erasmus1*, J.A. Hendriks1, A. Hogenbirk1, S.C. van der Marck1, and N.L. Asquith1
                                              1
                                             Nuclear Research and consultancy Group
                                          P.O. Box 25, 1755 ZG, Petten, The Netherlands

          erasmus@nrg.eu*, hendriks@nrg.eu, hogenbirk@nrg.eu, vandermarck@nrg.eu, asquith@nrg.eu

                                                                   ABSTRACT

                 Since 2005 the nodal diffusion based code system, OSCAR-3, was used for reactor support
                 calculations of operational cycles of the High Flux Reactor in Petten, The Netherlands.
                 OSCAR uses a two-step deterministic calculation, in which homogenized cross sections are
                 generated in lattice environments using neutron transport simulations, and then passed to a
                 nodal diffusion core simulator to model the full reactor. Limitations in OSCAR-3 led to the
                 need for improved modelling capabilities and better physics models for components present
                 in the reactor core. OSCAR-4 offers improvements over OSCAR-3 in its approach to
                 homogenization, and the new version of the diffusion core simulator allows for better
                 modelling of movable components such as control rods. Fuel inventories calculated using
                 OSCAR-4 can also easily be exported to MCNP, which allows the calculation of individual
                 plate powers and local reaction rates amongst others. For these reasons OSCAR-4 is
                 currently being introduced as a core support tool at the High Flux Reactor. In this work the
                 steps that were followed to validate the reactor models are presented, and include results of
                 validation calculations from both OSCAR-4 and MCNP6 over multiple reactor cycles. In
                 addition differences in cross section library evaluations and their impact on the results are
                 presented for the MCNP model.

         KEYWORDS: validation, nodal diffusion, OSCAR-4, MCNP

                                                            1. INTRODUCTION

         The High Flux Reactor (HFR) is extensively used for the production of a variety of isotopes, fuel testing
         and material irradiation. This means that the reactor core loading not only varies from cycle to cycle, but
         also changes during the cycle as isotope targets are loaded and unloaded during operation of the reactor.
         Contributing to the challenge of modelling the reactor accurately are the following characteristics: the
         presence of localized burnable absorbers (in the form of cadmium wires in the fuel assemblies); the fuel-
         follower design of the control rods, which sees parts of the fuel extending below the reactor; and
         increased power peaking as a result of the 17 in-core irradiation positions.

         The nodal diffusion based code system, OSCAR-3 [1], was used for core follow and core design
         calculations for each operational cycle of the HFR since 2005. OSCAR uses a two-step deterministic
         calculation, by first generating homogenized cross sections in lattice environments with neutron transport
         simulations, and then using these cross sections in a nodal diffusion core simulator. Although the
         introduction of OSCAR-3 was a major improvement at the time, the increased use of the reactor, and

  © The Authors, published by EDP Sciences. This is an open access article distributed under the terms of the Creative Commons Attribution License 4.0
  (http://creativecommons.org/licenses/by/4.0/).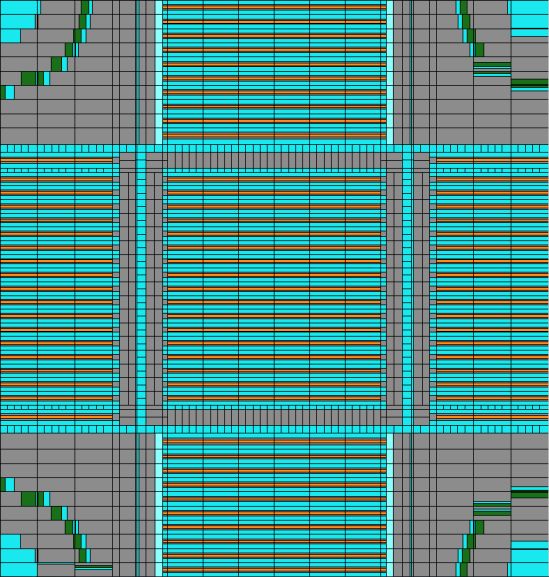
EPJ Web of Conferences 247, 10029 (2021)                                                 https://doi.org/10.1051/epjconf/202124710029
PHYSOR2020

         limitations in version three of the OSCAR software, led to the need for improved modelling capabilities
         and better physics models. The fourth version of this software, OSCAR-4 [2, 3], offers improvements
         over OSCAR-3 in its approach to homogenized cross sections, and improved physics models in the nodal
         diffusion core simulator MGRAC.

         MGRAC uses the multi-group analytic nodal method and generalized equivalence theory, to solve the
         transverse integrated 3D diffusion equation. The equivalence parameters needed by MGRAC, such as
         homogenized cross sections, discontinuity factors and flux form factors, collectively referred to as
         homogenized cross sections here, are generated in the homogenization step in the lattice calculations.
         Furthermore, this new version of MGRAC allows for the modelling of the fuel follower control elements
         to their full extent, by capturing the power and flux generated by the fuel followers below the active fuel
         section of the core. In addition, fuel inventories calculated using OSCAR-4 can easily be exported to
         create an associated MCNP model, when detailed calculations such as fuel plate power distributions and
         localized reaction rates are required for copper wires activation experiments.

         In the following sections the steps that were followed to validate the OSCAR-4 and associated MCNP6
         [4] models are described, and results of validation calculations from both models are presented for
         multiple reactor cycles.

                                             2. MODELLING APPROACH

         For the purpose of generating homogenized cross sections, Serpent-2.1.23 [5] and MCNP4C3 [6, 7] were
         used in conjunction with HEADE, the lattice code that forms part of the OSCAR-4 code system. Serpent
         and MCNP were used to generate cross sections for ex-core and in-core non-fuel components,
         respectively, while HEADE was used to generate cross sections for fueled components. Nuclear data
         libraries used with each of the transport codes during cross section homogenization are listed in Table I.
         The collection of libraries used with MCNP4C3 together make up the HFR standard library, currently
         used for routine reactor support calculations.

         At the time when these models were developed, the functionality to use microscopic burnup dependent
         cross sections from Serpent for fueled assemblies was not yet in place. This restriction can be lifted in
         future versions of the model, where Serpent can be used to generate homogenized cross sections for both
         fueled and non-fuel components. All homogenized cross sections were generated in a 7 group energy
         structure.

               Table I. Nuclear data: Transport codes and their associated libraries used during cross section
                                                    homogenization.

            Transport code                                        Nuclear data library
               HEADE                         172-group WIMS-E library, based mainly on JEFF-2.2 [8]
            Serpent-2.1.23                                      ENDF/B-VII.1 [9]
                                  ENDF/B-VI.5 [10] for most isotopes; JEFF-2.2 used for Al-27, U-235 and H bound
              MCNP4C3              in H2O; JENDL-3.3 [11] for Cadmium isotopes. (This combination of libraries is
                                                     designated as the HFR standard library)

         Fuel assemblies were homogenized with HEADE, using two different lattice environments: the first
         containing a fresh fuel element with two partially spent fuel elements on either side (see Figure 1(a)), and

                                                              2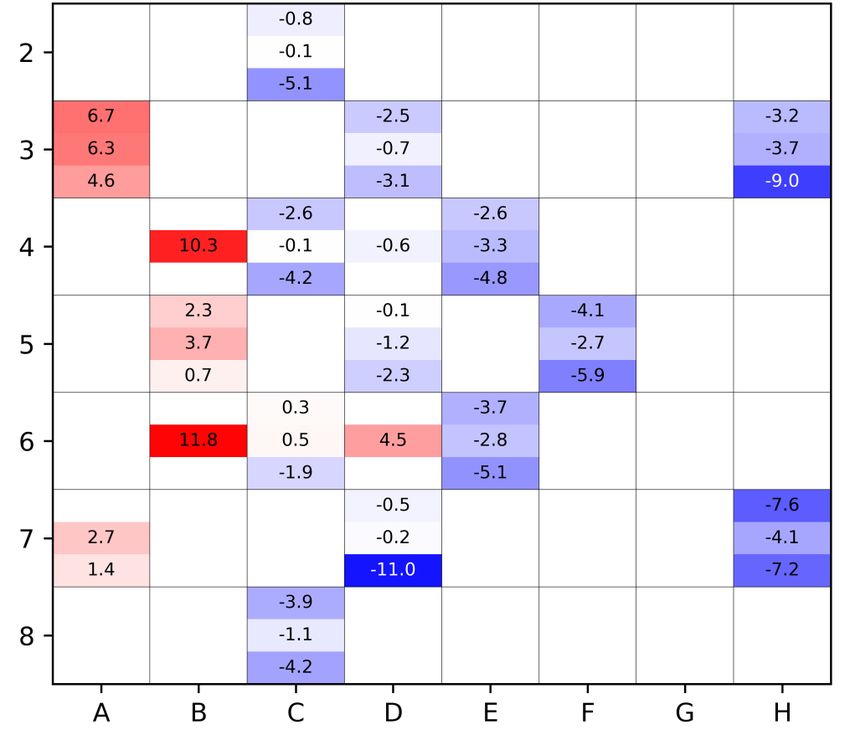
EPJ Web of Conferences 247, 10029 (2021)                                            https://doi.org/10.1051/epjconf/202124710029
PHYSOR2020

         a second lattice environment in which a representation of an in-core experiment was modelled on either
         side of the fuel assembly (see Figure 1(b)). In both lattice environments isotropic reflection was used as
         (white) boundary conditions. These two environments aim to approximate the core environment

                                      (a)                                              (b)
           Figure 1. Extended lattice environments used to generate homogenized cross sections for the fuel
                                                     assemblies.

         Homogenized cross sections for the fuel follower part of the control rods were also generated with
         HEADE, while the cross sections for the cadmium absorber part were generated with Serpent. In both
         cases, homogenized cross sections were generated in a 3x3 lattice environment shown in Figure 2(a) for
         the fuel follower section and Figure 2(b) for the cadmium absorber section.

                                (a)                                                    (b)
         Figure 2. Extended 3x3 lattice environment used to generate homogenized cross sections for the fuel
                         follower (a) and cadmium absorber section (b) of the control rods.

         In-core non-fuel component cross sections were generated using MCNP4C3, in 3x3 lattice environments
         including fuel driver zones, depending on their location in the core. These models were also used

                                                             3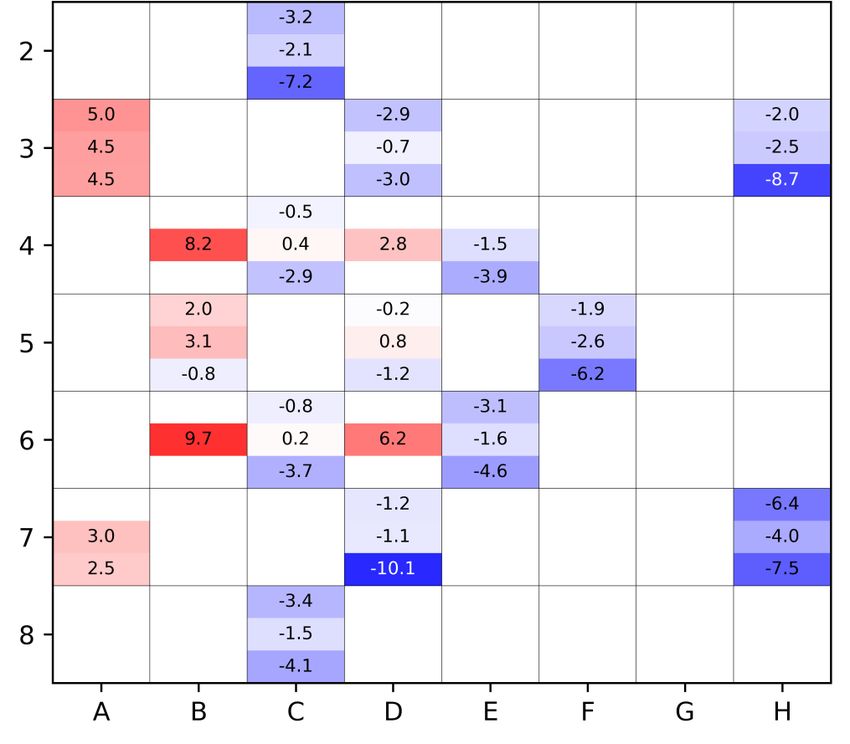
EPJ Web of Conferences 247, 10029 (2021) https://doi.org/10.1051/epjconf/202124710029
PHYSOR2020
historically with the OSCAR-3 model of the HFR, and do not include discontinuity factors. In contrast to
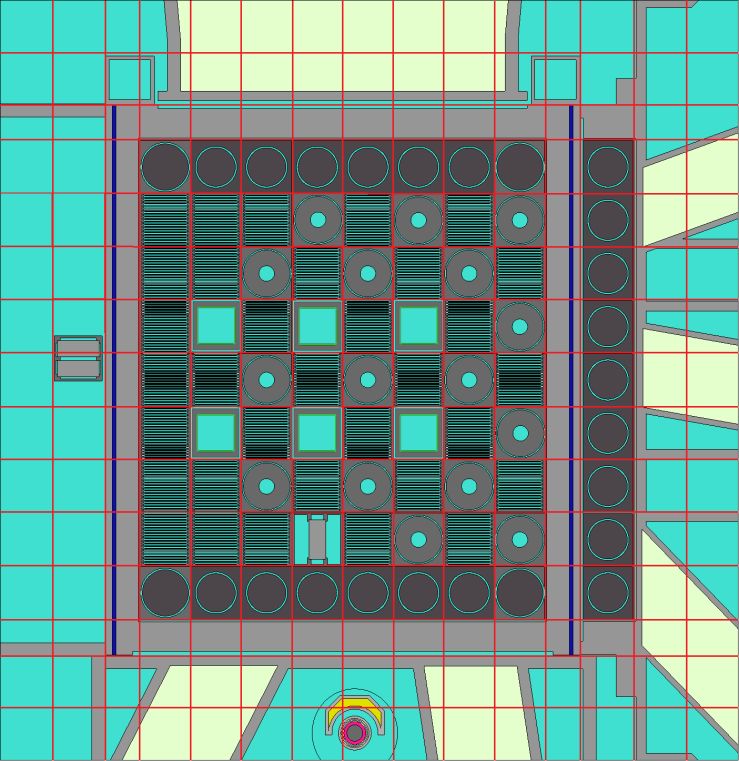
this, in-core beryllium reflector cross sections and ex-core structure and pool cross sections were
generated from a full core Serpent model as depicted in Figure 3. In the figure, the nodal diffusion mesh
in the x and y directions used in MGRAC, is superimposed over the geometry in red. Homogenized cross
sections were generated for all components in various layers, accounting for material changes in the z
direction.
S1 S2 S3
S5 S6 S4
Figure 3. Full core Serpent model with nodal overlay mesh, used to generate homogenized cross
sections for the non-fuel components.
After the homogenization step, assembly models were constructed by stacking layers of homogenized
cross sections on top of each other, which correspond to the different axial zones in the assemblies.
Finally, these assembly models were combined into a single MGRAC model, describing the entire reactor.
MCNP6 model, full detail, OSCAR
3. SIMULATION RESULTS
3.1. Core Reactivity
In order to evaluate the calculation of core reactivity, two time points were identified in 17 different
operational cycles, each corresponding to a critical configuration. For each of the identified time points, a
MGRAC and MCNP model was built representing the critical configuration, taking into account the fuel
depletion, control rod settings, in-core and ex-core experiments and isotope production loadings. Figure 4
shows the calculated core keff values for the chosen critical configurations. For the OSCAR-4 model, the
average keff for the 34 critical states is 0.99974 ± 0.00177, while the average keff value for the MCNP
model with the HFR standard library is 0.99546 ± 0.00110. This difference between OSCAR-4 and
4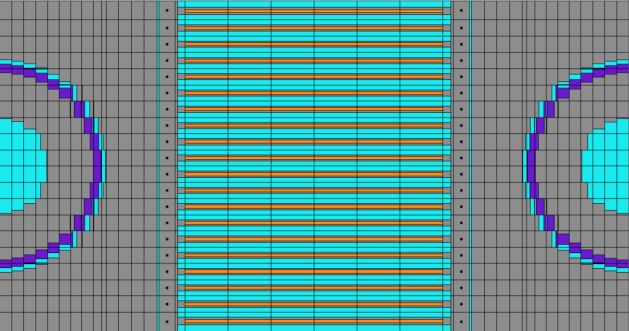
EPJ Web of Conferences 247, 10029 (2021)                                              https://doi.org/10.1051/epjconf/202124710029
PHYSOR2020

         MCNP models decreases by 150 pcm, when an explicit list of nuclides is used to represent all fission
         products instead of a B-10 equivalent number density for a lumped fission product, when exporting the
         fuel inventory from OSCAR to MCNP.

                                 OSCAR-4            MCNP HFR library              MCNP JEFF-3.3
                  1.006
                  1.004
                  1.002
                  1.000
                  0.998
           keff

                  0.996
                  0.994
                  0.992
                  0.990
                  0.988
                  0.986

         Figure 4. Calculated core reactivity comparison between OSCAR-4, MCNP with the HFR nuclear
         data library, and MCNP with the JEFF-3.3 nuclear data library for critical states in cycles 2017-01
                                                    to 2018-08.

         In order to investigate the effect of nuclear data libraries on the criticality results, the HFR standard
         library was replaced with the JEFF-3.3 library [12] in the MCNP model. Changing libraries resulted in a
         lower average keff of 0.98989 ± 0.00092 over the 34 critical states. This difference was further
         investigated and it was found that U-235 and Al-27 were the main isotopes contributing to this difference.
         For a selected critical case, replacing Al-27 and U-235 in the HFR standard library with those from JEFF-
         3.3, resulted in a 391 pcm and 232 pcm decrease in keff, respectively. Other isotopes also contribute to the
         difference but their impact is much less significant. The difference in the average keff of the MCNP model,
         when switching from the HFR library to the JEFF-3.3 library is 565 pcm.

         3.2.       Control Rod Calibrations

         Prior to reactor cycle 2018-08, control rod calibration experiments were performed. In these experiments
         the differential and integral worth of the control rods were measured over a parts of their travel distance.
         For control rod S1, nearly the entire travel distance was covered, while for control rods S2 to S6
         measurements were done for the top 15 cm of travel distance. These experiments were then simulated
         with the OSCAR-4 and MCNP models. Figure 5 shows a comparison of the measured differential and
         integral worth curves of control rod S1, with those calculated with the OSCAR-4 and MCNP models.
         Values for the measured and calculated integral worth of all of the control rods are given in Table II. The
         values presented in brackets for MCNP are the statistical uncertainties. Measurement uncertainty data was
         only provided for the measurement of control rod S1, and is also reported in brackets in Table II.

         Both the OSCAR-4 and MCNP models show good agreement with the measured worth of control rod S1,
         with the MCNP model slightly overestimating the total worth. The OSCAR-4 model overestimates the
         partial worth of control rods S3 and S4, while underestimating the partial worth of control rod S5.

                                                              5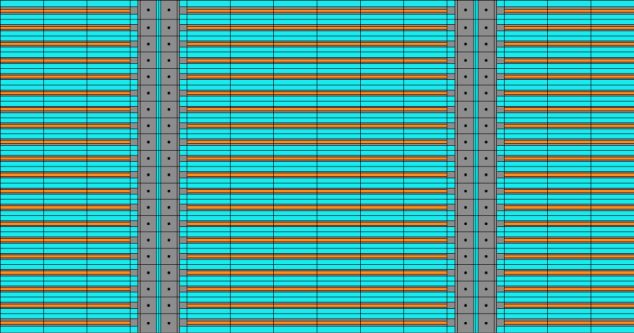
EPJ Web of Conferences 247, 10029 (2021)                                                                   https://doi.org/10.1051/epjconf/202124710029
PHYSOR2020

         Because only partial worth measurements were available for rods S2 to S6, no conclusions can be drawn
         on how well the models predict the worth of these rods over the entire travel distance.

                                                           OSCAR-4                 MCNP                    Measurement
                                         2                                                                                           600
                                       1.8
          Differential worth (cents)

                                       1.6                                                                                           500

                                                                                                                                           Integral worth (cents)
                                       1.4                                                                                           400
                                       1.2
                                         1                                                                                           300
                                       0.8
                                       0.6                                                                                           200
                                       0.4                                                                                           100
                                       0.2
                                         0                                                                                           0
                                             200   250   300    350    400     450     500     550   600     650      700      750
                                                                       Control rod extraction (mm)
                       Figure 5. Comparison of the OSCAR-4, MCNP and measured differential and integral worth of
                       control rod S1. The differential worth is represented by scatter plots, while the integral worth is
                                                        represented by solid line plots.

             Table II. Integral control rod worth: Comparison of OSCAR-4, MCNP and measured integral control
                                               rod worth for all six control rods.

                                                         Control rod   OSCAR-4          MCNP          Measured
                                                           label        (cents)         (cents)         (cents)
                                                            S1          493.14      530.25 (3.25)    491.95 (3.58)
                                                            S2           24.66       26.75 (3.61)        23.04
                                                            S3           15.75       10.71 (3.42)        13.45
                                                            S4           13.42        9.31 (3.71)        10.95
                                                            S5           24.01       30.73 (3.71)        30.10
                                                            S6           20.38       21.14 (3.42)        22.61

         3.3.                                Copper Wire Activation

         Prior to chosen operational cycles, flux mapping measurements were performed by activation of copper
         wires. For these experiments, copper wires were placed at two or three different locations in fifteen fuel
         assemblies and centrally in four of the control rods. These experiments measured the relative Cu-63 (n, γ)
         reaction rates, which were then normalized to the to the MCNP results.

         In the MCNP model, the Cu-63 (n, γ) reaction rates were tallied at the position of the copper wires, and
         compared with the measured reaction rates. For the purpose of comparison, the measured and calculated
         reaction rates were integrated over ±28 cm with respect to center line core, from which C/E values were
         calculated. Results for two flux mapping experiments are given in Figure 6 and Figure 7, which were
         done prior to operational cycles 2017-07 and 2018-08, respectively.

                                                                                    6
EPJ Web of Conferences 247, 10029 (2021) https://doi.org/10.1051/epjconf/202124710029
PHYSOR2020
Figure 6. Relative differences in the calculated and experimental Cu-63 reaction rates for cycle
2017-07 (C/E-1, in %). Results are integrated between ±28 cm with respect to core center line.
Figure 7. Relative differences in the calculated and experimental Cu-63 reaction rates for cycle
2018-08 (C/E-1, in %). Results are integrated between ±28 cm with respect to core center line.
7EPJ Web of Conferences 247, 10029 (2021) https://doi.org/10.1051/epjconf/202124710029
PHYSOR2020
The calculated reaction rates are typically within ±5% of the measured values, with notable outliers for
the control rods in positions B4 and B6, and the wires positioned in the southern part of assemblies H3
and D7. In both the results from cycle 2017-07 and 2018-08, an east-west tilt in the flux is visible, with
reaction rates in elements towards the east generally being under predicted, while the reaction rates in
elements to the west generally being over predicted by the MCNP model. The cause of this tilt over the
core is currently unknown and requires further investigation.
4. CONCLUSIONS
The results presented for critical states over multiple operational cycles of the HFR, show that the
OSCAR-4 and MCNP models produce reasonably stable keff values. It was also shown that changing from
the HFR standard nuclear data library to JEFF-3.3 libraries leads to a decrease in the average keff values of
565 pcm. The main isotopes contributing to this difference were found to be Al-27 and U-235.
Simulation results from both OSCAR and MCNP show acceptable comparison with measured values for
various experiments, making the models suitably predictive for reactor support. However, in MCNP
model there is a minor east-west tilt in the flux across the core, as seen from the copper wire activation
experiments. The cause of the tilt in the flux is possibly due to depletion of the cadmium sections of the
control rods being neglected. Causes of the bias present in the models, when using a modern nuclear data
library, require further investigation.
REFERENCES
1. E.Z. Müller et al., “Development of a Core Follow Calculational System for Research Reactors”,
Proceedings of the 9th Pacific Basin Nuclear Conference, Sydney, Australia, May 1-6, 1994.
2. G. Stander, R.H. Prinsloo, E. Müller, D.I. Tomašević, “OSCAR-4 Code System Application to the
SAFARI-1 Reactor”, Proceedings of PHYSOR-2008, Interlaken, Switzerland, 2008.
3. R.H. Prinsloo, F.A. van Heerden, D. Botes, R. Mudau, “Recent developments of the OSCAR
calculational system, as applied to selected examples from IAEA research reactor benchmarks”,
Proceedings of IGORR, Sydney, Australia, 2017.
4. D.B. Pelowitz, A.J. Fallgren, G.E. McMath (Editors), “MCNP6TM USER’S MANUAL Code Version
6.1.1beta”, Los Alamos National Laboratory report LA-CP-14-00745, Rev. 0, June 2014.
5. J. Leppänen, M. Pusa, T. Viitanen, V. Valtavirta, and T. Kaltiaisenaho. “The Serpent Monte Carlo
code: Status, development and applications in 2013”, Ann. Nucl. Energy, 82, pp. 142-150 (2015).
6. J. Briesmeister (Editor), “MCNP – A general Monte Carlo N-particle transport code – Version 4C”,
Los Alamos Report LA-13709-M, March 2000.
7. J.S. Hendricks, “MCNP4C3 release notes”, Los Alamos note X-5:RN(U)-JSH-01-17, 2001.
8. “The JEF2.2 Nuclear Data Library”, JEFF Report 17, NEA, April 2000.
9. M.B. Chadwick et al., “ENDF/B-VII.1 Nuclear data for science and technology: cross sections,
covariances, fission product yields and decay data”, Nuclear Data Sheets, 112, pp. 2887 – 2996
(2011).
10. P.F. Rose (Ed.), “ENDF-201, ENDF/B-VI Summary Documentation”, BNL-NCS 17541, 4th Edition,
1991.
11. K. Shibata et al., “Japanese Evaluated Nuclear Data Library Version 3 Revision-3: JENDL-3.3”, J.
Nucl. Sci. Technol., 39, 1125 (2002).
12. A.J.M. Plompen et al., “The Joint Evaluated Fission and Fusion Nuclear Data Library, JEFF-3.3”,
submitted to The European Physical Journal, May 2019.
8You can also read