2020 Electricity Capacity Report - EMR Delivery Body
←
→
Page content transcription
If your browser does not render page correctly, please read the page content below

2020 Electricity Capacity Report

Capacity to secure modelling
Gareth Lloyd
Webinar
6 August 2020
emrmodelling@nationalgrid.com

Agenda
❖ Background

❖ Modelling approach for the target capacity
  recommendations

❖ 2021/22 T-1 capacity recommendation

❖ 2024/25 T-4 capacity recommendation

❖ Conventional, storage and renewables de-
  rating factors

❖ Q&A
  (via Sli.do Event Code #90195)

Background
Background – ECR Content
Electricity Capacity Report (ECR) published on 14 th July includes:
❖ Auction target recommendations:
   ❖ 2021/22 T-1 and 2024/25 T-4
❖ Auction de-rating factors:
   ❖ Conventional plant, limited duration storage and intermittent renewable capacity
❖ Modelled de-rating factor ranges for interconnected countries

The Secretary of State determines:
❖   Whether to hold the auctions
❖   The capacity to secure in each auction and, in the case of the T-4 auction, the amount to hold back for T-1
❖   The auction parameters including the demand curve
❖   Individual interconnector de-ratings for use in the CM auctions

BEIS Panel of Technical Experts (PTE):
❖ Scrutinise our modelling
❖ Report published on 14th July
Potential impact of COVID-19 pandemic
The demand and supply assumptions used to inform our recommendations do not take into
account any potential impact from the COVID-19 pandemic. We are currently reviewing this, and it
may lead to a change to our recommendations when we undertake the Adjustment to the Demand
Curve after prequalification.
❖ The demand and supply assumptions in our modelling are based on the 2020 Future Energy Scenarios (FES), which
  were largely finalised when the pandemic arose
❖ National Grid ESO are currently reviewing how the COVID-19 pandemic could change our assumptions and whether
  this would have an impact on our recommendations in the 2020 ECR
❖ We have an opportunity to reflect any new information that may impact our ECR recommendations when we undertake
  the Adjustment to the Demand Curve after prequalification – this adjustment is already established in the capacity
  market process
❖ Any revisions to our assumptions will be discussed with BEIS, Ofgem and the PTE by September 2020 to allow for
  sufficient scrutiny ahead of applying any adjustments to the demand curve
❖ Should any adjustment be made, we will provide details relating to the changes in our demand and supply assumptions
  in the published Adjustment to the Demand Curve report, including the reasons behind any changes

Opportunity to get involved: please contact the FES team by email at: FES@nationalgrideso.com if you would like to
contribute views or evidence that we can consider in reviewing the impact of COVID -19.
Modelling approach for the target
capacity recommendations
Scenarios and sensitivities modelled
Scenario / sensitivity                                               Description                                  2021/22 T-1          2024/25 T-4
                                  Represents our best view to 2024/25. Aligned to System Transformation from
Base Case                         2025/26
                                                                                                                      Yes                  Yes

FES Consumer Transformation       Scenario in FES 2020 that meets Net Zero by 2050                                    Yes                  Yes
FES System Transformation         Scenario in FES 2020 that meets Net Zero by 2050                                    Yes                  Yes
FES Leading the Way               Scenario in FES 2020 that meets Net Zero before 2050                                Yes                  Yes
FES Steady Progression            Scenario in FES 2020 that doesn’t meet Net Zero                                     Yes                  Yes
                                  Represents capacity with CM agreements that fail to deliver against their
Non-delivery                      agreements (0.4 GW increments up to the maximum shown)
                                                                                                               Yes – up to 2.8 GW   Yes – up to 2.4 GW
                                  Represents CM-eligible providers delivering additional capacity outside CM
Over-delivery                     agreements (0.4 GW increments up to the maximum shown)
                                                                                                               Yes – up to 1.6 GW   Yes – up to 1.6 GW

Cold / warm winter                Represents 1 cold winter and 1 warm winter modelled individually                    Yes                  Yes
High / low wind                   Represents uncertainty in wind generation at times of cold weather                  Yes                  Yes
High / low demand                 Represents uncertainty in forecasting peak demand                                   Yes                  Yes
High / low station availability   Represents uncertainty in power station reliability                                 Yes                  No
Schematic of modelling approach
❖ The modelling approach to calculate the target
capacity to secure in each year is shown in the
schematic
❖ We start with a template derived from a BEIS DDM
input file that contains technology costs and other
generic data needed by DDM
❖ We then overwrite the key assumptions with those in
the Base Case, FES 2020 and the sensitivities.
These include: peak demand, reserve for largest
loss, annual demand, generation capacity, storage,
interconnection capacity and flow probability
distributions, DSR, station availabilities
❖ This provides our DDM input file for each scenario /
sensitivity. This is used in DDM to create modelling
outputs e.g. capacity to meet Reliability Standard
❖ The outputs from all scenarios and sensitivities are
combined in the Least Worst Regret calculations(1) to
determine our recommended target capacities
(1) For worked example see P105-107 in
https://www.emrdeliverybody.com/Lists/Latest%20News/Attachments/47/Electricity%20Capacity%20Report%202016_Final_080716.pdfCapacity to meet Reliability Standard
Create CM supply curve for all de-rated capacity. ❖ The key steps to calculate the capacity required to meet
Wind contribution represented by average fleet the Government’s Reliability Standard for each scenario
EFC. Non-CM eligible capacity given zero bid price and sensitivity modelled are outlined here (1)
❖ The Non-CM capacity matches the FES scenarios
❖ Any eligible capacity that is not required to meet the
For CM-eligible capacity, bid price is calculated Reliability Standard in the target year is closed by the
based on modelling projected costs and revenues. DDM if it does not have a CM agreement for later years.
Interconnection contribution represented by EFC ❖ Hence the total CM-eligible capacity shown in the ECR
will diverge from that shown in the original FES
scenarios
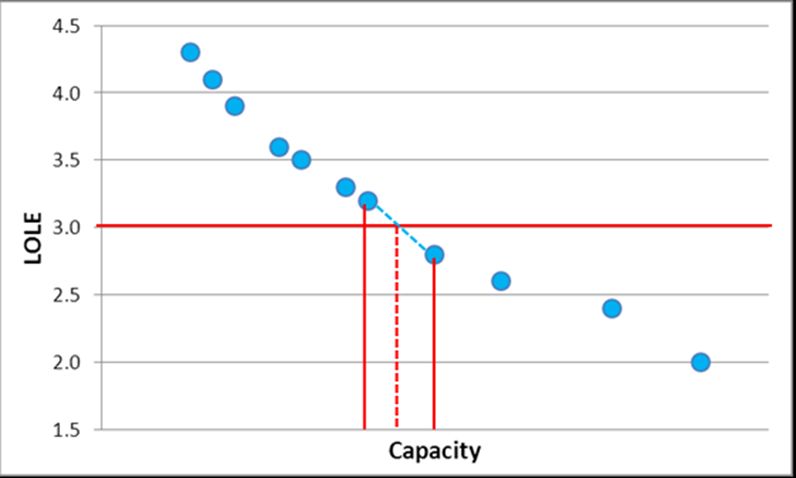
Sort de-rated capacity into bid price order and
calculate LOLE associated with each additional bid
Calculate LOLE v CM eligible de-rated capacity
curve. Find bids either side of 3 hours LOLE
Interpolate to find estimate of de-rated capacity
to meet Reliability Standard of 3 hours LOLE
(1) For more details see page 81 at
https://www.emrdeliverybody.com/Lists/Latest%20News/Attachments/116/Electricity%20Capacity%20Report%202017.pdfInterconnection EFC
Example GB interconnection flow distributions
❖ The DDM combines probability distributions for conventional (illustrative only - uses fictional data)
generation, wind generation and underlying demand to give a
net GB margin distribution over the winter peak period
❖ The DDM models the contribution of the GB interconnection
fleet at peak using distributions defining the probability of each
import / export level for a given level of net GB margin
❖ These interconnection distributions are combined with the net
GB margin distribution to give a net system margin distribution
❖ This distribution is used to calculate the interconnection
Equivalent Firm Capacity (EFC) – defined as the level of 100%
reliable (firm) plant that could replace the interconnection fleet
and provide the same reliability level of 3 hours LOLE
❖ The interconnection EFC does not significantly impact the de-
rated capacity requirement for the T-4 year
❖ For the T-1 year, the interconnection EFC could potentially have
an impact if the EFC calculated by the DDM is significantly
lower than the interconnection de-rated capacity awarded CM
agreements in the T-4 auction for that year.
❖ This could be a potential topic for a future development projectKey Factors Affecting Our Modelling
❖ Key factors increasing CM-eligible capacity required to meet Reliability Standard in a scenario / sensitivity include:
❖ An increase in ACS Underlying Peak Demand or Reserve for Largest Infeed Loss
❖ Assumed non-delivery in the scenario / sensitivity
❖ A reduction in de-rated capacity not eligible (e.g. RO/CFD/FIT- supported, & already awarded agreement for target year)
❖ Key factors decreasing CM-eligible capacity required to meet Reliability Standard in a scenario / sensitivity include:
❖ A reduction in ACS Peak Demand or Reserve for Largest Infeed Loss
❖ Assumed over-delivery in the scenario / sensitivity
❖ An increase in de-rated capacity not eligible (e.g. RO/CFD/FIT- supported & already awarded agreement for target year)
❖ Factors that do not significantly affect the CM-eligible capacity required in a scenario / sensitivity include:
❖ Assumptions around which CM-eligible capacity is available to participate in the auction
❖ For the T-4 year, assumptions around the contribution of interconnection
❖ Demand side response (DSR) assumptions
❖ The overall recommended target capacity is dependent on the outcome of the LWR calculation is influenced by:
❖ The scenarios / sensitivities that the define the bottom and top of the range in capacity requirement values (the LWR
outcome is usually around 60% to 70% of the way between the bottom and top value)
❖ The Value of Lost Load (VoLL) and net CONE (Cost of New Entry) decided by the Secretary of StateTarget capacity for 2021/22 T-1 auction
2021/22 T-1 summary
Our recommendation on the target capacity for the 2021/22 T-1 auction is 0 GW. The Secretary of State
decided to hold a T-1 auction with a target capacity of 0.4 GW. This decision is consistent with
legislation to hold an auction for at least half the amount set aside and also reflects other uncertainties
❖ Outcome of the least worst regret calculation was -1.2 GW, but as this is negative, our recommendation is 0 GW
❖ The range of the least worst regret calculation is set by two scenarios in FES 2020. This means that the decisions
  on the maximum level of over- and non-delivery to include in the sensitivities had minimal impact on the outcome
❖ Our recommendation covers 21 out of 24 cases modelled
❖ The negative requirement has resulted from a number of changes since the decision by the Secretary of State to
  hold back 0.4 GW for the 2021/22 T-1 auction. Changes contributing to the negative requirement include:
   ❖ reduction in peak demand forecast of 3.5 GW
   ❖ procuring 0.9 GW extra capacity in the 2021/22 T-4 auction due to low clearing price
   ❖ increase of around 1.3 GW in non-CM renewable capacity, meaning we need to secure less capacity
       through the CM
   Note: the decision to only hold back 0.4 GW means that any one of these changes on their own would be
   sufficient to reduce the T-1 requirement to zero.
❖ Prequalification and COVID-19 revisions may impact final target for T-1 auction
2021/22 T-1 scenario / sensitivity results
Capacity to Outside CM Total derated
Name ACS Peak (GW)
Secure (GW) (GW) capacity (GW)
❖ The range from the scenarios and sensitivities
Leading the Way -5.5 62.7 57.2 54.8 modelled is -5.5 GW to 1.1 GW
Base Case Warm Winter -4.6 62.7 58.0 57.8
Base Case Over Delivery Sensitivity: 2000** -4.3 65.3 61.0 57.8 ❖ The range is set by two of the scenarios from FES
Base Case Over Delivery Sensitivity: 1600
Base Case High Availability
-3.9
-3.9
64.9
64.1
61.0
60.2
57.8
57.8
2020: Leading the Way and Steady Progression
Base Case Over Delivery Sensitivity: 1200 -3.5 64.5 61.0 57.8
Base Case Low Demand -3.4 62.9 59.5 56.6
Consumer Transformation -3.3 63.1 59.8 56.8
Notes on the Table:
Base Case Over Delivery Sensitivity: 800 -3.1 64.1 61.0 57.8 Capacity to Secure – how much is still needed in the 2021/22 T-1
Base Case High Wind -2.9 63.6 60.8 57.8
auction for that scenario / sensitivity to meet 3 hours LOLE
System Transformation -2.7 63.1 60.4 57.3
Base Case Over Delivery Sensitivity: 400 -2.7 63.7 61.0 57.8 Outside CM – how much capacity has already been delivered
Base Case -2.3 63.3 61.0 57.8 outside of the 2021/22 T-1 auction. This includes capacity
Base Case Non Delivery Sensitivity: -400
Base Case Cold Winter
-1.9
-1.7
62.9
63.5
61.0
61.8
57.8
57.8
already secured from previous auctions including the 2021/22 T-4
Base Case Low Wind -1.6 62.8 61.2 57.8 accounting for known non-delivery (-1.8 GW), storage de-rating
Base Case Non Delivery Sensitivity: -800 -1.5 62.5 61.0 57.8 changes (-0.5 GW), change in de-rated TEC (-1.3 GW for Base
Base Case High Demand -1.2 63.6 62.4 59.0
Base Case Non Delivery Sensitivity: -1200 -1.1 62.1 61.0 57.8 Case) and non/over-delivery
Base Case Low Availability -0.8 62.4 61.7 57.8 Total de-rated capacity – how much capacity is needed for that
Base Case Non Delivery Sensitivity: -1600
Base Case Non Delivery Sensitivity: -2000
-0.7
-0.3
61.7
61.3
61.0
61.0
57.8
57.8
scenario / sensitivity to meet 3 hours LOLE
Base Case Non Delivery Sensitivity: -2400 0.1 60.9 61.0 57.8 ACS Peak – peak demand for that scenario / sensitivity excluding
Base Case Non Delivery Sensitivity: -2800 0.5 60.5 61.0 57.8 demand to meet reserve for largest loss
Base Case Non Delivery Sensitivity: -3200** 0.9 60.1 61.0 57.8
Steady Progression 1.1 61.7 62.8 59.2
Capacity to Secure = Total de-rated capacity – Outside CM
*Non delivery scenarios assume some capacity that will get contracted in the auction won't honour contract, hence the reduction in
Outside CM as overall capacity required remains the same.
** Excluded from LWR analysis2021/22 T-1 least worst regret outcome
2
Recommendation of 0 GW covers 21 out of 24 cases
1 modelled. Three cases have a capacity to secure
greater than zero and so wouldn’t be covered.
Capacity to secure, GW
0
-1 BC
-2 CT
-3 ST
LW
-4
SP
High demand sensitivity set the outcome
-5 0GW
of the LWR calculation at -1.2 GW
-6 -1.2GW
BC_HIGH_AVAIL
SP
LW
BC_WARM
BC_OVER_DEL_1600
BC_OVER_DEL_1200
ST
BC_LOW_DEMAND
BC_HIGH_WIND
BC_NON_DEL_1200
BC_NON_DEL_1600
BC_NON_DEL_2000
BC_NON_DEL_2400
BC_NON_DEL_2800
BC_COLD
CT
BC
BC_LOW_AVAIL
BC_LOW_WIND
BC_OVER_DEL_800
BC_OVER_DEL_400
BC_NON_DEL_400
BC_NON_DEL_800
BC_HIGH_DEMAND
SoS T-1How the 2021/22 T-1 requirement has changed
2024/25 T-4 capacity recommendation
2024/25 T-4 summary
Our recommendation on the target capacity for the 2024/25 T-4 auction is 41.6 GW. The Secretary
of State has accepted our recommendation and will hold back 0.4 GW for the T-1 auction giving a
target capacity of 41.2 GW for the T-4 auction
❖ Recommendation (41.6 GW) is derived from nearest Base Case sensitivity (800 MW Non-delivery) to LWR outcome
  (41.7 GW for Consumer Transformation scenario)
❖ The range of the least worst regret calculation is set by two scenarios in FES 2020. This means that the decisions on the
  maximum level of over- and non-delivery to include in the sensitivities had minimal impact on the outcome
❖ Our recommendation covers 14 out of 21 cases
❖ Our recommendation of 41.6 GW is 3.1 GW lower than our recommendation for the recent 2023/24 T-4 capacity market
  auction. This is mainly due:
    ❖ 1.7 GW multi-year agreements being awarded in the recent 2022/23 T-3 and 2023/24 T-4 auctions
    ❖ reduction in peak demand forecast of 1.4 GW compared to the 2019 Base Case
❖ Prequalification and COVID-19 revisions may impact final target for T-4 auction
2024/25 T-4 scenario / sensitivity results
Capacity to Outside CM Total derated
Name ACS Peak (GW)
Secure (GW) (GW) capacity (GW)
Leading the Way 37.4 20.6 58.0 54.3
❖ The range from the scenarios and sensitivities
Base Case Warm Winter 38.5 19.9 58.4 57.5 modelled is 37.4 GW to 44.1 GW
Base Case Over Delivery Sensitivity: 2000**
Base Case Over Delivery Sensitivity: 1600
38.8
39.2
22.0
21.6
60.8
60.8
57.5
57.5
❖ The range is set by two of the scenarios from FES
Base Case Over Delivery Sensitivity: 1200 39.6 21.2 60.8 57.5 2020: Leading the Way and Steady Progression
Base Case Low Demand 39.7 20.0 59.7 56.4
System Transformation 39.8 19.8 59.6 56.3
Base Case Over Delivery Sensitivity: 800 40.0 20.8 60.8 57.5 Notes on the Table:
Base Case High Wind 40.3 20.5 60.8 57.5 Capacity to Secure – how much is needed in the 2024/25 T-4
Base Case Over Delivery Sensitivity: 400 40.4 20.4 60.8 57.5 auction for that scenario / sensitivity to meet 3 hours LOLE
Base Case 40.8 20.0 60.8 57.5
Base Case Non Delivery Sensitivity: -400 41.2 19.6 60.8 57.5
Outside CM – how much capacity has already been delivered
Base Case Cold Winter 41.4 20.1 61.4 57.5 outside of the 2024/25 T-4 auction. This includes non-CM
Base Case Low Wind 41.5 19.3 60.8 57.5 capacity and capacity already secured from previous auctions
Base Case Non Delivery Sensitivity: -800 41.6 19.2 60.8 57.5 accounting for known non-delivery (-1.8 GW), storage de-rating
Consumer Transformation 41.7 20.0 61.7 57.8
Base Case High Demand 41.9 20.0 61.9 58.7
changes (-0.5 GW) and non/over-delivery
Base Case Non Delivery Sensitivity: -1200 42.0 18.8 60.8 57.5 Total de-rated capacity – how much capacity is needed for that
Base Case Non Delivery Sensitivity: -1600 42.4 18.4 60.8 57.5 scenario / sensitivity to meet 3 hours LOLE
Base Case Non Delivery Sensitivity: -2000 42.8 18.0 60.8 57.5 ACS Peak – peak demand for that scenario / sensitivity
Base Case Non Delivery Sensitivity: -2400 43.2 17.6 60.8 57.5
Base Case Non Delivery Sensitivity: -2800** 43.6 17.2 60.8 57.5
excluding demand to meet reserve for largest loss
Base Case Non Delivery Sensitivity: -3200** 44.0 16.8 60.8 57.5 Capacity to Secure = Total de-rated capacity – Outside CM
Steady Progression 44.1 19.6 63.6 60.4
*Non delivery scenarios assume some capacity that will get contracted in the auction won't honour contract, hence the reduction
in Outside CM as overall capacity required remains the same.
** Excluded from LWR analysisCapacity to secure, GW
37
38
39
40
41
42
43
44
45
LW
BC_WARM
BC_OVER_DEL_1600
BC_OVER_DEL_1200
BC_LOW_DEMAND
ST
BC_OVER_DEL_800
BC_HIGH_WIND
BC_OVER_DEL_400
BC
set by the 0.8 GW non-delivery sensitivity
BC_NON_DEL_400
Recommendation of 41.6 GW covers 14 out of
21 cases modelled. The outcome of the LWR is
BC_COLD
BC_LOW_WIND
BC_NON_DEL_800
CT
BC_HIGH_DEMAND
BC_NON_DEL_1200
BC_NON_DEL_1600
BC_NON_DEL_2000
BC_NON_DEL_2400
SP
ST
SP
CT
BC
LW
SoS T-4
SoS T-1
2024/25 T-4 least worst regret outcome
41.6GWHow the 2024/25 T-4 compares to 2023/24
15-year view
  ❖ Shows range in modelled CM-eligible
    capacity requirement over 15 years
  ❖ Shows total requirement in each year
    – does not split this by auction(1)
  ❖ First 3 years come from 2021/22 runs
    and rest from 2024/25 model runs
  ❖ Shows the ongoing requirement for
    CM-eligible capacity over period
  ❖ New capacity built in early years still
    required as coal / nuclear plants close
  ❖ CT and SP requirement increases
  ❖ ST and LW requirement stable across
    most years . Fall for ST in later years
  ❖ Increase when support for biomass
    conversion ends in 2027/28
  ❖ Drop in RO / CFD supported wind
    increases requirement in later years
                                                           See Section 3.11 in the 2020 ECR for more details

(1) For details on capacity already secured over the 15 year period, see page 5 of
https://www.emrdeliverybody.com/Capacity%20Markets%20Document%20Library/T-4%202019%20DY2023%20Capacity%20Market%20Auction%20Final%20Results%20V1.0.pdf
Conventional, storage and renewables de-rating factors
De-rating factors for conventional plant
         ❖ De-rating factors for conventional stations are based on the methodology set out in the Capacity Market Rules
         ❖ There is a change to the de-rating factor for Oil due to a lack of historical data (the last oil plant closed in 2014/15). We
           recommended using the same de-rating factor as OCGT (1)
         ❖ Drop in DSR is driven by lower availability in winter 2019/20 and confirmed with market participants
         ❖ We are intending to carry out a development project to review how we calculate de-rating factors for embedded generation
           when the embedded capacity data is provided via DCUSA DCP350
         ❖ In the meantime we continue to welcome views and can be contacted via email at emrmodelling@nationalgrid.com

                                                                                                                                                                 See Section 4.1 and Table 15 in the
                                                                                                                                                                 2020 ECR for more details

(1) The methodology prescribes that the de-rating factor is based on availability during the winter peak period over the last 7 years. However as the last oil
plant closed in 2014/15, this only includes 2 years of historic data, so we recommend assigning the de-rating factor used for OCGT
De-rating factors for limited duration storage
❖ The methodology to determine de-rating factors for limited duration storage is unchanged since last year
❖ Full details on the methodology can be found in our final consultation report published in December 2017 (1)
❖ De-rating factors reflect the capability of storage to deliver for the potential duration of a stress period
❖ Storage assets with longer duration have higher de-rating factors.De-rating factors for T-1 year similar to 2019 ECR.
❖ De-rating factors for T-4 year are higher than 2019 due to lower storage capacity in 2020 Base Case
❖ Threshold for “duration-limited” storage is 5 hours for both T-1 and T-4 years (it was 5.5 hours for T-4 year in 2019 ECR)
See Section 4.1 and Table 16 in the
2020 ECR for more detail
(1) https://www.emrdeliverybody.com/Lists/Latest%20News/Attachments/150/Duration%20Limited%20Storage%20De-Rating%20Factor%20Assessment%20-
%20Final.pdfDe-rating factors for renewables
❖ The methodology to determine de-rating factors for renewables is unchanged since last year
❖ Full details on the methodology can be found in our final consultation report published in February 2019 (1)
❖ As renewable capacity has access to other forms of support, capacity market de-rating factors use the incremental
equivalent firm capacity (EFC) to reflect the additional contribution to security of supply from projects delivered through
the capacity market
❖ The incremental EFC is lower than the average EFC of the fleet, which will reflect the contribution to security of supply
from wind and solar delivered through the capacity market and other support schemes (e.g. Contracts for Difference)
❖ Small change in wind incremental EFCs compared to 2019 ECR reflect changes in wind capacity in T-1 / T-4 years
❖ Solar PV incremental EFC changes since 2019 ECR reflect lower storage capacity and change in solar PV capacity
See Chapter 4.1 and Table 17 in the
2020 ECR for more details
(1) https://www.emrdeliverybody.com/Prequalification/EMR%20DB%20Consultation%20response%20-%20De-
rating%20Factor%20Methodology%20for%20Renewables%20Participation%20in%20the%20CM.pdfFeedback on de-rating methodology National Grid ESO continues to welcome comments and questions on our approaches either through email (emrmodelling@nationalgrid.com), industry forums or bilateral meetings. ❖ We would particularly appreciate any feedback on our developing work on constrained hybrid sites (described in Section 2.5.2 of the 2020 ECR) and how we calculate de-rating factors for distribution-connected generation. ❖ In our current methodology, conventional plant de-rating factors are calculated using the availability of transmission- connected units during the winter peak period. ❖ These de-rating factors are also assigned to distribution-connected generation for the relevant technology type as we do not have access to data to calculate de-rating factors for distributed generation directly. ❖ In recent years, National Grid ESO has taken steps to obtain better data and improve our modelling of distributed generation. ❖ We have already procured metered hourly generation output data from Electralink. ❖ However, this does not provide information on the asset. We have therefore been supporting a Change Proposal to the Distribution Connection and Use of System Agreement (DCUSA) to create a register of embedded assets. ❖ This modification is referred to as DCP 350 was approved on 1 July 2020. Further information can be found on the DCUSA website. ❖ We expect this data to become available soon and we are intending to review how we could use it with the Electralink data to directly calculate de-rating factors for distributed generation. ❖ Any changes to de-rating factor methodologies will be subject to industry consultation.
Q&A   Any questions?

      Please ask a question via Sli.do:
      Slido.com
      Event code # 90195

      Thanks!
      emrmodelling@nationalgrid.com
You can also read