Upper Arlington City School District Investor Presentation - School Facilities Construction and Improvement Bonds $220,500,000 Series 2018A
←
→
Page content transcription
If your browser does not render page correctly, please read the page content below
Upper Arlington City School District
Investor Presentation
School Facilities Construction and Improvement Bonds
$220,500,000 Series 2018A

                           January 17, 2018
Disclaimer
This electronic investor presentation that you are about to view is provided as of January 17, 2018 for a proposed offering of School Facilities
Construction and Improvement Bonds, Series 2018A (the “Bonds”). This presentation has been prepared for information purposes only and for
your sole and exclusive use in connection with the proposed transaction. The information contained herein is subject to completion and
amendment. Any offer or solicitation with respect to the Bonds will be made by means of a preliminary official statement or a final official
statement. If you are viewing this investor presentation after the date stated above, events may have occurred that have a material adverse
effect on the financial information presented and neither the issuer nor the underwriter have undertaken any obligation to update this
electronic presentation.
This investor presentation does not constitute a recommendation or an offer or solicitation for the purchase or sale of any security or other
financial instrument, including the Bonds, or to adopt any investment strategy. You will be responsible for consulting your own advisors and
making your own independent investigation and appraisal of the risks, benefits, appropriateness and suitability of the proposed transaction and
any other transactions contemplated by this presentation and neither the issuer nor the underwriter is making any recommendation (personal
or otherwise) or giving any investment advice and will have no liability with respect thereto.
Neither the issuer nor the underwriter makes a representation or warranty as to the (i) accuracy, adequacy or completeness of any information
in this investor presentation or (ii) legal, tax, credit or accounting treatment of any purchase of Bonds by you or any other effects such purchase
may have on you and your affiliates or any other parties to such transactions and their respective affiliates. The information contained herein
has been compiled from sources believed to be reliable, however neither the issuer nor the underwriter shall have any liability whatsoever (in
negligence or otherwise) to any person for any loss arising from this investor presentation or any information supplied in connection therewith.
This investor presentation contains “forward‐looking” statements that involve risks, uncertainties and assumptions. If the risks or uncertainties
ever materialize or the assumptions prove incorrect, the results may differ materially from those expressed or implied by such forward‐looking
statements. Accordingly, we caution you not to place undue reliance on these statements. All statements other than the statements of
historical fact could be deemed forward‐looking. All opinions, estimates, projections, forecasts and valuations are preliminary, indicative and
are subject to change without notice.
Transactions involving the Bonds may not be suitable for all investors. You should consult with your own advisors as to the suitability of the
Bonds for your particular circumstances. No assurance can be given that any transaction mentioned herein could in fact be executed. Past
performance is not indicative of future returns, which will vary. Prospective investors should contact their salesperson at, and execute the
transactions through an entity of the underwriter qualified in their home jurisdiction unless governing law permits otherwise.
THE PRINTING, DUPLICATING, DOWNLOADING, SCREEN CAPTURING, ELECTRONIC STORING, RECORDING, PUBLISHING OR DISTRIBUTING OF
THIS INVESTOR PRESENTATION IN ANY MANNER IS STRICTLY PROHIBITED.
By viewing this investor presentation you acknowledge that you understand and agree to the provisions of this page.

Transaction Overview
Issuer:              Upper Arlington City School District (“Upper Arlington CSD” or the “District”)
Issue:               School Facilities Construction and Improvement Bonds
                     Series 2018A
Par Amount*          $220,500,000

Purpose:             The purpose of constructing, furnishing, and equipping a new high school, with related site improvements
                     and appurtenances thereto; constructing, furnishing, and equipping new elementary schools, with related
                     site improvements and appurtenances thereto; renovating, repairing, improving, furnishing, equipping, and
                     constructing improvements and additions to existing school facilities, buildings, and infrastructure; and
                     replacing existing equipment and constructing various permanent improvements and constructing and
                     improving various athletic facilities.
Security:            The Bonds will be voted general obligations of the School District and will contain a pledge of the full faith
                     and credit of the School District for the payment of the principal of and interest on the Bonds when due.
Structure*:          Interest Payable each June 1 and December 1, commencing June 1, 2018
                     Serial Bonds each December 1 (2018-2037) and Term Bonds (2042, 2047 and 2055)

Redemption*:         To Be Determined at Pricing

Tax Matters:         Excludable from gross income for purposes of federal and Ohio income tax

Ratings:             Moody’s: “Aa1”
                     Standard & Poor’s: “AAA”

                                                                                                                              1
  * Preliminary, subject to change
Upper Arlington City School District
First‐ring suburb of Columbus close to The Ohio
State University
Population of approximately 35,000
Residential community with recent focus on
mixed‐use development
Consistent growth and resiliency in real property
and tax base
2Academic Program and Achievements
Academic Program Academic Achievements Arts and Athletics
District‐run academically College‐entrance exam 32 varsity sports; 141
acclaimed preschool scores well above state and state titles
national averages
One‐to‐one technology Approximately 80 clubs
ACT: 26.8 and activities
kindergarten through grade
12
High number of enrollments
in college‐level coursework
Two instructional models at
the elementary level AP enrollments: 797
IB enrollments: 354
Strong emphasis on service
learning Community support of the
quality of education
More than 60 AP/IB course provided by Upper
offerings Arlington Schools
Fourteen 2018 National
Merit Semifinalists
3Plan of Finance
The District’s $220,500,000 Series 2018A Bonds are being issued to renovate
or rebuild six of its nine School Facilities
Following the issuance of the Series 2018A Bonds, the District expects to
issue its Series 2018B Bonds for the purpose of refunding $9,500,000 of the
School District’s School Facilities Construction and Improvement Notes, Series
2017. The Series 2018B are expected to be a separate offering on or about
February 15, 2018
* Preliminary, subject to change
4School District Facilities
School District Facilities
p Prior to the New Projects
Grades Enrollment Number of Pupil/ Year Building Year(s) of Additions/
Name of Building Housed (2017–18) Teachers Teacher Ratio Completed Renovations
Burbank Early Childhood School Pre–K 236 13 18:1 1971 ‐‐
Barrington Elementary School K–5 723 31 23:1 1938 1949, 1958, 2009
Greensview Elementary School K–5 466 20 23:1 1965 1969, 2009
Tremont Elementary School K–5 644 27 24:1 1952 1958, 1991, 2016, 2017
Wickliffe Progressive School K–5 524 22 24:1 1956 1966
Windermere Elementary K–5 462 19 24:1 1958 1962, 1966
Hastings Middle School 6–8 691 50 14:1 1961 1966, 1978
Jones Middle School 6–8 733 50 15:1 1923 1926, 1967, 1971, 1996
Upper Arlington High School 9–12 1,882 110 17:1 1956 1959, 1964, 1965, 1971, 1983
Total ‐ 6,361 342 ‐ ‐
Source: School District
After completion of the Project, the School District will operate the following facilities:
School District Facilities Upon Completion of the Project
Group/Grades
Buildings Housed
New Construction
Greensview Elementary School K–5
Wickliffe Progressive School K–5
Windermere Elementary K–5
Upper Arlington High School 9–12
Renovated Facilities
Barrington Elementary School K–5
Tremont Elementary School K–5
Existing Facilities
Burbank Early Childhood School Pre–K
Hastings Middle School 6–8
Jones Middle School 6–8
Source: School District
5Enrollment
Serves approximately 6,125 students in K‐12
Gradual growth is projected with a total of 6,499 students by 2021‐2022
New and renovated buildings will provide capacity for number of students as shown in
Enrollment Projection report dated October 2017
Projections are produced by third party ‐ Planning Advocates, Inc.
Actual and Projected Enrollment
Upper Arlington City School District
1 1 1 1
Grade 2014‐15 2015‐16 2016‐17 2017‐18 2018‐19 2019‐20 2020‐21 2021‐22
K 406 414 423 440 437 447 477 476
1 438 469 447 476 482 476 497 519
2 445 444 470 469 485 490 486 496
3 456 464 453 482 482 508 505 499
4 414 474 476 462 491 491 506 512
5 465 427 483 490 468 497 497 513
6 475 464 443 493 507 485 515 514
7 469 486 486 438 496 510 488 518
8 475 457 487 493 441 499 513 491
9 500 479 453 487 501 448 507 521
10 420 490 477 448 485 499 446 505
11 437 411 490 465 444 481 495 442
12 409 439 400 482 463 442 479 493
Totals² 5,809 5,918 5,988 6,125 6,182 6,273 6,411 6,499
[1] Projected enrol l ment numbers a s determi ned by Pl a nni ng Advoca tes , Inc.
[2] Does not i ncl ude Pre–K enrol l ment.
6Community Support
Eight of nine levies have passed since 1998 with an average
approval rate of over 57%
History of
Strong History ofVoted
VoterTaxes
Support
Upper Arlington City School District
Voting Voting
Election Date Levy or Bond Issue Description
For Against
11/7/2017 $230,000,000 School Construction and Improvement Bond Issue 54.66% 45.34%
11/7/2017 3.75 Mill Current Expense Levy (New ‐ Continuing) 54.66 45.34
11/5/2013 4.00 Mill Current Expense Levy (New ‐ Continuing) 57.16 42.84
11/6/2012 5.80 Mill Current Expense Levy (New ‐ Continuing) 45.40 54.60
11/6/2007 4.20 Mill Current Expense Levy (New – Continuing) 58.70 41.30
11/6/2007 2.00 Mill Permanent Improvement Levy (New ‐ Continuing) 58.70 41.30
11/2/2004 7.50 Mill Current Expense Levy (New ‐ Continuing) 61.52 38.48
11/6/2001 6.20 Mill Current Expense Levy (New ‐ Continuing) 59.52 40.48
11/3/1998 6.20 Mill Current Expense Levy (New ‐ Continuing) 53.83 46.17
Source: OMAC
Note: Issues in bold were passed by the voters
7Assessed Valuation
The district’s assessed valuation is stable and growing overall
Years with slight decreases were result of recession, resulting board of
revision cases, and uptick in TIF and abated properties for economic
development purposes
As of collection year 2017:
Total A/V of parcels with abatements (including TIFs) totaled $31.1 million
Collection year 2018 growth is 12.43%
Historic Change in Assessed Valuation
Upper Arlington City School District
Percent Change Over Prior
Tax Collection Year Assessed Valuation
Year
2011 1,596,760,320 0.04%
2012¹ 1,587,795,420 ‐0.56%
2013 1,577,192,520 ‐0.67%
2014 1,574,668,070 ‐0.16%
2015² 1,719,665,510 9.21%
2016 1,719,170,040 ‐0.03%
2017 1,728,251,930 0.53%
2018¹ 1,943,122,330 12.43%
Source: Franklin County Auditor
¹ Year of sexennial reappraisal. The County’s next sexennial reappraisal occurs in tax year 2023, collection year 2024.
² Year of triennial update. The County’s next triennial update occurs in tax year 2020, collection year 2021.
8Top Real Estate Taxpayers
Tax Base is diverse with no significant concentration
Upper Arlington City School District
2018 Collection Year
Percent of School District’s
Rank Name of Taxpayer Type of Business Assessed Valuation
Total Assessed Valuation
Real Estate Taxpayers
1 First Community Village Retirement Community 8,428,600 0.43%
2 Medstone Realty Company LLC Medical Offices 6,408,510 0.33
3 Lane Avenue 450 LLC Shopping Center 5,526,720 0.28
4 GGRE Son Central II Arlington LLC Not listed 4,753,010 0.24
5 Scioto Country Club Inc. Country Club 3,873,100 0.20
6 Echo/Continental Kingsdale LLC Shopping Center 3,609,240 0.19
7 Centro NP Greentree SC LLC Shopping Center 3,447,510 0.18
8 Kenbrook Village Co. Apartments 3,405,550 0.18
9 National Church Residences Retirement Community 2,681,850 0.14
10 Tremont Center Company Shopping Center 2,336,540 0.12
11 Lane Avenue Office Building LLC Shopping Center 2,153,340 0.11
Public Utility Taxpayers
1 Ohio Power Company Electric Utility 13,026,870 0.67%
2 AEP Ohio Transmission Company Inc. Electric Utility 8,067,980 0.42
3 Columbia Gas of Ohio Inc. Gas Utility 5,095,140 0.26
All Others 1,870,308,370 96.25%
Total Assesed Valuation 1,943,122,330
Source: Franklin County Auditor
9Financial Results
Ratios have been improving and exceed historical levels
Fund balance is projected to exceed 50% of revenue and expenditures
Community approved additional operating levy November 2017 – confirming
support of healthy carryover
Actual (Audited Non‐GAAP Basis) Forecasted (Unaudited Cash Basis)
FY2017 FY2018(1) FY2019 FY2020
Beginning Balance $38,635,968 $43,149,618 $45,646,031 $48,149,933
Revenue 87,583,869 $90,911,880 $94,473,864 $94,615,212
Expenditures 84,696,455 $88,339,101 $91,889,962 $95,699,162
Rev Over/(Under) Exp 2,887,414 $2,496,413 $2,503,902 ($1,168,950)
Other Sources (Uses) 35,777 ($76,366) ($80,000) ($85,000)
Prior Year Encumbrances 820,052 NA NA NA
Ending Fund Balance(2) 42,379,211 $45,646,031 $48,149,933 $46,980,983
Revenue/Expenditure 1.03 1.03 1.03 0.99
Fund Balance % of Rev 48.4% 50.2% 51.0% 49.7%
Fund Balance % of Exp 50.0% 51.7% 52.4% 49.1%
1) Beginning Year Fund Balance from December 2017 Five‐Year Forecast ‐‐ FY2018 audited GAAP statements not available.
2) Ending Fund Balance for FY2018 through FY2020 agrees with Year‐End Cash Balance as reported in Five‐Year Forecast.
10Five‐Year Forecast 2018‐2022
Revenue Highlights
New operating levy passed November 2017
New 3.75 mil levy generates $6.5 million annually
State budget
Nearly no change – consistent with prior results
Cash Reserve (Board Policy May 10, 2016)
Policy requires three months (25%) of general fund expenditures as
budget reserves (Line 9.03)
11Five‐Year Forecast 2018‐2022
Expenditure Highlights
Licensed staff agreement through June 2018
0% base salary increases ending FY2016 and FY2017, 2% base salary
increase ending FY2018
4‐5 additional staff included each fiscal year related to enrollment
increases
Classified staff agreement through June 2020
2.5% base salary increase through FY2017, 2.0% base salary through
FY2018, and 1.75% through FY2019
Medical premium increases were 0% increase in 2017, and 2.5%
increase in 2018
Future years budgeted at 7.0%
FY2018 actual revenue and expenditure results are on track with
budgeted – expected to end fiscal year near projections
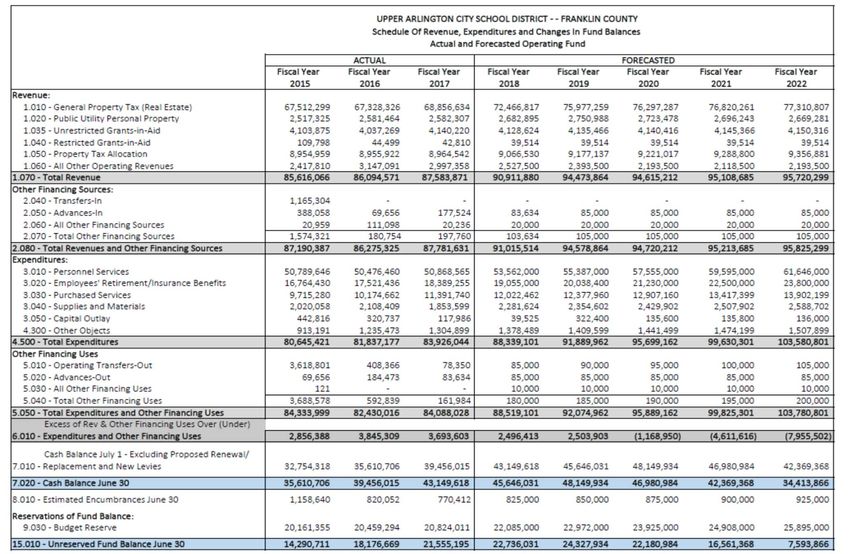
12Five‐Year Forecast 2018‐2022
13Financial Practices
Cash Reserve Policy (Formal)
Five‐Year Forecast used in planning
Three months (25%) of general fund expenditures as carryover
Exceeding policy ‐ FY2017 51.3% (Actual) FY2018 51.6% (Forecasted)
Permanent Improvement Levy
Generates slightly over $3,000,000 annually
Reduces general operating fund expenditures
Annual budgeting of permanent improvement projects
Financial Reporting
Monthly financial reporting to Board of Education
Board Finance committee
Year‐to‐Date budget to actual
May & October Five‐Year Forecast
Board of Education review and approval
14Bond Structure
Maturity
(12/1) Series 2018A
2018 9,650,000
2019 9,255,000
Par Amount* Series 2018A: $220,500,000 2020 5,735,000
2021 1,745,000
2022 2,210,000
Dated/Delivery Date* Series 2018A: 2/27/2018 2023 5,115,000
2024 5,835,000
2025 6,125,000
2026 6,435,000
Tax Status Excludable from gross income for purposes of 2027 6,955,000
federal and Ohio income tax 2028 7,300,000
2029 4,035,000
Bond Ratings (M/S&P) “Aa1/AAA” 2030 4,235,000
2031 4,450,000
Interest Payment Dates Semiannually each June 1 and December 1, 2032 4,670,000
2033 4,860,000
commencing June 1, 2018* 2034 800,000
2035 1,220,000
2036 4,130,000
Optional Redemption To Be Determined at Pricing 2037 4,545,000
2042 25,595,000
Maturity Schedule* Due December 1 as set forth below*
2047 31,145,000
2055 64,455,000
* Preliminary, subject to change
Denotes final maturity 15Financing Timeline
Date Event
January 12 Receive Ratings
January 17 Post/Distribute 2018A POS
January 30 Price 2018A Bonds
February 27 Closing 2018A Bonds
16Contact Information
For further inquiries, please contact:
Marvin Founds
Managing Director, H.J. Umbaugh & Associates
E‐mail: founds@umbaugh.com
Telephone: (614) 987‐1689
Eugene Spinelli Scott Detar
Managing Director, BofAML Director, BofAML
E‐mail: eugene.spinelli@baml.com E‐mail: scott.detarjr@baml.com
Telephone: (215) 446‐7018 Telephone: (980) 386‐0889
17You can also read