OBSERVER: The Copernicus programme and its services in 2020: part
of the COVID-19 response and key milestones
←
→
Page content transcription
If your browser does not render page correctly, please read the page content below
OBSERVER: The Copernicus programme and its services in 2020: part of the COVID-19 response and key milestones
As Stephanie Zacharek wrote in Time Magazine about 2020: “there have been worse years in world
history, but most of us alive today have seen nothing like this one”. The COVID-19 pandemic made
2020 an unprecedent and difficult year for all of us. Adding onto the pandemic, the world continued to
suffer the effects of climate change, with unprecedented wildfires, hurricanes, floods and extreme
temperatures.

However, it is not all doom and gloom! The Copernicus programme and its services not only
continued to deliver quality assured free, full and open data, but released new products, organised
many events, increased user uptake and communication activities and even saw a new satellite join
the Sentinel satellite family. They also played a crucial role in the response to the pandemic and in
the continued recovery efforts, as well as being an invaluable ally in the implementation of the
European Union’s ambitious priorities.

As we start 2021, and hope for a brighter and healthier year for all, let’s look at some of the
highlights from 2020.

Reaching new heights
In 2020, the Copernicus programme, its services and the newly created Directorate-General for
Defence Industry and Space (DG DEFIS) increased even further their reach through social media,
media outreach and through the Copernicus Observer.

With a combined following of 157,407 on Twitter, users, journalists, policymakers and the general
public are receiving first-hand information and data on the benefits of the programme, the state of our
environment, concrete examples of Copernicus data-in-action, and much more.
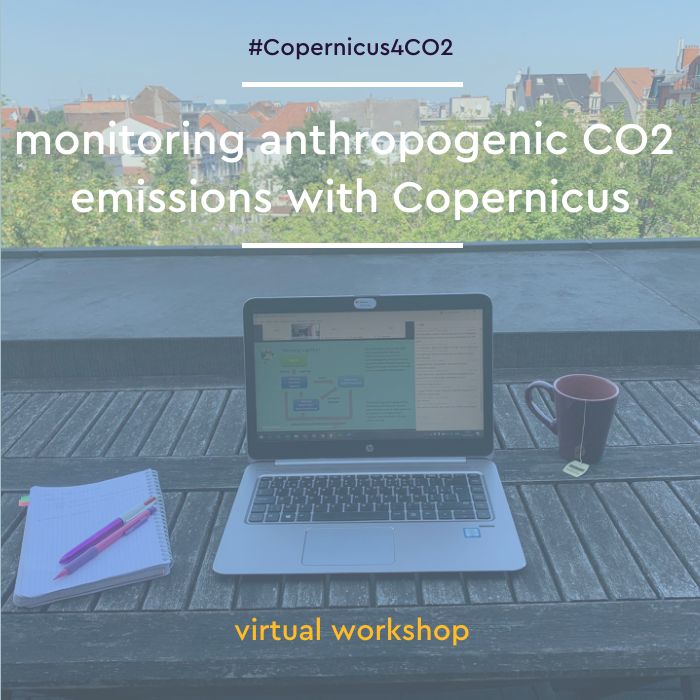
Would you like to join the growing online Copernicus community? Head over to Twitter and follow
these accounts: @CopernicusEU, @CopernicusEMS, @CopernicusECMWF, @CopernicusCMS,
@CMEMS_EU, @eusatcen, @CopernicusLand and @defis_eu.

You can also find the Copernicus programme and some of its services on other social media
platforms such as Facebook, Instagram and YouTube. Here is all the information you need:

Facebook: CopernicusEU, ECMWFcopernicus

Instagram: copernicuseu, copernicusecmwf, copernicuscms

YouTube: the Copernicus YouTube channel, the Copernicus Climate Change and Atmosphere
Monitoring Service and the Copernicus Marine Service.

Social media is important, but so is traditional media. The information and data provided by the
Copernicus services if of interest to all citizens, not just scientists, policymakers and direct data
users. With the effects of climate change increasing and the Copernicus services contributing directly
to the COVID-19 response and impact analysis, media exposure grew even further in 2020.

In 2020, the Copernicus Atmosphere Monitoring (CAMS) and Climate Change services (C3S)
expanded their cooperation with Euronews. In addition to the monthly Climate Now bulletins and
native articles about climate-related topics, Euronews launched live sessions where experts from the
CAMS and C3S answer questions.

You can find the live Q&A sessions here.

Also in 2020, DG DEFIS launched the ‘Image of the Day’, which is targeted towards the traditional
media, but also the general public. It uses Copernicus images to illustrate major global disasters such
as fires, floods and deforestation, but also to showcase the beauty of our planet and some of its
richest ecosystems. Sounds interesting? Head over here and register to receive the daily images
directly in your mailbox.

Last but not least, in 2020, the Copernicus Observer, which you are currently reading, grew even
further with more than 4,500 readers. With a growing audience made up of Copernicus data users,
policymakers, institutional stakeholders and the general public, the Copernicus Observer has become
an essential tool for keeping all interested parties aware of the latest news from the programme and
its services, as well as upcoming and ongoing opportunities (events, trainings, start-up programmes,
etc.).

From physical to virtual, an eventful year
One of the sectors most affected by the pandemic has been the meetings and events sector. While at
first, all events were cancelled or postponed, quite quickly the Copernicus ecosystem adapted, and
all events went virtual. Considering the circumstances, many events, workshops and trainings were
offered, with great results and a wider geographical reach than previous years.

In 2020, three dedicated Copernicus workshops were organised by the European Commission: the
‘Copernicus and Artificial Intelligence’ workshop in January, the ‘Monitoring anthropogenic CO2
emissions with Copernicus’ online workshop in June and finally, the ‘European Ground Motion
Service with Copernicus’ online workshop in October. All three drew substantial interest with a
combined audience of 800 participants from institutions, industry and user communities. If you were
not able to take part in these events, you can find the recordings and presentations on the relevant
event pages linked above.

The online format also offered opportunities to increase the reach and capacity of events. For
example, due to the pandemic, the Copernicus Marine Service had to adapt their training offer and go
virtual. This proved to be a great opportunity to reach even more users, with up to six times more
participants than previous years. You can find out more about this new format here.

The Copernicus Maritime Surveillance Service also increased their online training offering with a new
interactive eLearning course, an online training and an online user group meeting. The eLearning
course is designed for non-remote sensing experts, to better understand CMS, how to access it and
how EO can be used to enhance maritime situational awareness. The training offer and user group
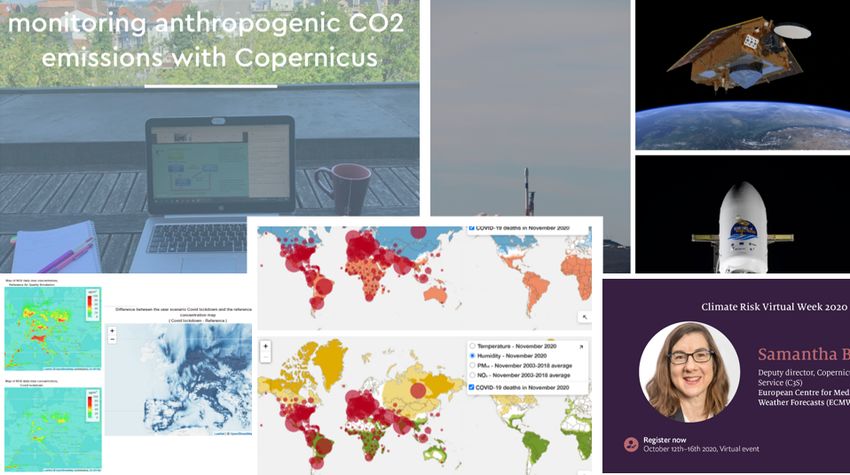
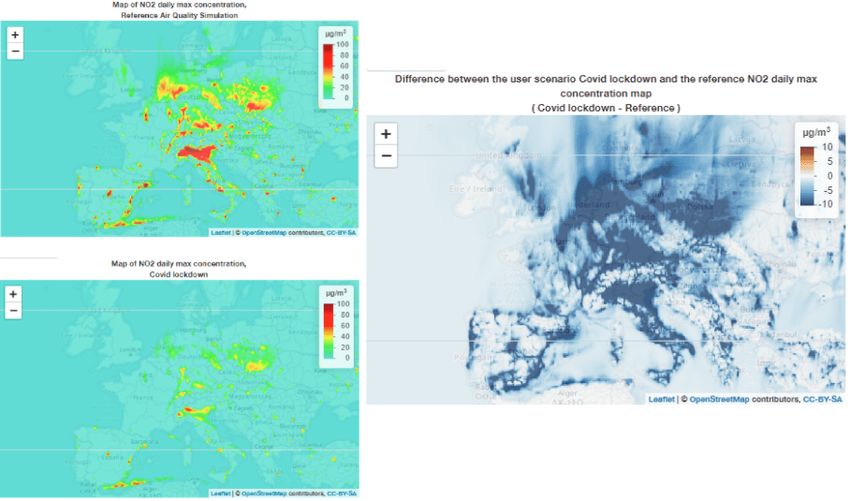
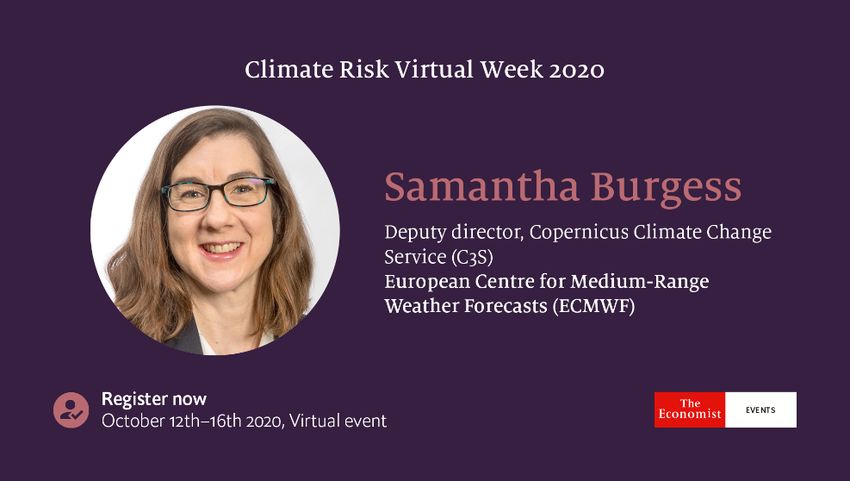
meetings were targeted more towards users or potential users, providing hands-on information on
how to access and use CMS data and web user interface.

At the crossroads between media relations and awareness raising, the Copernicus Climate Change
service took part in an event organised by The Economist during their Climate Risk Virtual Week
(12-16 October). Their session was the second highest attended session out of the whole week.

Deputy Director of the Copernicus Climate Change Service (C3S), Sam Burgess took part in the
‘Mad about Data’ plenary panel during the Climate Risk Virtual Week, organised by The Economist.

Many other events were organised in 2020, including the 4th and final Eyes on Earth Roadshow, the
2020 General Assembly of the Copernicus networks, the 2020 European Space Week and many
more. Did you miss the very first online EU Space Week? Find out what happened here.

Supporting the COVID-19 response and recovery
At the beginning of the pandemic, the Copernicus programme and its services contributed to the
informed and coordinated EU response. Whether by providing information to ensure issues at border
crossings were swiftly resolved allowing European citizens to travel back home and trucks carrying
medicine and essential goods to reach their final destinations. Or by mapping health facilities and
gathering areas to assist Italian disaster response authorities through the Copernicus Emergency
Management Service (Rapid Mapping activation EMSR433).

The Copernicus Services also provided information about the impact of COVID-19 on our
environment (clean waters in Venice and air quality) and the links between climatic conditions and
the spread of the virus.

The Copernicus Atmosphere Monitoring Service (CAMS) set up a dedicated page on air quality in the
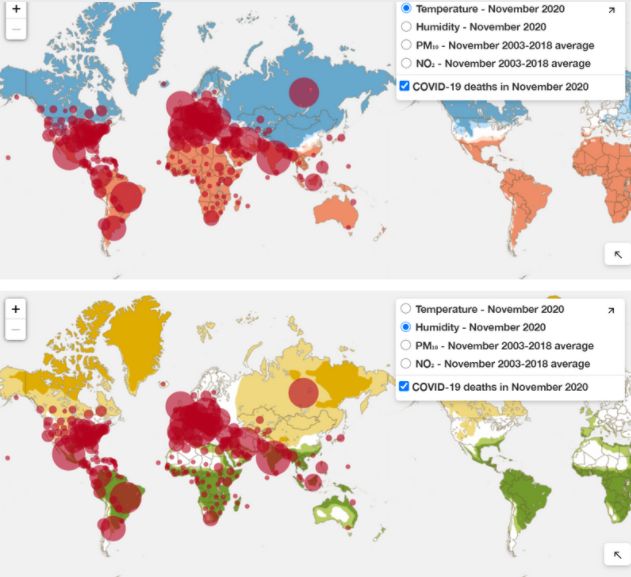
context of the pandemic and local lockdowns. It provides daily maps of the average surface
concentrations of key air pollutants (NO2, PM2.5, PM10 and ozone), daily updated timeseries of key
air pollutants (NO2, PM2.5, PM10 and ozone) that allow to monitor their evolution and possible
trends, and daily updated emissions scenarios for NO2, PM2.5, PM10 and ozone which show the
evolution of air quality in two scenarios: “business as usual” and lockdown.

CAMS NO2 emissions scenario for 16 December 2020: top left ‘business as usual’, bottom left
lockdown and right difference between the two scenarios.

Find out more about their work on air quality in relation to COVID-19 here and here.

The Copernicus Climate Change Service created an application that helps epidemiologists and
health experts explore the potential links between the spread of the virus and climatic parameters
such as temperature and humidity. The temperature and humidity data are mapped against mortality
information from John Hopkins University. The application also includes CAMS air quality data on
NO2 and PM2.5.

Find out how it came about here and how it has evolved since the beginning of the pandemic here.
Top: C3S temperature data for November 2020 overlaid with COVID-19 deaths from John Hopkins
University data. C3S humidity data for November 2020 overlaid with COVID-19 deaths from John
Hopkins University data.

If you would like to know more about how Copernicus helped, you can have a look at the following
Observer articles from April 2020: United Response and COVID-19 and the environment.

The European Commission and the European Space Agency also set up a platform - RACE or the
Rapid Action on Coronavirus and EO – to demonstrate how the use of Earth observation data can
help shed new light on societal and economic changes currently taking place owing to the
coronavirus pandemic.

Copernicus Sentinel-6 Michael Freilich: the newest addition to the
Sentinel satellite family
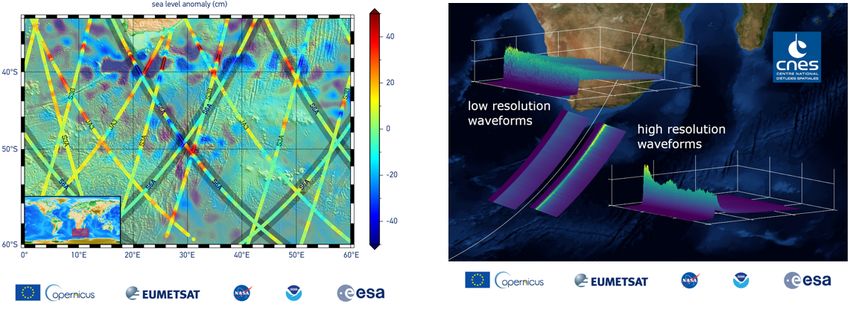
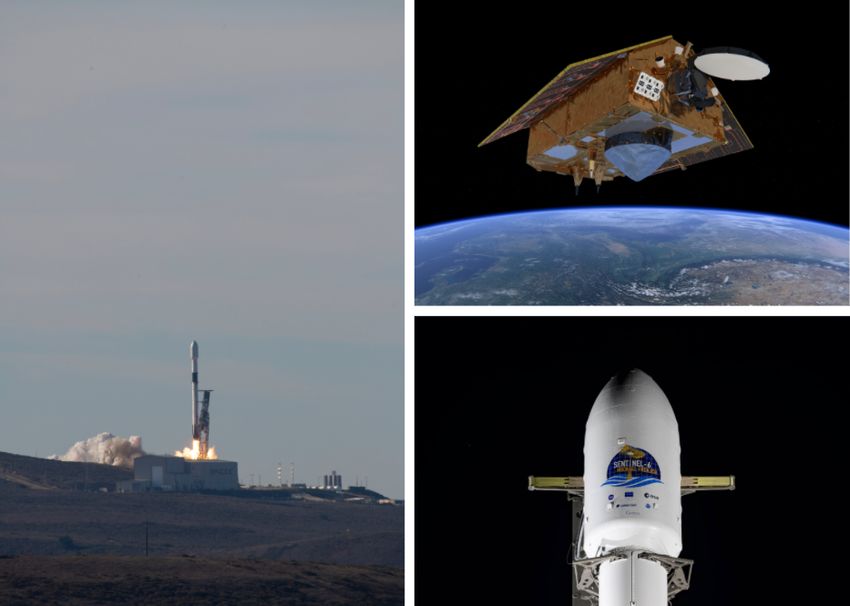
On 21 November, the long-awaited Copernicus Sentinel-6 Michael Freilich was successfully
launched, joining the existing Copernicus Sentinel satellite family.

Sentinel-6 lift off from (ESA), Sentinel-6 artist's impression (ESA) and Sentinel-6 ready for lift-off
(SpaceX).

The fruit of an extraordinary Europe-US cooperation involving the European Commission, ESA,
EUMETSAT, NASA and NOAA, with support from CNES, Sentinel-6 Michael Freilich is a crucial
addition to the Copernicus programme.

Sentinel-6 will take over from the Jason satellite series (built and operated in cooperation
between NASA, CNES and NOAA, and later on EUMETSAT, with funding from the EU) to guarantee
continuity in highly accurate sea level measurements and ensure that climate records are updated for
decades to come.

Several of the Copernicus Services will benefit from Sentinel-6 data. For example, most of the
Copernicus Marine Service’s applications require a higher resolution description and forecast of the
ocean state. An impressive 60% of the Copernicus Marine Service’s observation and modelling
products will be improved and it will also contribute to reducing the uncertainty of ocean sea level
forecasts by about 10 to 20%. Want to know more about how it will improve ocean monitoring? Head
over here.

On 10 December, during the European Space Week, the first data images from Sentinel-6 were
released. As reported by Alain Ratier, Director-General of EUMETSAT, Sentinel-6 seems to be
                                   healthy and its data are so far consistent with data from the other Copernicus altimetry missions
                                   Jason-3 and Copernicus Sentinel-3. The first two data images show sea level anomaly and
                                   waveforms.

                                   Left: the image shows the Sentinel-6 sea level anomaly data, overlaid on a map showing the similar
                                   products from all of the Copernicus altimetry missions – Jason-3, Sentinel-3A and -3B. Left: the
                                   image shows the basic radar measurements, called waveforms, collected by the altimeter. The shape
                                   of these waveforms not only allows the height of the sea level to be determined but also the height of
                                   ocean waves and the wind speed over the ocean surface.

                                   Find out all there is to know about Sentinel-6 here.

                                   Tune in next week to find out the key 2020 highlights from our 6 services in terms product
                                   releases and updates, new data access tools and more.

                                   Happy 2021 to all our readers!

Powered by TCPDF (www.tcpdf.org)
You can also read