AP Biology 2021 Summer Assignment
←
→
Page content transcription
If your browser does not render page correctly, please read the page content below

AP Biology 2021 Summer Assignment

Welcome to AP Biology
AP Biology is equivalent to a two semester introductory college biology course. This course
requires a lot of independent work/reading. In this class you will be assessed based on your
understanding of the material and not just on your ability to memorize the information. Of course
that is not to say that memorization is not part of the course, because it is. Along with
memorization there needs to be understanding. In this course you will be required to apply the
information covered to various situations.
The summer assignment is meant to review concepts that have been covered in previous courses
in preparation for AP Biology.
Please make sure you read each section completely.
This assignment will be due the first day of class. All assignments turned in late will lose
points. Points will be deducted for each day the assignment is late.
Please Do Not staple assignment #2 and #3 together. You will be turning them in
separately.
Please complete this assignment independently and do your best.
Enjoy your summer and if you have any questions email me at pfox@eustace.org

Mrs. Fox

                                                                                                1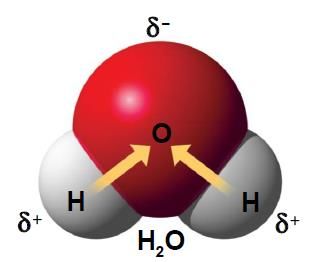
Assignment #1:
Laboratory work is an important part of the AP Biology curriculum. You will be keeping a
laboratory notebook for this course. So one of your assignments this summer is to purchase a
bound composition notebook (example below – it cannot be a spiral notebook). You will be
required to have this on the first lab day. It will be worth 5 points of your first lab grade.

Assignment #2: Graphing, Data Analysis, and Experimental Design
Being able to generate appropriate data tables and graphs, and being able to correctly analyze
data will be an important component of this course. Therefore, it is imperative that you know
how to represent experimental data correctly and to interpret experimental results and draw
appropriate conclusions. The following activities will help to prepare you for this.

Your assignment can be typed or neatly handwritten (points will be deducted for handwritten
work that is not neat and/or difficult to read). For this assignment you must use graph paper to
hand draw your graph, no computer generated graphs will be accepted for credit – you must
prepare your OWN graphs – no copies of other students’.

NOTE: The last page of this assignment is a printable graph paper page you can use if you
      do not have graph paper.

Assignment #2 will be graded for correctness.

You will be quizzed on this material as well as Chapter 2 within the first 2 weeks of school.
You are also responsible for understanding this material. The information in this section
will be used throughout the entire school year on labs, in class assignments, and on quizzes
and tests.

Rules and Tips for Graphing:
1. Graphs must be either hand-drawn on graph paper only or use Excel. Use a pencil to draw
   your graph. It’s easier to fix mistakes.
2. Always draw lines with a ruler. Do not freehand.
3. Make sure Independent Variable is on the X-axis and Dependent Variable is on the Y-axis.
                                                                                                 2
4. Include all parts:
a. Title - must be descriptive title (not “Graph 1”)
It tells the reader what the graph is representing – the title should include enough
information so that, independent of any other information, the reader can
understand what is being shown.
b. Label the axes (x and y) with what was being measured and the units used.
5. Scale your axes uniformly – pay especially close attention to this if you are using computer-
generated graphs. For example, if you have three data points, at 0, 25 and 100 seconds, 25
should not be halfway between 0 and 100, it should be in the correct place.
6. If you are graphing multiple subjects, use different colored or patterned lines and explain what
they are in the legend (or key).
7. Choose an appropriate graph to explain your data. Examples:
a. LINE: Measuring a change in something over time - used when the independent variable is
continuous. A continuous variable is capable of having values over a continuous
range (i.e. anywhere between those that were used in the experiment). For example,
temperature, pH, volume, time are continuous. You can connect the points or draw a
smooth curve (not necessarily connecting the points) that represents the data.
b. BEST-FIT LINE: must be used when a rate (slope) needs to be calculated. Plot your
points, then using a ruler, draw a line that best represents those points. The line does
not have to pass through the points. When calculating the slope of the line, use
points on the line, NOT your actual data points. If using Excel, a best-fit line and
slope can be automatically given to you.
c. BAR: Comparing individuals to each other with only one data point - use when the
independent variable is discrete (it cannot have intermediate values between those
measured). A bar graph compares individuals to each other with only one data
point, for example, comparing leaf sizes in three different trees.
d. PIE: Show percentages that add up to 100%.
Statistical terms you should be familiar with:
MODE = value that occurs most frequently in a data set
The mode for a group of values is the number that occurs most frequently. e.g. 2, 5, 8, 2,
6, 11 The number 2 is the mode because it occurred most often (twice)
MEDIAN = middle value that separates the greater and lesser halves of a data set
To determine median or “middle” for an even number of values, put the values in
ascending order and take the average of the two middle values. e.g. 2, 3, 4, 5, 9, 10 Add
4+5 (2 middle values) and divide by 2 to get 4.5
MEAN = sum of all data points divided by the number of data points
To determine the mean for a group of variables, divide the sum of the variables by the
total number of variables to get an average.
RANGE = value obtained by subtracting the smallest observation (sample minimum) from the
greatest (sample maximum). The range is the simplest measure of variability and is
the difference between the largest and smallest values in a set of data.
3Part A: Constructing Graphs
The following video reviews the different types of graphs and how to construct a graph.
http://www.bozemanscience.com/beginners-guide-to-graphing-data
Answer the following question while watching the above video:
1. Why do we use graphs?
2. What are the 5 important things that must be included on a graph? Please provide an
explanation of each item or their significance to the graph.
3. Two plants were placed at different depths in a pond and the number of oxygen bubbles
each produced per minute was measured.
a. Plot a graph representing the data on graph paper (graph must be hand drawn for this
assignment - no computer generated graphs will be accepted for credit). Be sure to give it a
title, correct X and Y axis with correct variables and scales, and legend. The following
video reviews graphing by hand:
http://www.bozemanscience.com/graphing-data-by-hand
b. What is the dependent variable? __________________________
c. What is the independent variable? _________________________
4d. What are the mean and median of all 3 columns of data?
Depth: Mean____________ Median ___________
Bubbles Plant A.: Mean ____________ Median_________
Bubbles Plant B: Mean ____________ Median_________
e. Determine the rate of oxygen bubble production for each plant by calculating the slope of
each best-fit line. Show all work.
f. Based on your calculations, which plant had the highest rate of oxygen production?
Part B: Experimental Design Negative and Positive Copntrols
Some of the components expected for Experimental Design in AP Biology will be new to you. It
is important that you have an understanding of these concepts as you begin the course. Watch the
following videos and answer the questions.
Video # 1: Experimental Design Negative Controls
https://www.youtube.com/watch?v=KXOvPVc6zeE
1. This video talks about negative controls. What does it say the negative control allows for?
2. What is the consequence of not having a negative control?
53. Why must one of the control groups in this experiment drink decaffeinated coffee instead of
water?
4. Why does another control group drink water?
5. A proper set of negative controls is critical to determine what?
Video #2: Experimental Design Positive Controls
https://www.youtube.com/watch?v=ZHTqxczEY6Y
1. According to the video, what is the purpose of using a positive control?
2. What two positive control groups are added to the experiment?
3. Is an experiment successful based on results matching original predictions? If not, explain
what makes an experiment successful.
6Part C: Designing Experiments
Answer this section on a separate sheet of paper. May be typed or neatly handwritten.
Experiments must be set up and performed in such a way that the results help to answer a
particular question, and to either prove or disprove a hypothesis. The correct way to set
up an experiment is as a controlled experiment. In a controlled experiment, there are at
least two set-ups. The first one is called the control group and should represent the
normal conditions. The second is called the experimental group and can vary from the
control by only one variable.
For example, if you wanted to test the effect of sunlight on plant growth, you could set up the
following:
Control Group Experimental Group
Bean plant Bean plant
Normal amount of soil, water Normal amount of soil, water
Room temperature Room temperature
Under normal light/dark cycles Under continuous light
The variable is the amount of light. By having only one variable, at the end of the experiment,
you will know that any differences in the two plants are due to the difference in light and nothing
else. If you wanted to test the effect of different amounts of water, you would have to set up a
separate experiment.
For the scenario below, do the following:
a. Come up with a hypothesis that you can either prove or disprove experimentally.
b. Design an experiment - give a detailed list of the conditions in your control group and in your
experimental group. Make sure there is only one variable.
c. Make up some data and represent it in a data table.
d. Draw a conclusion based on your data.
A new dog food (Mighty Meal) has been designed, specifically for dogs with kidney problems.
A veterinarian wants to test this new food to see if it really improves the dogs’ health. One
accurate measurement of kidney function is a blood test which measures creatinine, a substance
usually excreted in urine. The following table shows the severity of kidney disease as it relates
to creatinine levels in the blood:
Kidney status Creatinine level (mg/dL)
Normal 1.6
Mild disease 2.0
Moderate disease 2.0-5.0
Severe disease > 5.0
Design a controlled experiment to test the effectiveness of Mighty Meal in improving dogs’
kidney health.
7Assignment #3: Chapter 2 – The Chemical Context of Life
An understanding of chemistry is one of the requirements for this course. We will start off the
year with a review of fundamental concepts that were covered in Chemistry. This part of your
summer assignment will be a review of basic chemistry. The information in this section comes
from chapter 2 of the biology book you will be using. Unfortunately, at this time I cannot give
you the textbook but posted along with this assignment are the PowerPoint slides from the
textbook for chapter 2. Along with the slides you can use your old biology or chemistry notes to
help you out as well as the internet.
I will collect this section and check it for completion. The answers will be posted/given within
the first week of school. I will review the material on the first day or two of class. You will be
quizzed on this material as well as the graphing and data within the first 2 weeks of school.
You are also responsible for understanding this material for the Unit 1 Test.
Your assignment can be typed or neatly handwritten (points will be deducted for handwritten
work that is not neat and/or difficult to read). You can print out assignment #3 and write your
answers directly on this document. Do Not just copy definitions or sentences from the slide or
other resources that you use. Putting answers into your own words will help you understand the
material.
Concept 2.1
1. Define the following terms:
a. matter
b. element
c. compound
2. What is the difference between an essential element and a trace element?
Concept 2.2
3. Define the following terms
a. neutron
b. proton
8c. electron
d. atomic mass
e. atomic number
f. isotope
g. Energy
h. Potential energy
i. Energy level or electron shell
4. Below is a sketch of an atom of helium, label the electrons, protons, neutrons, and atomic
nucleus.
5. Consider the entry in the periodic table for carbon.
What is the atomic mass? _____ What is the atomic number? _____
How many electrons does carbon have? _____ How many neutrons? _____
6. Explain radioactive isotopes and give one application in biological research.
97. Explain which has more potential energy in each pair:
a. the child at the top of a slide/the child at the bottom
b. electron in the first energy shell/electron in the third energy shell
Concept 2.3
8. Define the following:
a. Molecule
b. Covalent bond
c. Electronegativity
d. Ionic bond
e. Anion
f. Cation
g. Hydrogen bond
9. Now, refer back to your definition of a compound and fill in the following chart:
Molecule? Compound? Molecular Structural Formula
(Y/N) (Y/N) Formula
Water
Carbon
Dioxide
Oxygen
1010. Explain the difference between a nonpolar covalent bond and a polar covalent bond.
11. Below is an electron distribution diagram of water.
a. Which element is most electronegative?
b. Why is water considered a polar molecule?
12. Explain van der Waals interactions. Though they represent very weak attractions, when these
interactions are numerous they can stick a gecko to the ceiling!
Concept 2.4
13. Define the following:
a. Chemical reactions
b. Reactants
c. Products
11Concept 2.5
14. Define the following terms:
a. Polar molecule
b. Hydrogen bond
c. Adhesion
d. Cohesion
e. Surface tension
f. Specific heat
g. solution
h. solute
i. solvent
j. aqueous solution
k. hydrophobic
l. hydrophilic
m. Hydrogen ion
n. Hydroxide ion
o. Hydronium ion
p. Acids
q. Bases
r. Buffers
1215. How many hydrogen bonds can a single water molecule form?
16.Which is demonstrated when you see beads of water on a waxed car hood?
Circle the correct answer: adhesion or cohesion
17. Summarize how water’s high specific heat contributes to the moderation of temperature.
How is this property important to life?
18. Explain why ice floats. Why is 4°C the critical temperature?
19. Consider what would happen if ponds and other bodies of water accumulated ice at the
bottom. Describe why this property of water is important.
1314
You can also read