About the surface area to volume relations of open cell foams - KIT
←
→
Page content transcription
If your browser does not render page correctly, please read the page content below
Engineering Research Express

PAPER • OPEN ACCESS

About the surface area to volume relations of open cell foams
To cite this article: A August and B Nestler 2020 Eng. Res. Express 2 015021

View the article online for updates and enhancements.

                              This content was downloaded from IP address 141.52.96.80 on 14/02/2020 at 12:36
Eng. Res. Express 2 (2020) 015021 https://doi.org/10.1088/2631-8695/ab6ac6
PAPER
About the surface area to volume relations of open cell foams
OPEN ACCESS
A August and B Nestler
RECEIVED
28 October 2019
Karlsruhe Institute of Technology (IAM), Haid-und-Neu-Str. 7, 76131 Karlsruhe, Germany
REVISED
E-mail: anastasia.august2@kit.edu
8 January 2020
Keywords: open cell foams, surface area, solid fraction, algorithmically generated porous area
ACCEPTED FOR PUBLICATION
13 January 2020
PUBLISHED
23 January 2020 Abstract
Many useful applications of solid open-cell foams make use of their enormous surface, compared to
Original content from this
work may be used under
their volume. The large surface is accompanied by a large interface between foam and filling of a fluid,
the terms of the Creative gas or another solid forming a composite material. Due to the large interface, heat exchange between
Commons Attribution 4.0
licence. the involved materials takes place in a particularly efficient manner making open cell metallic foams to
Any further distribution of base materials for heat exchange and heat systems of increasing importance. But what is the
this work must maintain
attribution to the mathematical connection between the solid bulk volume fraction and the surface of these porous
author(s) and the title of materials? This question is investigated through the evaluation of 5000 synthetic, randomly generated
the work, journal citation
and DOI. open-cell cellular structures of different material ratios.
1. Introduction
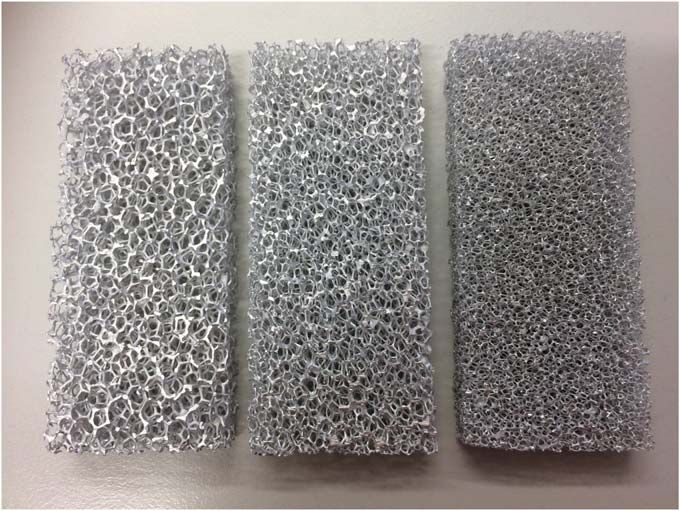
Open-pored solid foams are excellent candidates for composite materials. They can be infiltrated with other
substances and thus combined with different materials. Compared to their volume, open-cell solid foams (e. g.
figure 1) have a very large surface which allows a large contact area between the matrix and the filling in the
m2
composite. Usually, this ratio is referred to as exchange surface and is measured in m3 .
The specific surface of open cell metal foams has been investigated since decades. Gibson and Ashby (1997)
[1] model the geometry by different polyhedrons to derive an analytical description of the surface and other
parameters of open cell solid foams. Fourie and Du Plessis (2002) [2] derive a simplistic tortuosity-based model
for the specific surface area of high porous metal foams in the context of a prediction of the pressure drop for
Newtonian fluids flowing through the foam. Ozmat, Lead and Benson (2004) [3] report analytical expressions
through mathematical modeling and experimental studies of reticulated aluminum foams to describe the
conductive and convective aspects of energy transfer in porous media. The authors use dodecahedrons with
triangle cross section of the edges. The ligament size is obtained from an iterative solution of the volume
equation of these dodecahedrons. The specific surface area is also measured by means of multipoint Brunauer,
Emmett and Teller (BET) method [4]. Giani, Groppi and Tronconi (2005) [5] characterize the mass transfer in
foams as supports for structured catalysts and approximate the ligament thickness, the specific surface and
volume of samples by means of the cubic cell model proposed by Lu, Stone and Ashby [6]. The authors propose a
correlation of specific surface, a kind of pore diameter and the porosity. This model seems to be appropriate for
aluminum foams of porosities in the range of 0.88–0.96. Garrido et al (2008) [7] determine pore sizes, strut
diameters, void fractions and geometric surface areas of ceramic foams of 10–45 ppi and 0,75–0,85 valued
porosity by a combination of microscopic imaging, mercury porosimetry and magnetic resonance imaging.
Dietrich et al (2009) [8] experimentally investigate the pressure drop through different ceramic foams and
measure the specific surface area by means of MRI. Kopanidis et al (2010) [9] simulate flow and heat transfer at
the pore scale level of high porosity aluminum open cell foams. The authors set the pore and the ligament
thickness in advance and calculate the porosity and the specific surface area of the simulation domain. They
compare their results with the ERG Duocel values [10] and find large deviations. Inayat, Freund, Zeiger and
Schweizer (2011) [11] investigate silicon carbide foams regarding window and strut diameters, open porosities
and specific surface areas by means of image analysis, CT, He-pycnometry and mercury intrusion.The authors
use the tetrakaidecahedron geometry and take different strut morphologies into account. They also derive
© 2020 The Author(s). Published by IOP Publishing LtdEng. Res. Express 2 (2020) 015021 A August and B Nestler
Figure 1. Aluminum open pore metal foams.
analytical correlations of the geometric parameters and validate them by own and cited experimental
measurements. Inayat, Freund, Schwab, Zeiger and Schweizer (2011) [12] determine the specific surface area
and pressure drop in reticulated ceramic foams of different ppi and porosities for foams used as catalyst support.
The authors approximate the geometry analytically by tetrakaidecahedrons to derive the correlation of the strut
thickness, the porosity and the specific surface area. Results are compared with own and foreign experimental
data gained by image analysis, He-pycnometry, Ng-intrusion, x-ray CT. In the review article of De Schampeleire
et al (2016) [13] experimental and computational fluid dynamics for thermal applications are discussed. They
characterize open cell metal foams using micro tomography (μCT) scans with small voxel size. The authors
identify large differences to other literature reports. Ambrosetti et al (2017) [14] analytically estimate the specific
surface area of a wide range of porosities for a revaluation of published mass transfer data as application. The
authors use Kelvin cells approximated with a tetrakaidecahedrons with four struts converging in each node
according to Plateau rules forming an angle of 109,47 degree. Mathematical C1 continuity of the lateral surface
profile of the struts is assumed.
In most articles, large deviations of the predicted correlation among different works and in comparison with
the experimental data are conspicuous. In this work, we employ a structure generation algorithm [15] to create a
number of thousands of synthetic open pore structures with parameters related to real foams and systematically
investigate the correlation between the ligament thickness, the metal fraction and the exchange surface area.
Figure 2 demonstrates such a synthetic foam sample.
2. Methods
In our recent article [15], a method to create synthetic open porous structures is presented by setting geometrical
parameters such as the mean pore radius and the mean ligament radius. Also the volume fraction and the surface
area of solid can be determined by means of appropriate post processing tools. Using this filling algorithm, we
generate several hundreds of open cell structures (see e.g. figure 2) and investigate the dependence of the
exchange surface area in a fixed but representative volume element on the ligament thickness and on the volume
fraction of the foam samples.
The variation of the volume fraction is reached by changing both the ligament thickness as well as and the
pore radius.
Our algorithm to create random synthetic pore structures is in detail described in [15]. We briefly outline the
main steps of the algorithm. Imaginary balls are randomly set into the domain in as compactly as possible. The
coordinates of their center points are stored. These coordinates serve as basis for the 3D-Voronoi-
decomposition of the domain. The surroundings of the area where three or more polyhedrons meet, become
ligaments of the open pore foam model. The thickness of the ligaments can be set in advance.
2Eng. Res. Express 2 (2020) 015021 A August and B Nestler
Figure 2. A synthetically generated open pore foam sample.
Figure 3. Exchange surface area as a function of solid fraction in synthetic open foam samples for ligament radius of 0.1 mm and for
different ligament radii r.
3. Simulation results and their comparison with experimental measurements and
predictions
For each ligament thickness and mean pore radius, we produced at least 200 synthetic specimens and calculated
their volume and surface. Figures 3–7 show the results of exchange surface area for foams with different, but
constant ligament thickness. The diagrams further include the fitted functions.
In table 1, we provide the fitted functions used for plotting curves in figure 3–7. The fit functions are
obtained in the following way: we identify the maximum of our dataset for the given ligament thickness. The
metal fraction for which the maximum value of the exchange surface is arrived, is called ‘the optimal metal
3Eng. Res. Express 2 (2020) 015021 A August and B Nestler
Figure 4. Exchange surface area as a function of solid fraction in synthetic open foam samples for ligament radius of 0.2 mm and for
different ligament radii r.
Figure 5. Exchange surface area as a function of solid fraction in synthetic open foam samples for ligament radius of 0.3 mm and for
different ligament radii r.
fraction’. We fit the dataset for fractions below this value by means of ax 2 + bx and for above this value by
means of cx 2 + dx + e” using the command line program gnuplot, which in turn uses the nonlinear least-
squares (NLLS) Marquardt-Levenberg algorithm [16]. Please note the coefficients of the x2 term, which are four
to five times higher in the last column than in the middle one.
In figures 8–10, experimental, analytical and combined values from the literature are compared with the
results of our models. The term ‘combined values’ means that some parameters (e.g. the ligament thickness) are
obtained by means of mathematical modeling and the correlated parameters (e.g. the exchange surface area) are
4Eng. Res. Express 2 (2020) 015021 A August and B Nestler
Figure 6. Exchange surface area as a function of solid fraction in synthetic open foam samples for ligament radius of 0.4 mm and for
different ligament radii r.
Figure 7. Exchange surface area as a function of solid fraction in synthetic open foam samples for ligament radius of 0.5 mm and for
different ligament radii r.
experimentally measured. Partly significant deviations of some values are reported in investigations on the
exchange surface of open cell solid foam, see e.g. [9]. The reason can be, on the one hand, the limited amount of
samples which can be measured experimentally accompanied with large statistic errors. On the other hand,
mathematical models often work with simplifying assumptions and cannot always take in account the
randomness of the pore distribution and pore geometry. The current simulation study treats lots of samples
Each sample is created with a random arrangement of the pores, to make every structure individual.
5Eng. Res. Express 2 (2020) 015021 A August and B Nestler
Figure 8. Current models in comparison with experimental values of [7, 10, 13] and [8]. The ligament thickness (in mm) is given in
brackets.
Table 1. Fitted functions for the exchange surface area of open foams for different mean ligament thicknesses.
ligament radius for metal fraction less than the optimal metal
in [mm] fraction for metal fraction larger than the optimal metal fraction
0.1 -0.856x 2 + 130.346x -3.529x 2 + 462.444x - 10 343.7
0.2 -0.617x 2 + 95.665x -3.133x 2 + 426.864x - 10 934.1
0.3 -0.423x 2 + 68.520x -1.927x 2 + 257.424x - 5 962.55
0.4 -0.326x 2 + 56.872x -1.307x 2 + 169.499x - 3 263.55
0.5 -0.287x 2 + 48.053x -1.258x 2 + 169.033x - 3 826.85
For validation, we valuate CT-data of 150 open pore aluminum foam samples each of 1 cm3. We calculate
their exchange surface area depending on their solid fraction. The results are compared with our models for
foams with constant ligament radius of 0.25 mm and 0.32 mm in figure 11. The small deviation can be put
down to the fact that real samples have no throughly constant ligament thickness. The thickness naturally varies
from one sample to another sample and even inside of the samples.
4. Discussion
Figures 3–7 show that the maximum exchange surface area decreases with the growing ligament radius. For
thicker ligaments, their surface-volume ratio is inversely proportional to their thickness. This results from the
following consideration: if the shape of the ligament is approached by the perfectly cylindrical shape, the ratio
2prh 2
between the lateral surface of the cylinder and the cylinder volume results in pr 2h = r , where r denotes the
radius and h the height of the cylinder.
Otherwise, the curves show a similar course for each ligament thickness: for the metal ratio, which is below
m2
20% of the volume ratio, the ascent of the surface (measured in m3 ) is an almost linear function of the volume
ratio (measured in %). For an amount of metal ratio within the range of 20% to 60%, the ascent can be described
by a parabola opening downwards. Metal foam fractions greater than or equal to 60% result in a descent of the
exchange surface. This descent is four to five times faster than the ascent between 20% and 60% metal fraction
(see also table 1).
In the following, we give an explanation for this descent.
6Eng. Res. Express 2 (2020) 015021 A August and B Nestler
Figure 9. Current models in comparison with experimental and analytical values of [3, 12] and [11]. The ligament thickness (in mm)
is given in brackets.
Figure 10. Current models in comparison with analytical values of [1, 5, 9, 14] and [2]. The ligament thickness (in mm) is given in
brackets.
For a constant ligament thickness, the increase of the metal amount is reached by decreasing the mean pore
radii. For smaller pore radii, however, more pores fit into the domain, which results in more ligaments than for
structures with larger pores. As a consequence, the surface is larger, which is referred to as the pore-number-
ascent-effect. On the other hand, however, smaller pore radii are accompanied by a decrease of the length of the
ligaments, which happens at the expense of the numerous knots. As the ligaments meet in the knots, the knots
have a very small free surface, compared to their volume. This encourages the reduction of the exchange surface
area. We denote this phenomenon by more-knots-less-area-effect. When the metal fraction is at around 60%, the
7Eng. Res. Express 2 (2020) 015021 A August and B Nestler
Figure 11. Exchange surface area in synthetic open foam samples for constant ligament radii of 0.25 mm and 0.32 mm. The values for
150 experimental samples (gained by CT) are included.
Table 2. Approximate values of the maximum possible exchange surface area of
open foams for different mean ligament thicknesses.
Ligament radius
in [mm] 0.1 0.2 0.3 0.4 0.5
Maximum exchange 4800 3500 2600 2200 1800
⎡ m2 ⎤
surface in ⎣⎢ 3 ⎦⎥
m
more-knots-less-area-effect outweighs the pore-number-ascent-effect and leads to an advanced reduction of the
exchange surface area, with a simultaneous increase of the metal fraction. This behavior occurs for all examined
ligament thicknesses, as can be seen in figures 3–7.
From this consideration and the respective curves in the diagrams, the optimal volume fraction of the solid
can be specified for the maximum exchange surface area: it is between 60 and 65%. 60% corresponds to smaller
mean ligament thicknesses, whereas 60% till 65% is observed for larger mean ligament thicknesses).
For our foam models, the approximate values of the maximum possible surface areas are summarised in
table 2.
5. Conclusions
We investigate the dependence of the exchange surface area on the volume fraction of the solid. For this purpose,
we evaluate 5000 synthetically generated structures and compare the results with available experimental
measurements. For all observed ligament thicknesses, the results initially show that there is an ascent of the
exchange surface area with an increasing volume fraction of the solid. For a metal fraction of 60 to 65%,
however, the ascent is joined by a descent of the exchange surface area, which is progressing four to five times
faster than the previous ascent. The reason for this is the interaction between the pore-number-ascent-effect and
the more-knots-less-area-effect, which was discussed in section Discussion. We conclude that a maximal surface
for constant metal fraction is obtained for ligaments as thin as possible. We could show that for ligament radii
between 0.1 mm and 0.5 mm , the maximum exchange surface area is achieved for metal volume fraction of 60
to 65%.
8Eng. Res. Express 2 (2020) 015021 A August and B Nestler
Acknowledgments
The work was carried out partly supported by the Helmholtz program ‘EMR’ and partly by the ZAFH project
‘InSeL’ funded by the Baden-Wuertthemberg Stiftung and EFRE (European Regional Development Fund). We
also thank the Helmholtz IVF Project ExNet-0033 for the financial support. The authors further acknowledge
M Selzer for his support in pre- and postprocessing and M Rölle for developing the filling algorithm, which we
extensively use for our investigations.
Compliance with ethical standards
The authors declare that they have no conflict of interest. Our research does not involve human participants or
animals.
Conflict of Interests
The authors declare that there is no conflict of interest.
ORCID iDs
A August https://orcid.org/0000-0002-1052-6079
References
[1] Gibson L J and Ashby M F 2014 Cellular Solids: Structure and Properties (Cambridge: Cambridge University Press) (https://doi.org/
10.1017/CBO9781139878326)
[2] Fourie J G and Du Plessis J P 2002 Pressure drop modelling in cellular metallic foams Chem. Eng. Sci. 57 2781–9
[3] Ozmat B, Leyda B and Benson B 2004 Thermal applications of open-cell metal foams Mater. Manuf. Processes 19 839–62
[4] Brunauer S, Emmett P H and Teller E 1938 Adsorption of gases in multimolecular layers JACS 60 309–19
[5] Giani L, Groppi G and Tronconi E 2005 Mass-transfer characterization of metallic foams as supports for structured catalysts Ind. Eng.
Chem. Res. 44 4993–5002
[6] Lu T, Stone H and Ashby M 1998 Heat transfer in open-cell metal foams Acta Mater. 46 3619–35
[7] Garrido G I et al 2008 Mass transfer and pressure drop in ceramic foams: a description for different pore sizes and porosities Chem. Eng.
Sci. 63 5202–17
[8] Dietrich B et al 2009 Pressure drop measurements of ceramic sponges–determining the hydraulic diameter Chem. Eng. Sci. 64 3633–40
[9] Kopanidis A et al 2010 3D numerical simulation of flow and conjugate heat transfer through a pore scale model of high porosity open
cell metal foam Int. J. Heat Mass Transfer 53 2539–50
[10] ERG Co., Duocel Metal Foams, (http://www.ergaerospace.com)
[11] Inayat A et al 2011 Determining the specific surface area of ceramic foams: the tetrakaidecahedra model revisited Chem. Eng. Sci. 66
1179–88
[12] Inayat A et al 2011 Predicting the specific surface area and pressure drop of reticulated ceramic foams used as catalyst support Adv. Eng.
Mater. 13 990–5
[13] De Schampheleire S et al 2016 How to study thermal applications of open-cell metal foam: experiments and computational fluid
dynamics Materials 9 94
[14] Ambrosetti M et al 2017 Analytical geometrical model of open cell foams with detailed description of strut-node intersection Chem.
Ing. Tech. 89 915–25
[15] August A et al 2015 Prediction of heat conduction in open-cell foams via the diffuse interface representation of the phase-field method
Int. J. Heat Mass Transfer 84 800–8
[16] Williams T et al 2016 an interactive plotting program (http://gnuplot.sourceforge.net/docs_4.2/node82.html)
9You can also read