High Resolution Regional Climate Modelling in Support of Climate Change Adaptation in Ontario
←
→
Page content transcription
If your browser does not render page correctly, please read the page content below
High Resolution Regional Climate Modelling
in Support of Climate Change Adaptation in Ontario

 Dr. Jinliang (John) Liu
 Senior Science Advisor on Climate Change
 Ministry of the Environment, Conservation and Parks

 Presented as part of the Ontario RAC Webinar Series hosted by OCCIAR
 September 06, 2018
Acknowledgements
• All academic partners, especially
 Prof. H. Zhu Prof. G. Huang Prof. R. W. Peltier
 Dr. X. Qiu (NOVUS) Dr. X. Wang …
 Dr. Z. Deng Dr. X. Zhou …

 York University University of Regina University of Toronto

 Combined Dynamic & Combined Dynamic
 downscaling Downscaling Downscaling

• Developers of other data sources used
 CMIP5, PCIC, NA-CORDEX (including OURANOS projections)

• Technical advisors
 ECCC, OURANOS, MNRF
 2
Outline
• Why is Ontario-specific high resolution regional
 climate modelling needed?
• What Ontario-specific climate data is currently
 available?
• Why are they unique?
• Examples of where they have been used
• Live Demonstration of the Ontario Climate Data
 Portal (OCDP).

 3
Why Is Ontario-Specific Climate Data Needed?

• Ontario’s climate is unique and is changing over time.
• Adaptation occurs at the community level which requires local scale information.
• Ontario-specific climate data are critical to our understanding of the potential
 impacts of climate change in the province.
 Global Temperature Change Ontario’s Changing Temperature
 3.0

 2.5

 Annual Average Temperatures (°C)
 2.0

 1.5

 1.0

 0.5

 0.0

 -0.5

 -1.0

 -1.5

 -2.0
 1900 1920 1940 1960 1980 2000

https://data.giss.nasa.gov/gistemp/graphs/graph_data/Global_Mean_Estimates_based_on_Land_and_Oc Analysis is based on historical data from
 ean_Data/graph.png http://data.ceda.ac.uk/badc/cru/data/cru_ts/cru_ts_4.01/data/tmp/

 4
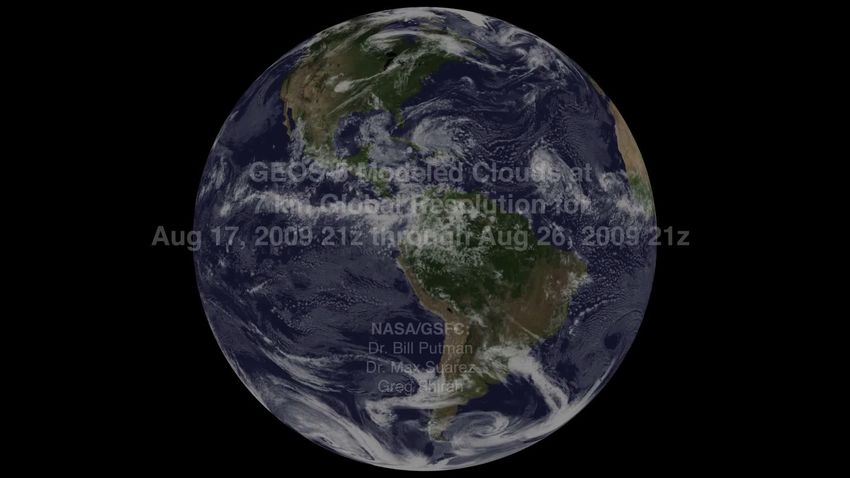
Spatial Variation in Climate Change at Regional/Local Scale
 Driven by Local Geophysical Features

 Animation: http://svs.gsfc.nasa.gov/cgi-bin/details.cgi?aid=3657 5
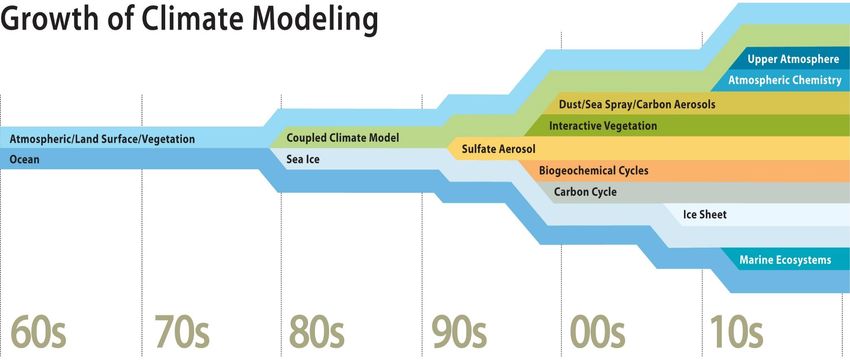
Climate Models
• Developed based on current understanding of the climate system
• Used to further understand the past, current and future climate
• Global Climate Models (GCMs) vs. Regional Climate Models (RCMs)

 Evolution of Global Climate Models

 https://news.ucar.edu/sites/default/files/news/2011/predictFlow2.jpg
 6
Impact of the Great Lakes on Local Climate (1)
 Locally Formed Severe Weather Systems in Summer
 Theory Theory Thunderstorm forming in convergence
 between lake breeze fronts.

 Theory An Example

 Satellite image of the super multicellular cluster of convective clouds at 23:15UTC on 14 July
 1997, resulted 200mm rain within 2.5 hours, caused the flash flood at Punkeydoodles Corners.

 http://www.yorku.ca/pat/research/dsills/primer.html
 7
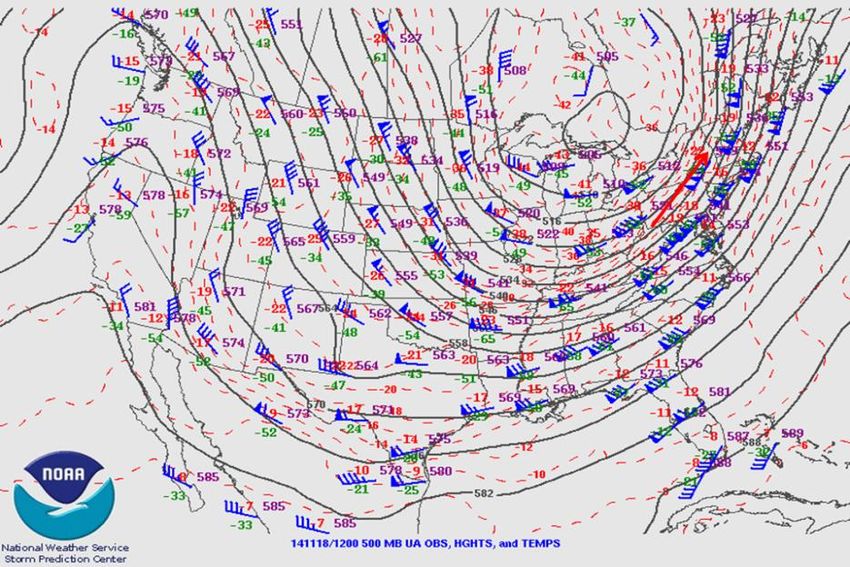
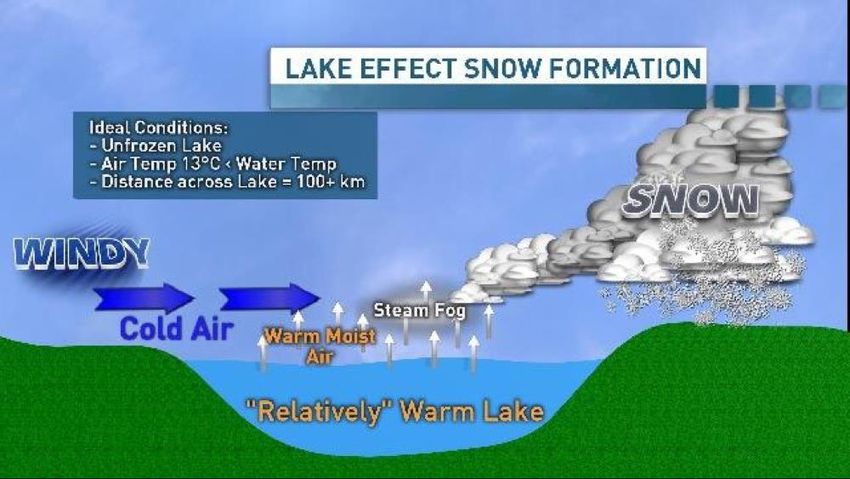
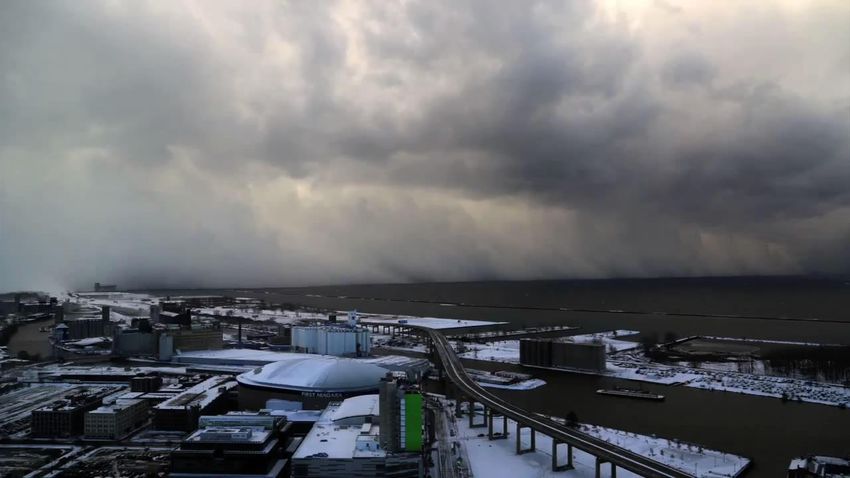
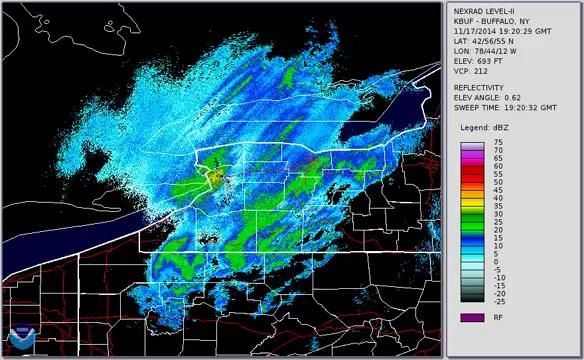
Impact of the Great Lakes on Local Climate (2)
 Locally Formed Severe Weather Systems in Cool Seasons

Theory November 2014 Lake Effect Snow (horizontally flipped from its
 original version for demonstration purpose).

 Ideal Conditions:
 • Unfrozen Lake
 • Twater – Tair > 10°C

November 2014 Lake Effect Snow November 2014 Lake Effect Snow

 L

 http://www.iweathernet.com/educational/difference-between-single-vs-multiple-lake-effect-snow-bands
 8
Need for High Resolution Regional Climate Modelling (1)
 Ability to Catch the Heavier Downpours

 Example – Winter Daily Rainfall Over The Alps

 RCM results in-
 line with
 observations,
 whereas GCMs
 completely
 missed these big
 storms

 http://precis.metoffice.com/docs/PRECIS_Handbook.pdf 9
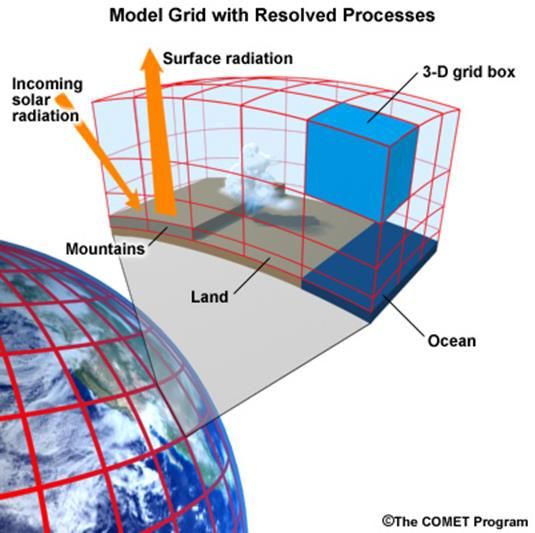
Need for High Resolution Regional Climate Modelling (2)
 Resolution of Local Climate Processes

 Climate modelling
 projects

Typical Global Climate Model Grids High Resolution Regional Climate
 (100’s km) Model Grids (10 km)

 A coarse resolution model A higher resolution model
 sees a real wave as a flat line sees a real wave as a wave
 10
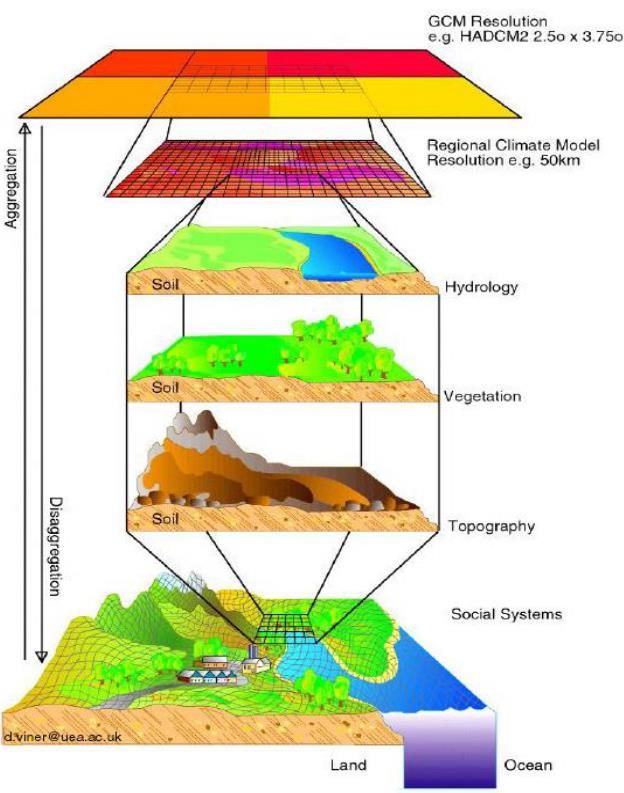
Importance of Climate Data at the Appropriate Scale
 Adaptation Occurs at Local / Community Level

• Knowing “What to adapt to” Global Climate Models
 (GCMs)

 is very important – need to
 know what the future climate Regional Climate Models
 (RCMs)
 could be before planning for

 Downscaling
 adaptation.
 Hydrology
• Access to state-of-the-science
 high resolution Ontario- Vegetation
 specific climate data at the
 appropriate scales (spatial
 Topography
 and temporal) is critical
 because adaptation is most Local communities /
 effectively carried out at local Social systems

 community level.
 Land Ocean

 11
Development of Ontario-Specific Climate Data
 Using a Partnership Model
The Ministry has used a collaborative/partnership model to High Resolution Ontario-
develop Ontario-specific climate data leveraging expertise Specific Climate Data
both within and outside the Ministry. This has resulted in:
• The development of over 100 Ontario-specific climate • ~100 climate variables (e.g.
 temperature and precipitation,
 variables at high spatial resolution and various time
 intensity, duration and frequency
 scales1 (IDF) curves, heat waves, etc.
 • Across ALL of Ontario (~10000
• The development of public facing climate data portals
 10x10km grid cells)
 o Thousands of users and • For historical and future years (e.g.
 o tens of thousands of data download requests 1970s, 1990s, 2030s, 2050s and
 2080s)
• The provision of technical guidance to a broad range of • Over 10TB of climate data available
 practitioners/stakeholders, forums for knowledge to researchers for download
 sharing, and the publication of numerous peer reviewed Flooding/infrastructure Food security/drought

 papers
• The development of policy, programs, and risk
 assessments across various sectors2 Far North Winter Roads Algae blooms

• Recognition of the Ministry as a source of state-of-the-
 science high quality regional climate data3.
Notes:
1. A sample list of the climate data/climate variables produced as part of this project is provided on last slide
2. See Appendices for project details
3. http://www.climateontario.ca/doc/Survey/ClimateInformationNeedsSurveyResults-OCCIAR.pdf Fig.18. 12
What Can Ontario Expect in the Decades to Come?
 Temperature & Precipitation Expected to Increase more Rapidly in Future

 Ontario Average Temperature
 10

 8
 Temperature (°C)

 6

 4

 2

 0

 -2
 1900 1920 1940 1960 1980 2000 2020 2040 2060 2080 2100

 1000 Ontario Average Precipitation
 950
 Precipitation (mm)

 900

 850

 800

 750

 700

 650

 600
 1900 1920 1940 1960 1980 2000 2020 2040 2060 2080 2100

 Source: redrawn with data from http://lamps.math.yorku.ca/OntarioClimate/assets/img/plot/OntarioClimateChangeTrend.png 13
By 2050s Ontarians Could Experience…
 More Heat Waves
 Range of increases is 42-78 days.

 Impacts vary with location: the most
 impacted areas (in red color) are the Far
 North, followed by northwest, north coasts
 of Lake Superior and Lake Huron, and
 Eastern Ontario.

 Heavier Downpours
 Range of increases is 10-38%.

 Impacts vary with location: the most
 impacted areas (in bluish color) are mainly
 in Northern Ontario, followed by Southern
 and Eastern Ontario.

Source: York University’s Ontario Climate Data Portal. Changes are based on the difference between the 50th percentile projections in 2505s (2040-2069) under the IPCC AR5 RCP8.5 business as usual projections and the 1990s (1981-2005) . A heat wave event is defined as a
period of at least 5 consecutive days with the maximum temperature at least 5℃ warmer than the daily climatology in 1990s. A downpour refers to a day with more than the 95th percentile of daily average total precipitation in the 1990s. 14
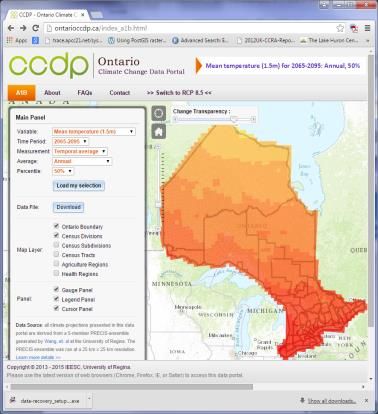
Climate Data Portals

http://OntarioCCDP.ca http://yorku.ca/OCDP
Links to the Climate Data Portals also available from the Ontario Open Data Catalogue
 15
What’s Available on the Ontario Climate Data Portal?
 Pre-made maps and graphs of climate data for the general

 Increasing User Knowledge Level
 public and policy makers

 High-level factsheets for the province and and tailored
 factsheets for Ontario’s 50 regions and 150 municipalities

 Pre-made interactive maps for more advanced users who can
 tailor their data search to a specific location

 Summary Reports on topics of interest e.g. Ontario’s frost-free
 season, Building Code variables

 Over 10 terabytes (TB) of high resolution climate data
 covering the entire province for scientists and engineers to
 carry out detailed risk assessments, free of charge

 Sample tools to read the large downloaded climate data files

 A sample list of climate data is on last slide in Appendix. 16
What Is Unique about the Ontario-Specific Climate Data?
 Super Ensemble of Ontario-Specific High-Resolution Regional Climate Projections
 Indices Probabilistic Uncertainty Data
 Spatially Consistent Bias Correction Calculation Projection Analysis Dissemination

Statistical Downscaled
 Nearest
 209 Averages
 PCIC members T,Tx,Tn,Pr

 Ontario Climate Data Portal (OCDP)
 Neighbor
 (BCSD,BCCA,BCCAQ) Interpolation
 1 2 , … , 1 (~10 ) Annual, Multi-
 (NNI) RCP2.6,
 Monthly, RCP4.5, factor
 Seasonal, ANOVA
 LAMPS (EnOI) RCP6.0,
 ′
 1+1 , … , 2 (~10 ) 1,… 5 Decadal RCP8.5
 Trends
 among

Dynamical Downscaled RCPs
 K-Nearest Current,
 Neighbor 2050s, Institute
 Interpolation Quantile 2080s
 NA-Cordex (KNN) Sub Methods
 Mapping ensemble
 2+1 . . , 3 (~22/44 )
 Spread
 ERA-Interim
 (~10km) Provincial,
 UofT
 Regional,
 3+1 . . , 4 (~10 ) Principle
 0 = 0−1 ( ) Extremes Municipal, Component
 38 indices Grid Analysis
 Nearest
 URegina Neighbor Window:31Days 171
 4+1 . . , 5 (~10 ) Interpolation Grid by grid
 (NNI)
 members
 1986-2005

 Quality Control Quality Control Quality Control Quality Control Deng et al 2017 17
Examples of
Where the Ontario-specific Climate Data Has Been Used
 Policy Documents Infrastructure Ecosystems
 • Over 7000 users
 from municipal and
 provincial agencies,
 academia, non-
 government
 agencies, and the
 private sectors
 (60,000+ data
Public Health Indigenous Agricultural Practices Municipalities
 Communities download requests).
 • Data have been used
 for policy and
 program
 development and
 risk assessments in
 various sectors.

 18
Thanks!
 Questions/Comments?
 Jinliang.Liu@Ontario.ca

You can learn more on climate change in Ontario from the following videos:
1. How warm could Ontario get because of climate change?
 Youtube: https://www.youtube.com/watch?v=nIUtlqI2vzs
 Facebook: https://www.facebook.com/ONenvironment/videos/1059679247436925/
 Twitter: https://twitter.com/ONenvironment/status/738420843173281792
2. Why do we have extreme cold snaps in Winter if the climate is warming?
 YouTube: https://www.youtube.com/watch?v=HIX23-Yv2Qk
 Facebook: https://www.facebook.com/ONenvironment/videos/1384320091639504/
 Twitter: https://twitter.com/ONenvironment/status/840596421816512513

 19
Appendices

 20
MECP-funded Regional Climate Modelling Projects
 Year Grant Recipient Project Description
2008-2009 OURANOS Modelling distribution of trends of major climate indicators across Ontario (45km x 45km grids) using a
 Canadian model

 University of Regina Modelling distribution of trends of major climate indicators across Ontario (10km x 10km grids) using a UK
 model

2009-2010 University of Toronto/ SciNet Modelling Ontario’s climate change at high-resolution (10km x 10km grids) with US model on the SciNet
 Supercomputer System

 University of Regina Modelling Ontario’s climate change at high resolution (25km x 25km grids) with UK PRECIS Model and
 further downscaling to 10km x 10km resolution

 University of Toronto- Developing future climate change projections over Ontario at annual, seasonal and monthly scales using
 Scarborough statistics

 York University Assessing potential changes in extreme winds over Ontario using high resolution data from observation
 and models

2010-2011 York University Developing high-resolution (45km x 45km grid) probabilistic climate projections over Ontario from multiple
 Regional and Global Climate Models
 University of Regina Developing high-resolution (25km x 25km) probabilistic climate projections over Ontario from large
 ensemble runs of the UK model
 University of Toronto/ SciNet Improving regional climate modelling over Ontario at high-resolution (10km x 10km grids) with US model
 on the SciNet Supercomputer System

2012-2013 York University Developing High-Resolution (45km x 45km) Probabilistic Climate Projections of Extreme Events over
 Ontario from Multiple Regional and Global Climate Models.

 University of Regina Developing Future Projected IDF Curves across the Entire Province and to Make the Project Results and
 All Associated Data Publicly Available on a Data Portal.

2013-2014 York University Updating the 45km x 45km Probabilistic Projections over Ontario Through Statistical Downscaling of IPCC
 AR5 GCM and updated NARCCAP RCM Projections
 University of Regina Updating the 25km x 25km Probabilistic Projections over Ontario by Dynamical Downscaling of IPCC’s AR5
 GCM Projections using UK PRECIS
 York University Ensemble Dynamic Downscaling Climate Projections over Ontario using the US Weather Research and
 Forecasting (WRF) Model
2015-2016 University of Toronto/ SciNet High Resolution Climate Change Projections for Ontario and the Great Lakes Basin Region: Phase 1

 York University Upper Air Climate Trends Observed by the O-Qnet Profiler Network in Central and Southern Ontario

 University of Regina Developing additional 4 set of Dynamical Downscaled High Resolution Regional Climate Projections

 York University Developing a Common Set of High Resolution Regional Climate Projections Using A Large Ensemble

2017-2018 University of Toronto/ SciNet High Resolution Climate Change Projections for Ontario and the Great Lakes Basin Region: Phase 2 21
MECP-funded Climate Impact Assessment Projects (1)
 Risk Sciences International Accessing and Interpreting Climate Change Information for
 (RSI) Decision Making, Toronto
 Ontario Centre for Climate Accessing and Interpreting Climate Change Information for
 Impacts and Adaptation Decision Making, Sudbury
Climate Data
 Resources (OCCIAR)
Training
To Support Ontario Climate Consortium Accessing and Interpreting Climate Change Information for
Adaptation (OCC) Decision Making - Climate Data Training Session for
 Engineers, Ontario Science Center
 Ontario Climate Consortium Accessing and Interpreting Climate Change Information for
 (OCC) Decision Making - Climate Data Training Session for Planners
 and Decision Makers, Ontario Science Center
 Ontario Climate Consortium Accessing and Interpreting Climate Change Information for
 (OCC) Decision Making - Integrating Climate Information into
 Watershed Planning, Black Creek Pioneer Village
 Trent University Assessing climate impacts on the Lake Simcoe watershed
 Lake using Ontario-specific high resolution climate data
 Simcoe
 York University Projecting Climate Change Impacts on Hydrological Cycles over
 the Lake Simcoe Watershed
 University of Toronto Assessing Climate Change Impact on Carbon Cycles in the
 Far
 Ontario’s Far North Ecosystems – phase 1
Ecosystem
 North University of Toronto Assessing Climate Change Impact on Carbon Cycles in the
 Ontario’s Far North Ecosystems – phase 2
 York University Assessing Climate Change Impacts on the James Bay
 Algal Lowlands in the Far North of Ontario
 Bloom York University Assessing Climate Change Impacts on Algal Bloom in Ontario’s
 Inland Lakes
 22
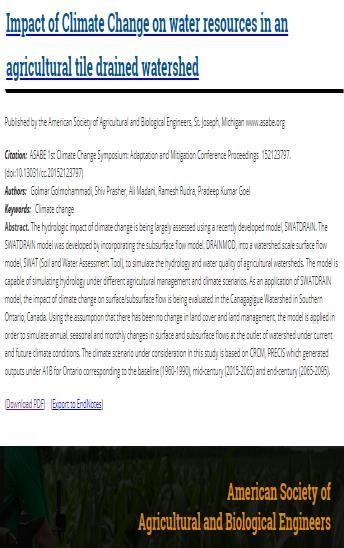
MECP-funded Climate Impact Assessment Projects (2)
Human Health University of Projecting Climate Change Impacts and Risks to
 Toronto Human Health in Ontario

 University of Assessing Climate Change Impacts on Droughts
 Guelph and Food Security over Ontario
Agriculture University of Assessing Climate Change Impacts on Water
 Guelph Quantity and Quality in an Agricultural Watershed in
 Southwestern Ontario
 Engineers Canada A pilot vulnerability assessment of the impacts of
 climate change on a municipal water treatment plant
 in southern Ontario
 Ontario Climate A Climate Change Risks Assessment and
 Consortium (OCC) Adaptation Strategy for York Region, Ontario
Infrastructure
 York University Developing Extreme Climate Indices for Building
 Code Calculation in Ontario from the IPCC AR5
 Multi-model Ensemble
 University of Assessing Climate Change Impact on Ontario’s Far
 Toronto North Winter Roads

 23
A Sample List of
 Ontario-Specific High Resolution Climate Data
 Resulted from MECP-Funded Projects
1. Annual Mean Temperature 40. Net surface long wave radiation flux
2. Mean Diurnal Range (Mean of the period max-min]) 41. Net surface short wave radiation flux
3. Mean daily temperature 42. Total downward short wave radiation flux
4. Mean daily maximum temperature 43. Intensity, Duration and Frequency curves across all of Ontario
5. Mean daily minimum temperature
6. Max Temperature of Warmest Period 44. Daily maximum, minimum, and average air temperature.
7. Min Temperature of Coldest Period 45. Daily total precipitation
8. Temperature Annual Range 46. Hourly temperature
9. Mean Temperature of Wettest Quarter 47. Hourly total precipitation
10. Mean Temperature of Driest Quarter 48. Hourly surface relative humidity
11. Mean Temperature of Warmest Quarter 49. Hourly surface solar radiation
12. Mean Temperature of Coldest Quarter 50. Hourly surface wind speed
13. Heat wave return-period analyses 51. Hourly surface wind direction
14. 99th percentile of daily maximum temperature - probabilistic 52. Heat waves (strength and length) - Length in days, season, year
15. 1st percentile of daily maximum temperature - probabilistic
16. 99th percentile of daily minimum temperature - probabilistic 53. Maximum humidex - day, month, season, year
17. 1st percentile of daily minimum temperature - probabilistic 54. Hot day- Length in days, season, year
18. Cooling Degree Days (CDD) - probabilistic 55. Hot night- Length in days, season, year
19. Heating Degree Days (HDD) – probabilistic 56. Cold day - Length in days, season, year
20. Annual Precipitation 57. Days with more than 5 consecutive days of precipitation
21. Precipitation of Wettest Period 58. Cold night - Length in days, season, year
22. Precipitation of Driest Period 59. Days with more than 10mm precipitation - month, season, year
23. Precipitation Seasonality 60. Days with more than 20mm precipitation- month, season, year
24. Precipitation of Wettest Quarter 61. Heavy precipitation above 95 percentile - month, season, year
25. Precipitation of Driest Quarter
26. Precipitation of Warmest Quarter 62. Frequency of heavy precipitation by types - month, season, year
27. Precipitation of Coldest Quarter
28. Intensity, Duration and Frequency (IDF) curves at selected monitoring locations
29. Flooding return-period analyses
30. Snow water equivalent (“SWE”)
 Plus
31. Monthly mean of SWE
32. Max daily SWE ~40 most up-to-date extreme climate
33. 99th percentile of daily precipitation rate- probabilistic
34.
35.
 Specific humidity
 Relative humidity
 indices.
36. Surface winds gusts and return-period analyses
37. Soil moisture
38. Soil temperature
39. Total clouds

 24
You can also read