Unusual ionospheric effects observed during the intense 28 October 2003 solar flare in the Brazilian sector
←
→
Page content transcription
If your browser does not render page correctly, please read the page content below
Ann. Geophys., 25, 2497–2502, 2007
www.ann-geophys.net/25/2497/2007/                                                                            Annales
© European Geosciences Union 2007                                                                        Geophysicae

Unusual ionospheric effects observed during the intense 28 October
2003 solar flare in the Brazilian sector
Y. Sahai1 , F. Becker-Guedes1 , P. R. Fagundes1 , W. L. C. Lima2 , A. J. de Abreu1 , F. L. Guarnieri1 , C. M. N. Candido3 ,
and V. G. Pillat1
1 Universidade  do Vale do Paraiba (UNIVAP), Sao Jose dos Campos, SP, Brazil
2 Centro  Universitario Luterano de Palmas (CEULP/ULBRA), Palmas, TO, Brazil
3 Instituto Nacional de Pesquisas Espaciais (INPE), Sao Jose dos Campos, SP, Brazil

Received: 25 June 2007 – Revised: 26 September 2007 – Accepted: 23 October 2007 – Published: 2 January 2008

Abstract. The 28 October 2003 solar flare (X-ray Class             in complete or partial fade-out of radio signals at the lower
X17.2) was one of the most intense solar flares observed           ionospheric heights. The partial and complete radio fade-out
in the recent past. In the present investigation we show           observed in the Brazilian sector for more than six hours must
the unusual ionospheric effects observed in the Brazilian          have resulted in considerable difficulties to the radio station
sector during this solar flare, using both the ionospheric         operating agencies using ionospheric radio transmissions.
sounding observations obtained at the UNIVAP stations:
                                                                   Keywords. Ionosphere (Equatorial ionosphere, Ionosphere
Palmas (7–10.2◦ S, 48.2◦ W, dip lat. 5.5◦ S) and Sao Jose
                                                                   disturbance) – Solar astrophysics and astronomy (Flares and
dos Campos (23.2◦ S, 45.9◦ W, dip lat. 17.6◦ S), Brazil;
                                                                   mass ejections)
and ground-based global positioning system (GPS) data ob-
tained at the “Instituto Brasileiro de Geografia e Estatı́stica”
(IBGE) stations: Imperatriz (5.5◦ S, 47.5◦ W, dip lat. 2.9◦ S),
Brasilia (15.9◦ S, 47.9◦ W, dip lat. 11.7◦ S), Presidente Pru-     1   Introduction
dente (22.3◦ S, 51.4◦ W, dip lat. 14.9◦ S), and Porto Alegre
(30.1◦ S, 51.1◦ W, dip lat. 20.7◦ S), Brazil; on two consec-       Schunk and Sojka (1996) have described in detail sev-
utive days, viz., 27 (without solar flare) and 28 (with solar      eral ionosphere-thermosphere space weather issues and
flare) October 2003. It should be mentioned that the vertical      mentioned that weather disturbances in the ionosphere-
total electron content (VTEC) from the GPS observations ob-        thermosphere system can have a detrimental effect on both
tained during the solar flare showed an unusual simultaneous       ground-based and space-based systems. Recent studies by
increase in the VTEC values at about 11:00 UT at all four sta-     Kelley et al. (2006) indicate that the most severe ionospheric
tions associated with the solar flare EUV enhancements and         weather occurs within ±20◦ of the geomagnetic equator
lasted for about 3 h. However, no ionograms were obtained          where stored gravitational energy is sometimes released af-
at any of the two UNIVAP stations for a period of about 1 h        ter sunset, depending on the condition of the equatorial iono-
between about 11:00 to 12:00 UT. Before 11:00 UT (from             sphere, to form vast plumes of turbulent plasma. Kelley et al.
about 10:45 UT) and after 12:00 UT (to about 16:00 UT),            (2006) have termed this as convective ionospheric storms, to
the ionograms were only partial, with the low frequency end        emphasize the analogy of the ionospheric process to thun-
missing. During this intense solar flare, hard X-rays (1 to 10     derstorm. In this paper, we present another class of space
A), as observed by the GOES 12 satellite, were ejected by          weather event when, during a strong solar flare on 28 Oc-
the Sun during a long period (several hours), with peak ra-        tober 2003, for more than six hours, there were either no
diation at about 11:10 UT. These hard X-ray radiations can         ionograms (1 to 20 Mhz) or only partial ionograms (high fre-
penetrate further into the ionosphere, causing an increase in      quency end) obtained at two Brazilian ionospheric sounding
ionization in the lower part of ionosphere (D-region). In this     stations viz., Palmas (10.2◦ S, 48.2◦ W; hereafter referred to
way, the lack of ionograms or partial ionograms, which in-         as PAL) and Sao Jose dos Campos (23.2◦ S, 45.9◦ W; here-
dicates no echoes or partial echoes of the transmitted digital     after referred to as SJC). This indicates complete or partial
ionosonde signals, are related to intense absorption, resulting    fade-out of short-wave radio propagation through the iono-
                                                                   spheric region in this sector. Needless to say that the radio
Correspondence to: Y. Sahai                                        fade-out for several hours must have resulted in enormous
(sahai@univap.br)                                                  difficulties to several agencies and organizations associated

Published by Copernicus Publications on behalf of the European Geosciences Union.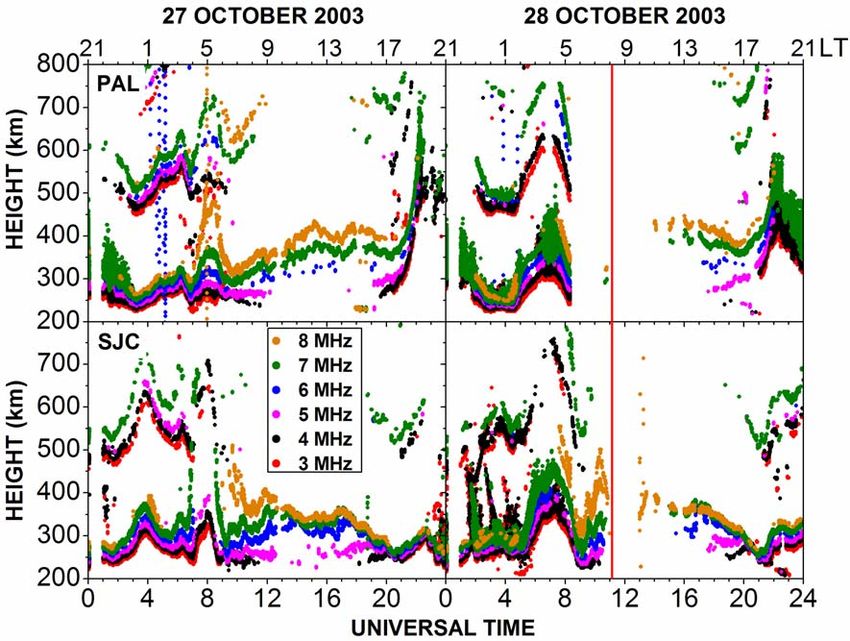
2498 Y. Sahai et al.: Unusual ionospheric effects
the “Rede Brasileira de Monitoramento Continuo de GPS
(RBMC; Brazilian Network for Continuous GPS Monitor-
ing)” run by the “Instituto Brasileiro de Geografia e Es-
tatı́stica (IBGE; Brazilian Institute of Geography and Statis-
tics)”, Brazil, on 27 and 28 October 2003.
2 Solar flare radiations
As mentioned by Papagiannis (1972), most of the sudden
ionospheric disturbances (SIDs) are directly related to the
ionization of the D-layer, which is the result of the X-ray
burst from the solar flare. During quiet days, the D-region
is maintained by the Lyman-α (121.6 nm) emission from the
Sun and by the galactic cosmic rays (lower D-region). The
quiet Sun emits practically no X-rays below 1 nm and there-
fore all the solar X-rays are stopped above the D-region. The
X-ray emission from a flare, however, extends easily into the
0.1 nm range, which can reach the D-region and increase its
electron density by at least one order of magnitude. Har-
greaves (1992) points out that the nature and timing of the
shortwave fadeout (SWF) immediately provides two clues
to its nature. The simultaneity between the fadeout and the
visible flare (as seen in the red light of the Balmer-α line
(656.3 nm)) shows that the cause is electromagnetic; and
the occurrence of radio absorption indicates that the elec-
tron density in the D-region has been increased. Thus, the
enhancement is most likely to be in the Lyman-α or the X-
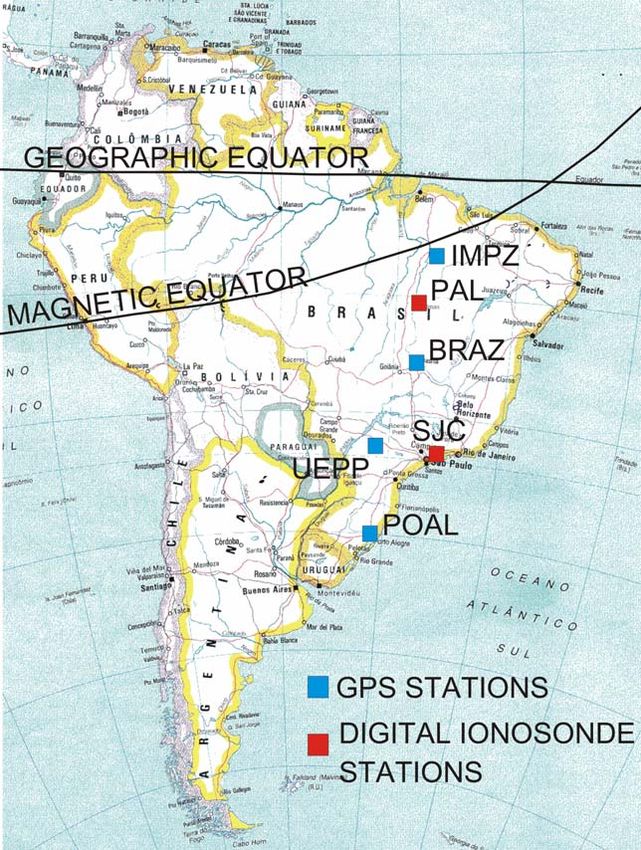
Fig. 1. Map of South America showing the locations of the iono-
ray flux. Lyman-α is enhanced by a few percent during a
spheric sounding (red marks) and GPS (blue marks) stations. In
addition, the geographic and magnetic (based on IGRF-9, 2000)
flare, and for many years this was thought to be the cause
equators are shown. FIGURE 1
of the SWF. However, when it became possible to measure
hard X-rays from rockets it was observed that they intensi-
fied by several powers of ten during a flare; thus, the SWF is
with radio-communication and transmission of radio pro- now attributed to the X-rays from the flare. Davies (1990a)
grams in this region. classified X-ray flares, in the wavelength range 1-8 A (0.1–
0.8 nm), as C, M, and X, depending on the power flux level,
The solar flare on 28 October 2003 was amongst the most
φ.
intense (X17.2) recorded by the National Oceanic and At-
Class Peak flux (W m−2 )
mospheric Administration (NOAA), USA, in recent years.
10 C 10−6 ≤φ≤10−5
Using data from about 100 GPS receivers around the globe
M 10−5 ≤φ≤10−4
and the Global Ultraviolet Imager (GUVI) in the NASA
X 10−4 ≤φ
TIMED satellite mission, Tsurutani et al. (2005) have an-
Davies (1990b) points out that X-ray flares are increased
alyzed this extreme EUV solar flare and resultant extreme
emissions in the wavelength range 1–8 A. They are partic-
ionospheric effects. It should be mentioned that Tsuru-
ularly important from the point of view of the ionospheric
tani et al. (2005) have observed an enhancement of about
radio because these wavelengths ionize the D-region, which
25 TECU (25×1012 electrons/cm2 ) for about 3 h, in an ex-
results in radio absorption. Most class-X flares and some
tended area covering mostly Africa, Eastern South America
class-M flares produce short-wave fadeouts that affect radio
and Central America, the region with overhead Sun, soon
communication. During solar flares extreme EUV radiation
after the solar flare. It should be mentioned that a recent
also show unusual enhancements (see Fig. 1 of Tsururatni et
report (http://spaceflightnow.com/news/n0704/04gpssun) re-
al., 2005).
lated to solar flare on 5 December 2006, indicates that GPS
systems around the globe were significantly impacted by a
powerful solar radio burst. In this paper we present, in ad-
dition to the ionospheric sounding observations from PAL
and SJC, the complementary GPS data available from sev-
eral stations in the Brazilian sector (Table 1) obtained by
Ann. Geophys., 25, 2497–2502, 2007 www.ann-geophys.net/25/2497/2007/Y. Sahai et al.: Unusual ionospheric effects 2499
Table 1. Details of the global positioning system (GPS) and digital ionosonde (DI) sites in Brazil used in the present study. For all the
stations LT=UT−3 h.
Location Symbol used Observations Geog. Lat. Geog. Long. Dip Lat.
(Network)
Imperatriz IMPZ GPS 05.5◦ S 47.5◦ W 02.9◦ S
(RBMC)
Palmas PAL DI 10.2◦ S 48.2◦ W 05.5◦ S
(UNIVAP)
Brasilia BRAZ GPS 15.9◦ S 47.9◦ W 11.7◦ S
(RBMC)
Presidente UEPP GPS 22.1◦ S 51.4◦ W 14.9◦ S
Prudente (RBMC)
São José SJC (UNIVAP) DI 23.2◦ S 45.9◦ W 17.6◦ S
dos Campos
Porto Alegre POAL GPS 30.1◦ S 51.1◦ W 20.7◦ S
(RBMC)
3 Observations
In order to initiate the establishment of a new ionospheric
sounding network in Brazil, a Canadian Advanced Digital
Ionosonde (CADI) (Grant et al., 1995) was put in opera-
tion at SJC in August 2000 by the Universidade do Vale
do Paraiba (UNIVAP). This was followed by the installation
of two more CADIs at PAL and Manaus (2.9◦ S, 60.0◦ W),
in collaboration with the Universidade Luterana do Brasil
(ULBRA). Due to some technical problems with the CADI
at Manaus, only data from SJC and PAL are presented in
this work. Details of the two ionospheric sounding stations
(PAL and SJC) used in the present study are given in Ta-
ble 1. It should be mentioned that PAL is a near-equatorial
station, whereas SJC is located under the southern crest of the
equatorial ionospheric anomaly. The two ionospheric sound-
ing stations (PAL and SJC) have the same local time, with Fig. 2. Plots of virtual height variations for six different frequencies
UT=LT+3 h. Figure 1 shows the locations of the two iono- (iso-frequencies 3, 4, 5, 6, 7, and 8 MHz.) observed at PAL and SJC
spheric soundings and four GPS stations used in the present for the UT days 27 and 28 October 2003. The vertical red line
investigations. indicates the peak in solar flareFIGURE
at 11:10
2 UT.
The CADI transmits frequencies from 1 to 20 MHz, with
600 W power, and the transmitted pulse has a length of 40 µs,
which gives a ±3 km height resolution. The antenna is a dou-
ble delta dipole array supported by a 20-m tower, where one higher time resolution, known as iso-frequency plots. The
of the dual antennas is used for transmitting, and the other iso-frequency plots from observations on UT days 27 (a nor-
one is used for receiving. The CADI operates in two dif- mal day) and 28 October 2003 (solar flare day) at PAL and
ferent scanning modes. In the first mode it scans 180 fre- SJC are shown in Fig. 2. It 11should be mentioned that due
quencies every 300 s, to provide a normal ionogram. In the to some technical problem, the CADI at PAL was not opera-
second mode it scans only 6 frequencies (3, 4, 5, 6, 7 and tional from about 08:20 UT to 10:40 UT on 28 October 2003
8 MHz), but with a higher temporal resolution (100 s). Using and it was just returning to provide normal ionograms when
the software developed at the UNIVAP called UNIVAP DIG- the solar flare resulted in a fade out.
ITAL IONOSONDE DATA ANALYSIS – UDIDA, it is pos-
sible to visualize ionograms on a PC screen and scale differ- The GPS data obtained at the four stations presented in
ent ionospheric parameters. UDIDA also provides the daily Table 1 are used to obtain the vertical total electron content
height variations at the six fixed frequencies obtained in a (VTEC) on UT days 27 and 28 October 2003 (Fig. 3).
www.ann-geophys.net/25/2497/2007/ Ann. Geophys., 25, 2497–2502, 20072500 Y. Sahai et al.: Unusual ionospheric effects
27 OCT 2003 28 OCT 2003 PAL SJC
21 01 05 09 13 17 21 01 05 09 13 17 21 LT
900
150 05 09 13 (a) 10:45 UT
120 750
120 27 OCTOBER 2003
HEIGHT (km)
IMPZ
90 28 OCTOBER 2003
60
90 600
30 450
60
150
120
120 300
BRAZ
90
90 150
60
VTEC (TECU)
30 (b) 11:45 UT
60 750
150
HEIGHT (km)
120
120 600
UEPP
90
90
60 450
30
60 300
150
120
120 150
POAL
90
90 (c) 12:15 UT
60 750
HEIGHT (km)
30
60 600
00 08 12 16
00 04 08 12 16 20 00 04 08 12 16 20 24
UNIVERSAL TIME 450
300
Fig. 3. Vertical total electron content (VTEC) observed at Imper-
150
atriz (IMPZ), Brası́lia (BRAZ), Presidente Prudente (UEPP), and (d) 16:00 UT
Porto Alegre (POAL) stations (Table 1) on UT days 27 (green lines) 750
HEIGHT (km)
and 28 (red lines) October 2003. A blowup of the VTEC data near 600
the flare time is shown on theFIGURE 3
right-hand side.
450
300
4 Results and discussion 150
4 6 8 10 12 14 16 4 6 8 10 12 14 16
FREQUENCY (MHz) FREQUENCY (MHz)
Mitra (1974) has published an excellent review on the iono-
spheric effects of solar flares. As discussed earlier and men-
12 Fig. 4. The ionograms obtained at 4(a) 10:45 UT, (b) 11:45 UT,
FIGURE
tioned by Tsurutani et al. (2005), the impulsive ionization of
(c) 12:15 UT and (d) 16:00 UT on 27 October 2003 (normal day;
the flare radiation causes enhanced ionization over a broad black dots) and 28 October 2003 (solar flare day; red dots) at PAL
altitude range from the D-region (80–100 km altitude) all the and SJC. This period covers the13ionograms obtained with partial
way to the F-region (the F-region peak is at about the 300-km radio wave absorption at 10:45, 12:15, and 16:00 UT and complete
altitude). absorption at 11:45 UT.
It should be mentioned that the sunspot group 486 was
near the solar disc center on 28 October 2003 and unleashed
a huge H-alpha 4B/X-17.2 class solar flare at about 11:00 UT the solar flare maximum (11:10 UT). It should be pointed
(N. Srivastava, Udaipur Solar Observatory, India, private out that to obtain the iso-frequencies plots the sounding fre-
communication, 2004). Figure 3 shows the vertical total quencies are limited up to 8 MHz. Figure 2 shows that before
electron content observations at the four GPS stations (Ta- the red vertical line there are increasing partial absorptions
ble 1) on 27 October (a normal day) and 28 October (so- with lower frequencies at SJC. From 10:00 UT to 11:00 UT,
lar flare day). The observations on 27 October (green lines) only partial ionograms, with the lower frequency end miss-
are repeated on 28 October, as well, just for a comparative ing, was observed at SJC. From 11:05 UT to 12:10 UT (sixty-
study. It is observed in Fig. 3 that soon after the solar flare five minutes), no ionograms were observed at SJC. Again,
on 28 October, all four stations show a sudden increase in from 12:15 UT to 16:40 UT, only partial ionograms, with
the TEC levels (black dotted vertical line). A blowup of the the lower frequency end missing was observed at SJC. At
VTEC data near the flare time in Fig. 3 indicates that the av- PAL the ionospheric sounding started again at 10:45 UT,
erage TEC enhancements observed at the four stations are with partial ionograms up to 11:00 UT. From 11:05 UT to
about 25 TECU and last for about 3 h. The observations are 11:50 UT (forty-five minutes) there were no ionograms ob-
very similar to that reported by Tsurutani et al. (2005). The served at PAL. From 12:00 UT to 16:40 UT, only partial
TEC enhancements observed are due to the enhancements in ionograms were observed at PAL. The complete ionograms
the extreme EUV radiations associated with the intense solar at both stations were observed only at about 16:45 UT. There-
flare (Tsurutani et al., 2005, Zhang and Xiao, 2005). fore, total + partial radio fade out lasted for more than 6 h
As mentioned earlier due to some technical problem, the (6 h and 40 min) in the Brazilian sector. Figure 4 shows
ionospheric sounding at PAL stopped between 08:20 UT and four ionograms, each from both the stations, with ionograms
10:40 UT. The vertical red line in Fig. 2 shows the time of observed on 28 October (red line; total + partial fade out)
Ann. Geophys., 25, 2497–2502, 2007 www.ann-geophys.net/25/2497/2007/Y. Sahai et al.: Unusual ionospheric effects 2501
04 November 2001
28 October 2003
1E-4
1E-3
GOES 8 1-8 A
GOES 12 1-8 A
(W/m )
2
1E-4
(W/m )
2
1E-5
1E-5
1E-6
1E-6
1E-3
1E-5
1E-4
GOES 12 0.5-4 A
GOES 8 0.5-4 A
1E-5 1E-6
(W/m )
2
(W/m )
2
1E-6
1E-7
1E-7
1E-8
1E-8 12 13 14 15 16 17 18 19 20 21 22 23 24
00 01 02 03 04 05 06 07 08 09 10 11 12 13 14 15 16 17 18 19 20 21 22 23 24 Time (UT)
Time (UT)
Fig. 6. Shows X-ray flux (1–8 A and 0.5–4 A) observed on 4
Fig. 5. Shows X-ray flux (1–8 A and 0.5–4 A) observed on 28 Oc- November 2001 by the satellite GEOS 12 from 12:00 UT to
tober 2003 by the satellite GEOS 12 from 00:00 UT to 24:00 UT. 24:00 UT. The blue horizontal line indicates the quiescent X-ray
The blue horizontal line indicates the quiescent X-ray flux. The red flux. The red vertical lines FIGURE
indicate the peaks in solar flare X-ray
6
vertical lines indicates the onset of solar flare X-ray flux. flux.
FIGURE 5
and 27 October (black; no fade out), for comparison. Fig- On the other hand, the ionospheric sounding using short
ure 4 shows examples of partial radio wave absorption at and medium radio waves (1–20 MHz) depends on the reflec-
10:45, 12:15, and 16:00 UT and total radio wave absorption tion on these waves from the15 ionospheric region to generate
at 11:45 UT observed at PAL 14 and SJC. ionograms. As discussed by Mitra (1952), a sudden and in-
Figure 5 shows X-ray flux (1–8 A and 0.5–4 A) observed tense increase in the ionization in the ionosphere is found to
on 28 October by the satellite GEOS 12 from 00:00 UT to occur simultaneously with solar flares, resulting in the ex-
24:00 UT. A perusal of Fig. 5 indicates unusually large en- treme cases in a complete fade out of radio signals over the
hancements in both the bands (1–8 A and 0.5–4 A), starting Sun-lit region. As presented earlier X-ray flares are respon-
at about 10:00 UT. As discussed earlier, the enhanced X-ray sible for the enhanced ionization in the D-layer, resulting in
flux is responsible for an additional ionization in the D-layer, the absorption of radio waves used for ionospheric sounding.
resulting in total + partial ionograms observed on 28 October Figures 6 and 7 show another event of total + partial
in the Brazilian sector. The partial absorption of radio waves absorption of the ionospheric sounding frequencies on 4
(frequencies2502 Y. Sahai et al.: Unusual ionospheric effects
700
SJC Acknowledgements. Thanks are due to P. Wilkinson and
(a) 15:55 UT (b) 16:15 UT J. W. Wright for several helpful comments. We would also
600 3 NOVEMBER 2001
4 NOVEMBER 2001
like to convey our thanks to the authorities of the “Rede Brasileira
HEIGHT (km)
500 de Monitoramento Continuo (RBMC) de GPS” for kindly allowing
400
us to use the GPS data obtained by RBMC. This work was partially
supported by grants from CNPq and FAPESP, Brazil.
300
Topical Editor M. Pinnock thanks two anonymous referees for
700 their help in evaluating this paper.
(c) 17:00 UT (d) 18:00 UT
600
HEIGHT (km)
500 References
400
Davies, K.: Ionospheric Radio, IEE Electromagnetic Waves Series
300
31, Short Run Press Ltd., Exeter, UK, 313–315, 1990.
200 Grant, I. F., MacDougall, J. W., Ruohoniemi, J. M., Bristow, W. A.,
4 6 8 10 12 14 16 6 8 10 12 14 16
FREQUENCY (MHz) FREQUENCY (MHz) Sofko, G. J., Koehler, J. A., Danskin, D., and Andre, D.: Com-
parison of plasma flow velocities determined by the ionosonde
Fig. 7. The ionograms obtained at (a) 15:55 UT, (b) 16:15 UT, Doppler drift technique, SuperDARN radars, and patch motion,
(c) 17:00 UT and (d) 18:00 UT on 3 November 2001 (normal day; Radio Sci., 30, 1537–1549, 1995.
black dots) and 4 November 2001 (solar flare day; red dots) at SJC. Hargreaves, J. K.: The solar-terrestrial envirronment, Cambridge
This period covers the ionograms obtained with partial radio-wave Atmospheric and Space Science Series 5, Cambridge University
absorption at 15:55, 17:00, andFIGURE
18:007 UT and complete absorption Press, Cambridge, UK, 261–263, 1992.
at 16:15 UT. Kelley, M. C., Makela, J. J., and de la Beaujardiere, O.: Convec-
tive ionospheric storms: A major space weather problem, Space
Weather, 4, S02C04, doi:10.1029/2005SW000145, 2006.
5 Conclusions Liu, J. Y., Lin. C. H., Tsai, H. F., and Liou, Y. A.: Iono-
spheric solar flare effects monitored by the ground-based GPS
In this paper, we have presented and discussed the iono- receivers: Theory and Observation, J. Geophys. Res., 109,
16
spheric sounding and GPS observations carried out at several A01037, doi:10.1029/2003JA009931, 2004.
stations in the equatorial and low-latitude regions in Brazil Liu, J. Y., Lin. C. H., Chen, Y. I., Lin, Y. C., Fang, T. W., Chen, C.
following the intense solar flare on 28 October 2003. The H., Chen, Y. C., and Hwang, J. J.: Solar flare signatures of the
principal results of the investigations are summarized below: Ionospheric GPS total electron content, J. Geophys. Res., 111,
A05308, doi:10.1029/2005JA011306, 2006.
1. The GPS observations at four stations (Table 1) show Mitra, S. K.: The Upper Atmosphere, The Asiatic Society Mono-
sudden TEC enhancements of about 25 TECU, lasting graph Series Volume 5, Calcutta, India, p. 325, 1952.
for about three hours, during the intense solar flare. Mitra, A. P.: Ionospheric Effects of Solar Flares, Astrophysics
and Space Science Library, D. Reidel Pubishing Company,
2. It appears that during intense solar flares extreme ultra- Dordrecht-Holland, 1974.
violet radiation can penetrate into the ionosphere, caus- Papagiannis, M. D.: Space Physics and Space Astronomy, Gordon
ing an increase in ionization and resulting in GPS/TEC and Breach Science Publishers, London, UK, 183–184, 1972.
Schunk, R. W. and Sojka, J. J.: Ionosphere-thermosphere space
enhancements of about 25 TECU for about 3 h.
weather issues, J. Atmos. Terr. Phys., 58, 1527–1574, 1996.
3. The ionospheric sounding observations at PAL and SJC Tsurutani, B. T., Judge, D. L., Guarnieri, F. L., Gangopadhyay, P.,
show a lack of complete ionograms (total + partial radio Jones, A. R., Nuttall, J., Zambon, G. A., Didkovsky, L., Man-
nucci, A. J., Iijima, B., Meier, R. R., Immel, T. J., Woods, T. N.,
wave absorption) for more than six hours. At PAL the
Prasad, S., Floyd, L., Huba, J., Solomon, S. C., Straus, P., and
period of total absorption was 45 min, whereas at SJC Viereck, R.: The October 28, 2003 extreme EUV solar flare and
the period of total absorption was 65 min. resultant extreme Ionospheric effects: Comparison to other Hal-
loween events and the Bastille Day event, Geophys. Res., Lett.,
4. The total + partial radio fade out for more than six hours
32, L03S09, doi:10.1029/2004GL021475, 2005.
in the Brazilian sector, due to unusual enhancements Zhang, D. H. and Xiao, Z.: Study of ionospheric response
in the solar flare X-ray radiation must have resulted to the 4B flare on 28 October 2003 using International
in enormous difficulties to the radio station operating GPS Service network data, J. Geophys. Res., 110, A03307,
agencies using ionospheric radio transmissions. doi:10.1029/2004JA010738, 2005.
5. Another less intense solar flare on 4 November 2001 ex-
hibited similar characteristics of radio-wave absorption
to that observed on 28 October.
Ann. Geophys., 25, 2497–2502, 2007 www.ann-geophys.net/25/2497/2007/You can also read