Probing the strain distribution within a single crystal superalloy during high temperature testing
←
→
Page content transcription
If your browser does not render page correctly, please read the page content below
MATEC Web of Conferences 14, 05004 (2014)
DOI: 10.1051/matecconf/20141405004

c Owned by the authors, published by EDP Sciences, 2014

Probing the strain distribution within a single crystal superalloy during
high temperature testing
Alain Jacques1,a , Mohamed Biskri1 , Thomas Schenk1 , Jean Philippe Chateau Cornu1 , and Pierre Bastie2
1
    Institut Jean Lamour (UMR CNRS-UL N◦ 7198), Labex DAMAS, Parc de Saurupt, 54000 Nancy, France
2
    LiPhy, 140 Avenue de la Physique, BP. 87, 38402 Saint-Martin-d’Hères, France

             Abstract. The combination of in situ high resolution diffraction experiments with synchrotron radiation and
             mechanical and diffraction modelling is used to investigate the microstructure and mechanical state of single
             crystal superalloys during high temperature tests: a very high temperature annealing without external load and a
             creep test.

1. Introduction                                                                2. Experiments
                                                                               Figure 1 shows the layout of a Three Crystal
Single crystal superalloys are both strategic industrial
                                                                               Diffractometer [4]. The initial polychromatic X-Ray
materials and model materials to understand and predict
                                                                               beam first goes through a (311) silicon monochromator.
the plastic behaviour of polyphased materials. As
                                                                               The monochromatized beam is then diffracted by the
the conversion efficiency of thermal motors such as
                                                                               sample ((200) diffracting vector): different areas in Bragg
turboreactors and gas turbines is linked to their operating
                                                                               conditions with slightly different lattice parameters scatter
temperatures, the ability to manufacture the components of
                                                                               the beam into slightly different directions. A second
their hottest parts (high pressure turbine blades and vanes)
                                                                               (311) silicon crystal called analyser diffracts again one
and to predict their behaviour and life time under various
                                                                               of those beams into an energy sensitive Ge detector. A
conditions from normal use to extreme events is of major
                                                                               rotation of the analyser probes the distribution of the
industrial interest.
                                                                               beams scattered by the specimen, i.e. the distribution of
    Besides their industrial importance, single crystal
                                                                               interplanar distances within the specimen, while a rotation
superalloys have either a cuboid microstructure, or a so-
                                                                               of the specimen measures the distribution of orientations
called rafted microstructure: they are made of coherent
                                                                               of the diffracting planes. As the (311) reflection of silicon
cuboids or of semi coherent platelets of hard L12 γ  phase
                                                                               is very narrow, the “instrumental width” of the device is
perpendicular to the [001] tensile axis [1, 2] embedded
                                                                               lower than a second of arc for a 3.65◦ two theta angle and
within a ductile fcc γ matrix. Differences between the
                                                                               can be neglected. A further reduction of the background
mechanical behaviour of the two phases and a lattice
                                                                               can be obtained by use of a double crystal diffractometer.
mismatch of a few 10−3 generate internal stresses which
superimpose to the applied load. At high temperature,                              Using the high energy beam of the ID 15 beamline
the γ matrix deforms by glide of perfect a/2                              of the ESRF or the P07 beamline of the PETRA III ring
dislocations, while the plastic strain of the γ  phase is                     at Hasylab (between 100 keV and 150keV), it is possible
believed to occur by climb of a’ and/or a’                           to do experiments in transmission and to measure lattice
dislocations exchanging vacancies [3].                                         parameters in the bulk of the specimens. Thanks to the high
    In order to build physically (i.e. dislocation) based                      intensity of the synchrotron beam, a 200 points scan can be
constitutive laws not only for the composite material, but                     recorded in less than 5 minutes: it is possible to study the
for each phase, macroscopic data such as the applied stress                    response of the material at short time intervals following a
and the average strain rate are insufficient: we need at least                 change of the applied load or temperature.
to know the average stress (strain) state of each phase,
or better the distribution of stresses (strains) within each
phase. We also need a tool to check the validity of such                       3. Scattering by a strained material
laws. The aim of the present paper is to show that the                         The shape of a diffraction peak depends on the distribution
combination of in situ experiments using high resolution                       of lattice strains within the material and the size of the
synchrotron X-Ray diffractometry and diffraction peak                          coherent zones. If we assume that the coherence length of
modelling can be such a tool.                                                  X-Rays is larger than a few micrometres, the amplitude
                                                                               scattered in the vicinity of a vector G of the reciprocal
                                                                               lattice along a vector q = G+q’ can be written as:

a   Corresponding author: alain.jacques@univ-lorraine.fr                                      A(q’) = FT{f(x). exp[2iπ G.u(x)]}.                     (1)
This is an Open Access article distributed under the terms of the Creative Commons Attribution License 4.0, which permits unrestricted use, distribution,
and reproduction in any medium, provided the original work is properly cited.

Article available at http://www.matec-conferences.org or http://dx.doi.org/10.1051/matecconf/20141405004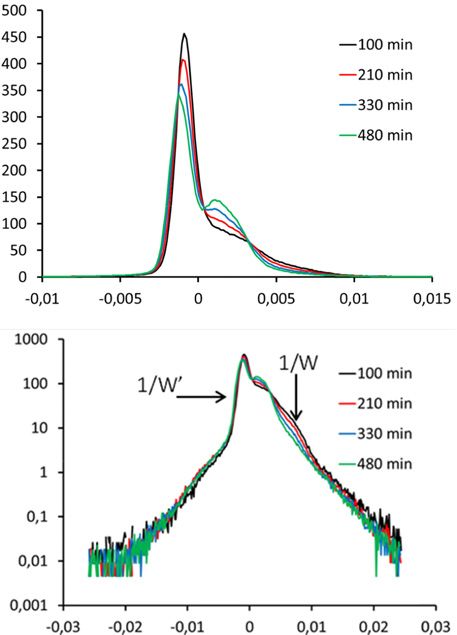
MATEC Web of Conferences
x (µm)
Figure 1. Three Crystal Diffractometer.
a
Ux (nm)
Where FT indicates the Fourier Transform, f(x) is the local
scattering factor (depending on the local chemistry and y
local structure amplitude), and u(x) is the displacement
field within the material [5]. The diffracted intensity can
then be obtained by taking I = A.A*, where A* is the
complex conjugate of A.
If the displacement field can be calculated, it is thus
possible to generate a theoretical diffraction peak which
may be compared to an experimental one. Various methods
can be used:
– Direct calculation of the superposition of the displace-
ment fields of individual cuboidal inclusions.
– Finite element methods.
– Fourier transform methods [6]. b
While the first two methods are computer intensive and,
in the first case, require analytical formulas, Fast Fourier
Transform (FFT) methods are quite efficient for large
numbers of voxels. (The same calculation for a 1283
volume takes 23 hours on a desktop computer with the first
method, and 12 minutes with the third.) Furthermore, FFT
calculations can be extended easily for inhomogeneous
materials with anisotropic elastic properties [7]. c
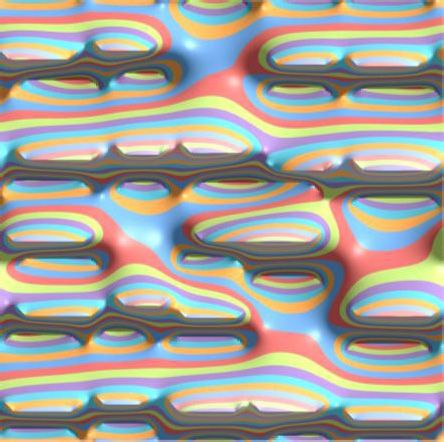
Figure 2a shows a first example of the displacement
field Ux calculated in such a way for a 2 µm cube of
superalloy containing a 0.7 volume fraction of precipitates
(size approx. 0.45 µm. See dotted lines) and a −0.003
lattice mismatch. The corresponding peak, and a top view
of its enlarged tail are given in Figs. 2b and 2c, while (200)
Fig. 2d shows the TCD profiles (vertically offset) expected
for the same cuboids microstructure, but with cubes having
bevelled edges and corners. While for perfect cubes, a
low and wide peak is expected for a 0.0045 strain, a
narrower but taller peak is obtained at 0.002 for a 0.1 µm
bevel. Assuming a constant volume fraction 1-f of γ d
matrix, a large bevel results in more γ phase at the edges
(circle in Fig. 2a) and corners, and less in the corridors a/a
(rectangle) which become thinner: the intensity scattered
by the corridors is lower and distributed on a wider peak.
The main peak also becomes slightly thinner as the highly Figure 2. yx plot of the displacement field in the x direction in
stressed elastic singularities at the corners of the cubes a superalloy and profile along the straight vertical line (a), and
disappear. Last, the distribution of cuboid sizes is wider (200) diffraction peaks (b,c,d). See text for details.
in a real microstructure than in the present model.
microstructure during a high temperature annealing at
4. Spontaneous loss of coherence 1130 ◦ C.
during high temperature annealing The top of the peak (Fig. 3a) was recorded with a 1
second counting time per step, while a 5 seconds recording
4.1. Experimental results.
and averaging were used for the tails (Logarithmic scale,
Figure 3 shows the evolution of the high resolution Fig. 3b. All diffraction profiles were normalized to a
(200) diffraction peak of a specimen with a cuboid constant unit area for comparison. The peak intensity
05004-p.2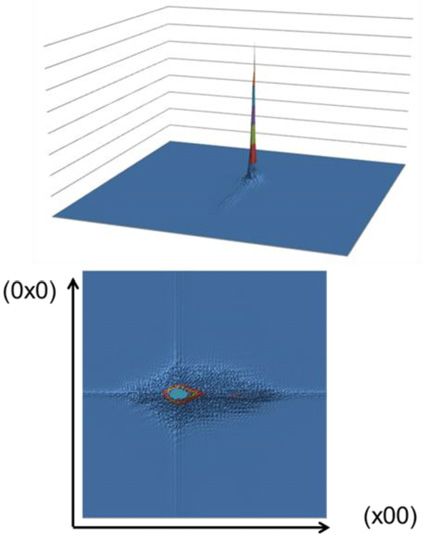
EUROSUPERALLOYS 2014

                                                                   γ  peak decreased. Another wider peak appeared at strain
                                                                   0.0015. The height of the left tail (Logarithmic scale) was
           γ' + γ                                                  unchanged, while it slightly decreased on the right side.
                                                                        After cooling, polishing and chemical etching (66%
                                                                   HCl et 33% HNO3 ), the specimens were observed by
                                                                   SEM. Lines corresponding to dislocation traces can be
                                                                   seen at the surface of the cuboids, with an average distance
                                 γ                                 of about 0.02 µm. During the high temperature annealing,
                                                                   the γ  volume fraction was lower than at room temperature,
                                                     a             and the γ corridors wider. The magnitude of the lattice
                                              strain               mismatch was larger than 0.003, and the coherence
                                                                   stresses became larger than the Orowan stress, allowing
                                                                   dislocations to glide into the γ corridors and partly
                                                                   release the coherence stresses. As this plastic relaxation
                                                                   allowed the lattice parameter of the γ corridors parallel to
                                                                   (200) to increase in the [100] direction, the corresponding
                                                                   peak shifted to the right. The intensity scattered at the
                                                                   position of the γ  peak thus decreased. The high lattice
                                                                   parameter of the corridors perpendicular to (200) was
                                                                   due to the coherence stresses in the (100) plane: as these
                                                                   stresses decreased, the position of the peak shifted to the
                                                                   left.

                                                     b
                                                                   4.2. Peak modelling

                                                                   Figure 4a shows a simulation of the diffraction peak
                                                                   (thin black line) for comparison with the experimental
                                                                   peak recorded at 100 minutes (Fig. 3a). The displacement
                                                                   field was calculated in a 2 µm3 representative volume
                                                                   containing 64 cuboids with a random size and position
                                                                   (0.42 volume fraction of γ  phase), and assuming a
                                                                   −0.0035 lattice mismatch between both phases. By
                                                                   arbitrarily giving a 0 and 1 scattering amplitude to
                                                                   the γ  (blue) and the γ (red) phases, it is possible to
                                                                   calculate their contributions to the peaks. The γ  peak
                                                                   contributes to the main peak only, while the γ intensity
                                                                   is distributed between the main peak (coherent corridors
                                                                   parallel to the g vector), the highly strained corridors
                                                c                  perpendicular to the edges (rectangles in Fig. 2a) and the
Figure 3. High resolution diffraction peak of a superalloy at      cube edges (circles). A 4.10−8 bevel at the cubes corners
1130 ◦ C in linear (a) and logarithmic (b) scale. SEM micrograph   and edges was assumed: this is probably an underestimated
(1 µm mark) after chemical etching.                                value, as the area of the intermediate peak is lower than
                                                                   the experimental one, and the right peak higher. Last, the
                                                                   width of the calculated intermediate peak is lower than the
at the top is 500 (arbitrary units) and the tails level at         experimental one.
0.01: the peak to background ratio is close to the 105                  Figure 4b compares the (green) experimental peak
range. The main peak corresponds to the γ  cuboids with           recorded at 480 minutes and peaks simulated assuming that
a contribution of the γ corridors parallel to the (200)            the lattice mismatch had been half relaxed by infinitesimal
diffracting vector. The tail on the large parameters side          dislocations. Both γ and γ  peaks are thinner than in
(Fig. 3a, right) is due to the γ corridors perpendicular           the unrelaxed microstructure (their width is approximately
to (200) [8]. The long range tails nearly follow an ε−4            divided by two) and their positions have been relatively
law: this is probably Huang scattering resulting from the          shifted by 0.00175, i.e. the plastic strain. However, if the
highly strained zones on the vicinity of point defects. At         calculated peaks have correct positions, they are thinner
intermediate strains, an interesting feature of the peaks          than the experimental ones: an ingredient is missing in
is their exponential tail (i.e. their linear slope when seen       the calculation. We believe this fact results from the
with a logarithmic scale). The inverses of these slopes            choice to use infinitesimal dislocations instead of perfect
are defined as the W and W’ parameters which will be               dislocations of the matrix: as the lattice planes remain
discussed below.                                                   continuous between interface dislocations, there is no jump
    During annealing, the width of the main γ  peak and           of the lattice parameters and some intensity should be
its γ tail decreased progressively, and the height of the          diffracted between the two peaks of Fig. 4b.

                                                            05004-p.3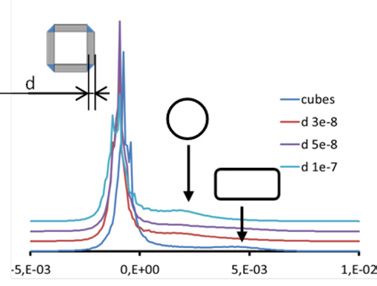
MATEC Web of Conferences

                                                                           a
                                                                                                                                   a
                                                                                 -3                                .      -6 -1
                                                                        w (10         )                                (10 s )
                                                                                               γ
                                                    a
                                               strain                       γ’
                                                                                                                               3
                                                                                                                        t (10      s)

                                                                                          -3
                                                                                 W’ (10 )                                          b

                                                    b

Figure 4. Simulated high resolution diffraction peak of
a superalloy with an unrelaxed (a) and half relaxed (b)
microstructure.

5. Peak widening during creep
5.1. Experimental results
Figure 5 shows the evolution of the W and W’ parameters
of the diffraction peaks of a rafted superalloy during a
tensile creep test under variable load at 1080 ◦ C [9]. The
applied load σa and the strain rates of each phase (γ : thin
line and γ ’: thick line) are given for comparison.
     The W parameter of the γ peak remains constant
during the beginning of the test, and only begins to increase
after a jump of the applied load up to 200 MPa. After
partial unloading of the specimen at t = 55000 s, it returns                                                                           c
to its initial value. The W’ parameter is initially 3.5 10−4 .
It begins to increase at 35000 s, under a 150 MPa applied
load, when the strain rate of the γ phase is in the 10−8 s−1
                                                                 Figure 5. a) Plot of the variations with time (1000 s) of
range. It increases up to 5.5 10−4 at the maximum load,
                                                                 the applied load (top), the W (empty diamonds) and W’(full
then decreases to 4.2 10−4 after unloading.
                                                                 diamonds) fit parameters (10−3 strain units, bottom left hand
     In the W’ vs. W plot of Fig. 5b, the experimental points    scale) and the strain rate of each phase (bottom right hand scale).
initially move from A to B, then move to the top and             b) Plot of W’ vs. W. c) Post mortem TEM micrograph taken after
downwards along the straight BC line. The slope of BC            cooling of the specimen under high stress.
varies with temperature in the 980 ◦ C to 1130 ◦ C range.
Under high stresses, the evolutions of W and W’ are thus
correlated, and are believed to be related to the dislocation    5.2. Local stresses and long range stresses
density within the γ  phase. This may be checked in
Fig. 5c, which shows a 2.5 1012 m−2 dislocation density          5.2.1. Long range stresses
in a TEM micrograph of the same specimen after cooling
under high load, as the (W, W’) point was at C.
     The same behaviour was observed on all specimens            Figure 6a schematizes the distribution of stresses within
strained at temperatures higher than 980 ◦ C.                    the rafted microstructure at the beginning of the second
                                                           05004-p.4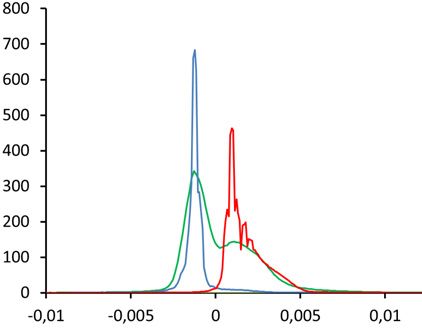
EUROSUPERALLOYS 2014

stage of a creep curve. During stage I, dislocations moved
within the (clear) γ corridors between (dark) γ  rafts, and
left dislocation segments at the γ / γ  interfaces. If given
time, these segments may react to form new dislocation
segments with their Burgers vector perpendicular to the
[001] tensile axis, and form a more or less relaxed
dislocation wall. The stress state of matter within the
microstructure is then the sum of the applied load σzz = σa ,
and of coherence stresses along the x and y directions
due to the lattice mismatch δ and the stress field of the
                                                                                                                           a
interfacial dislocation walls.
    It has been shown in [9] that the average resolved shear
stress for the plasticity of the γ corridors is equal to the
average Orowan stress σ O . We may admit this remains true
for each corridor: new dislocations may enter a corridor as
soon as the local Von Mises stress σV M = σzz – σx x is equal
to the Orowan stress for this corridor. These dislocations
will stop entering as soon as the increased stress field of
the dislocation walls at the interfaces between the same
corridor and its neighbouring γ  rafts has become large
                                                                                                                           b
enough to repel them. We can thus expect each corridor to          Figure 6. Homogeneity and heterogeneity of the interface
have on its both interfaces dislocation walls with the same        dislocation contribution to the σx x component of the stress tensor,
dislocation density. On the contrary, different corridors          before and after the onset of plasticity within the rafts.
with different thicknesses and different Orowan stresses
will have different interfacial dislocation densities. From        corridor thickness, we may expect fluctuations of the
this, we can expect a heterogeneous distribution of internal       elastic strain which decrease as the distance di to the
stresses in the γ phase (i.e. a wide γ peak), and a                interface increases. The decrease is exponential for an
homogenous distribution of stresses in the γ  rafts, because      infinite periodic dislocation wall [10]. If we consider
the stress fields of the interface dislocations of the corridor    disordered walls, the variance of the strain fluctuations
between two neighbouring rafts will cancel.                        may decrease as (d/di)−1 or (d/di)−3 depending on the
    When the applied load is high enough, the γ  rafts            type of disorder [11, 12]. As the rafts are thicker than the
begin to deform plastically. As in the case of corridors, new      corridors, the contribution of these fluctuations is probably
dislocations will be added at the interfaces on both sides of      larger in the case of the γ peak: the slope of the W’ vs. W
a raft, or will cancel with existing ones. If the plastic strain   plot Fig. 3 should be smaller than one. The fluctuations
is the same in all rafts, the same number of dislocations          should also be larger when the disorder is high, when
will disappear on both sides of all interfaces, and the            new dislocations are added randomly at the interfaces, i.e.
distribution of stresses will remain the same. Conversely,         when the strain rate of the corridors is high. They might
if some rafts deform more or less than others (Fig. 6b),           then smooth out when the strain rate decreases again, and
the density of dislocations on both sides of a corridor will       interface dislocations may rearrange into a more orderly,
become different, and the stress fields of both interfaces         low energy way. The evidence for such transient peak
will no longer cancel: the internal stresses within the γ         width increase is scarce in Fig. 5.
phase will become heterogeneous, and the width of the γ               Several arguments support a link between dislocations
peak will increase.                                                within the γ  phase and the reversible widening of the
                                                                   peaks:
5.2.2. Dislocations and reversible changes in the
shapes of the diffraction peaks                                     – Both peaks thicken when the strain rate of the rafts is
                                                                      high.
While the contribution of dislocations has not yet been             – Dislocation densities observed by TEM (Fig. 5c) are
taken into account in our modelling of diffraction peaks,             near 1013 m−2 when the experiment is stopped at
it is obvious from Fig. 4b that it is important. We shall             high strain rates for large values of W and W’, and
here first rule out the effect of interface dislocations,             1012 m−2 or lower when W and W’ were allowed to
then consider the effect of dislocations moving within the            relax under low stress.
γ  rafts on the distribution of elastic strains within the         – The slope of the W’ vs. W plots is higher than one:
material. (As dislocations are more mobile in the corridors           as the largest fluctuations occur near the dislocation
than in the rafts, their densities should be much lower).             cores, the γ corridors are shielded.
     The highly distorted areas in the vicinity of the
cores of interface dislocations should strongly contribute         An attempt to model the evolution of the distribution of
to the peak tails, at distances d lower than half the              elastic strains with the dislocation density using a 2D
distance between these dislocations, i.e. d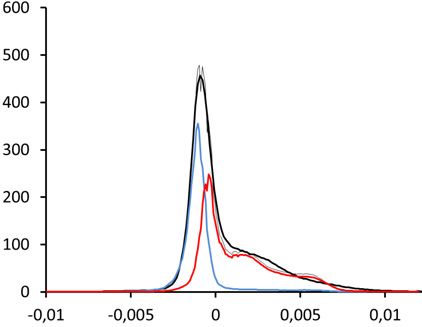
MATEC Web of Conferences

                                                                                  a superalloy than just peak positions. The peaks are very
                                       Log10(I)                                   sensitive to the details of the microstructure (bevelled
                                       (au)                                       cubes) and the distribution of elastic strains within the
                                                                                  microstructure. Thus, in situ diffraction can become a very
                                                                γ’                powerful tool to test the results of models of the plastic
                                                                                  behaviour of superalloys.
                                                                                       However, a full analysis of those peaks will require
                                                                                  extensive mechanical and physical modelling of the
                                                γ                                 material, taking many effects into account: elastic
                              a                                             b     anisotropy and inhomogeneity, point defects, and most of
                                                                                  all dislocations: further work is needed.

     ε3*I                                  Log10(w)
                      γ’                                                          The authors would like to thank the ESRF (ID15A beamline)
                                                                                  and DESY (P07 beamline, “CALIPSO: EU Support of Access
                                                          γ’ γ                    to Synchrotrons/FELs in Europe”) for beamtime and help for
                                                                                  the experiments, and Snecma (SAFRAN) for providing the AM1
                      γ                                                           specimens.

                           ε c                                      ρ’d
                                      10   11
                                                10   12
                                                          10   13
                                                                     1014   d     References
                                                                                   [1] P. Caron and T. Khan, Materials Science and
Figure 7. 2D modelling of the distribution of elastic strains due
                                                                                       Engineering 61, (1983) 173
to dislocation within the γ  rafts. a) Model; b) strain distribution
in both phases; c) plot of ε3 .I(ε) vs. ε; d) evolution of the W                   [2] T.M. Pollock and A.S. Argon, Acta Metall. Mater 40,
parameters with the dislocation density within the rafts.                              (1992) 1
                                                                                   [3] F. Mompiou and D. Caillard, Mater. Sci. Eng. A 483,
                                                                                       (2008) 143
[100] Burgers vectors at random positions (but the same                            [4] K. D. Liss et al., J. Synchrotron Rad. 5, (1998) 82
number of positive and negative signs in each raft) were                           [5] N. Vaxelaire et al, New Journal of Physics 12, 035018
added in the γ  rafts. The distribution of strains was                                (2010)
calculated for an isotropic and homogenous material using                          [6] T. Mura, Micromechanics of defects in solids 2nd
periodic conditions, and is given for both phases in Fig. 7b                           edition, Martinus Nijhof editions (1987), ISBN 90-
for ρd ’ = 1013 . As expected, the γ  peak is wider and has                           247-3343-X
a larger tail: the plot of ε3 .I(ε) in c) shows that the tails                     [7] H. Moulinec, P. Suquet, Comp. Meth. Appl. Mech.
of the distribution indeed varies as ε−3 [13, 14] in the γ                            Engng. 157, 69–94 (1998)
phase for strains larger than 0.01, and decreases faster in                        [8] H. Mughrabi, H. Biermann and T. Ungar, Journal
the γ phase.                                                                           of Material Engineering and Performance 2(4), 557
    The double logarithmic plot in Fig. 7d shows that W                                (1993)
and W’ vary as power laws of ρd ’ with exponents 0.49 (W)                          [9] L. Dirand et al., Phil. Mag. 93 (2013) 1384
and 0.64 (W’). From statistical arguments (the variance of                        [10] J.P. Hirth and J. Lothe, Theory of dislocations, 2nd
W and W’ should vary as the dislocation density), a 0.5                                New edition of Revised edition, Krieger Publishing
exponent is expected. Last, the shape of a diffraction peak                            Company (1991) ISBN-13: 978-0894646171
does not depend only on the distribution of strain, but also                      [11] G. Saada and E. Bouchaud, Acta Metall. 41, (1993)
on the size of coherent zones, which cannot be modelled                                2173
in the present approximation.                                                     [12] G. Saada and D. Sornette, Acta Metall. 43, (1995)
                                                                                       313
                                                                                  [13] T. Ungár, and A. Borbély, Applied Physics Letters
6. Conclusion                                                                          69, (21), (1996) 3173
From the present examples, it can be seen that high                               [14] I. Groma, and A. Borbély, A. Diff. Analysis of the
resolution diffraction peaks can give much more data on                                Microst. of Materials 68 (2004) 287

                                                                            05004-p.6
You can also read