ARTICLE Hyperspectral mid-infrared ellipsometric measurements in the twinkling of an eye
←
→
Page content transcription
If your browser does not render page correctly, please read the page content below
VOL. 32 NO. 2 (2020)

  ARTICLE

Hyperspectral mid-infrared
ellipsometric measurements in
the twinkling of an eye
Karsten Hinrichs, Christoph Kratz and Andreas Furchner
Leibniz-Institut für Analytische Wissenschaften – ISAS – e.V., Department Berlin, Schwarzschildstr. 8, 12489 Berlin,
Germany
Contacts
karsten.hinrichs@isas.de ( 0000-0002-6580-7791)
andreas.furchner@isas.de ( 0000-0002-5448-7956)

Introduction                                    also interpretation with respect to film      FT-IR spectroscopy both in far-field and
Fast, contact-less and destruction-free         thickness, molecular structure, composi-      near-field IR-related techniques. Typical
hyperspectral infrared (IR) techniques          tion and homogeneity of these param-          applications are time-resolved 13 and
that enable large-area mapping within           eters.                                        hyperspectral IR ellipsometry8 (Sentech
short measurement times are highly                                                            Instruments), photothermal AFM-IR 2
relevant for research and industry in           Laser-based IR imaging                        (e.g., from Bruker/Anasys), visible-
environmental, biomedical, material and         Mid-infrared (MIR) imaging beyond clas-       diffraction limited spectroscopy11 [e.g.,
space applications. Laser-based meth-           sical Fourier-transform infrared (FT-IR)      optical photothermal infrared (O-PTIR)
ods provide high optical throughput as          techniques recently showed promising          spec troscopy from Photothermal
well as high spectral, spatial and tempo-       developments for material science,1–8         Spectroscopy Corp.], and scattering
ral resolution, and are thus of particular      medical diagnostics and the study of          near-field IR spectroscopy1,5 (e.g., from
interest for analytical, process, laboratory    biological samples.9–11 IR spectroscopic      Neaspec and Bruker).
and field applications.                         applications are significantly broadened         In this article, we focus on MIR laser-
   In this article, we focus on a recently      and strengthened by modern technical          based polarimetric imaging (i.e., hyper-
introduced, rapid, laser-based hyper-           advances such as upconversion-based           spectral ellipsometry) as a new method
spectral method for thin-film analysis in       hyperspectral imaging,4,9 hyperspectral       to simultaneously reveal vibrational,
the mid-IR fingerprint range. Featuring         nanospectroscopy,1–3,5–7,10 frequency-        structural and thickness information.8,13
a polarimetric single-shot design, both         comb techniques,12 visible-diffraction
phase and amplitude information                 limited optical photothermal IR multi-        Method of hyperspectral
related to refractive and absorption indi-      spectral imaging,11 and QCL-based             single-shot ellipsometry
ces are simultaneously recorded. A tune-        single-shot polarisation dependent            The developed hyperspectral IR laser
able, pulsed quantum cascade laser              hyperspectral concepts.7,8,13                 polarimeter incorporates a four-chan-
(QCL) enables spectrally highly resolved           IR imaging as a linear optical technique   nel division-of-amplitude concept14 that
(
VOL. 32 NO. 2 (2020)
ARTICLE
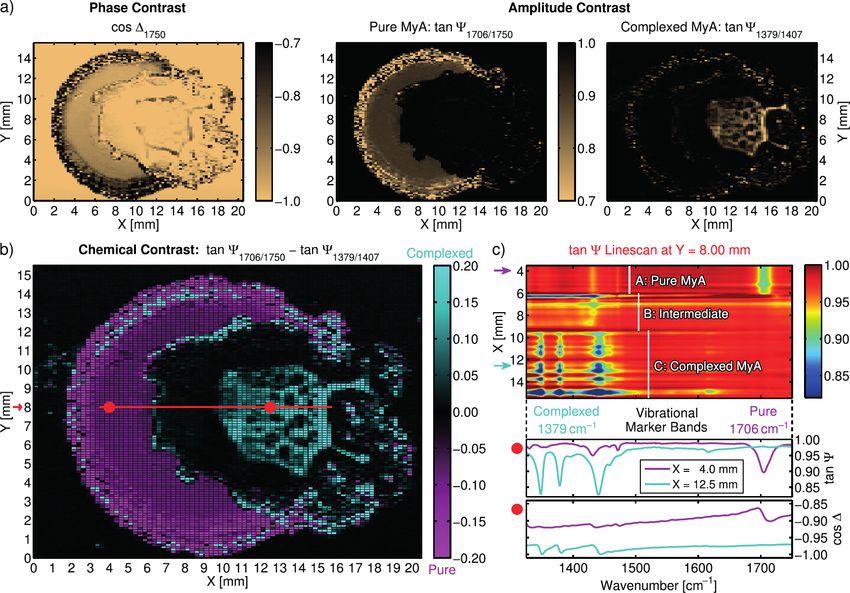
The polarimeter (Sentech j = 0, 1, 2,… number of layers, with rp and showing exemplary images and spec-
Instruments) consists of a tilt- and rs being the p- and s-polarised complex tra obtained from the multidimensional
height-adjustable sample mapping reflection coefficients. The optical data cube.
stage (50 mm × 50 mm) and an auto- constants N = n + ik (N: complex refrac- Figure 1a shows complementary
collimation unit for defined sample tive index; n: refractive index; k: absorp- phase and amplitude contrast images
alignment. A pulsed external-cavity tion index) are related to the complex at different IR wavelengths. These
QCL (MIRcat 2100, Daylight Solutions) dielectric function e = e1 + ie2 via N = √e. images readily identify areas with vary-
is employed as a brilliant, broadband- Measuring both Y and D yields ing thicknesses (mainly in cos D) and/
tuneable radiation source. A custom- complementary information regard- or a chemical structure (mainly in tan Y).
built beamsplitter optics divides and ing the sample’s optical and structural The chemical contrast image in Figure 1b
directs the laser beam into four paral- properties, thus providing a means to shows the difference in band amplitudes
lel detection channels, each equipped in-depth sample analysis. Various routes of two vibrational markers at 1706 cm−1
with a polarising unit (KRS-5 wire- are possible for evaluating the structure- (associated with C=O carboxyl vibra-
grid polariser, Specac) and a photo- related baselines and material-specific tions of pure MyA) and at 1379 cm−1
voltaic InAsSb detector (P13894-211, vibrational bands of hyperspectral IR (associated with complexed MyA), thus
Hamamatsu). A custom-built gated- ellipsometric data, including direct spec- enabling the direct visual domain separa-
integrator electronics synchronises the tral interpretation, optical modelling and tion of pure and complexed MyA.
polarisation-state analysers of the four multivariate analysis. A spectral tan Y linescan along the red
channels, thus enabling single-shot line in Figure 1b is presented in Figure
ellipsometric measurements. Hyperspectral IR 1c, highlighting the distinct vibrational
By selecting specific polariser settings ellipsometry characteristics of the different sample
and additional optical elements like Single-shot hyperspectral IR polarimetric areas. Comparing the variations in spec-
retarders, it is possible to tailor the imaging of a sample provides ellipsomet- tral intensities reveals that regions of pure
four detection channels. This flexible ric parameters dependent on wavelength MyA are rather homogeneous, whereas
approach allows one to measure various and up to three spacetime coordinates. those with complexed MyA exhibit
polarimetric parameters, for example, Regarding data interpretation, character- pronounced heterogeneity in surface
ellipsometric amplitudes (tan Y), phases istic vibrational bands such as carboxyl, coverage. Pure and complexed domains
(D) or specific Mueller-Matrix elements CHx and amide bands16 of lipids, proteins are separated by an area with low cover-
related to the sample’s polarimetric prop- and polymers yield detailed insights into age.
erties (e.g., circular/linear dichroism and the film’s properties.13 Such data, there- A detailed vibrational analysis of, for
birefringence).15,7 fore, enable unprecedentedly compre- example, the n(C=O) band can eluci-
In this contribution, we focus on hensive, laterally resolved analysis with date molecular interactions and orien-
single-shot measurements of the ellip- respect to molecular structure, chemistry, tations in such complex heterogeneous
sometric angles Y and D. Using a differ- interactions, optical anisotropy, composi- samples. Beyond such a spectral inter-
ent polariser setting a in each of the four tion, morphology, film thickness and vari- pretation, a polarimetric approach can
detection channels, the single-shot ellip- ations thereof. (as stated in Reference 15) “provide a
someter measures Y and D from the In the following, we present two exam- number of contrast mechanisms besides
intensities Ia according to: ples: one on the simultaneous phase traditional unpolarized radiation intensity,
and amplitude mapping of a heterogene- including linear depolarization, circular
I90 I0
cos 2Y , ous surface and one on a time-depend- depolarization, cross-polarization, direc-
I90 I0
ent investigation of individual sample tional birefringence and dichroism.” The
I45 I135
sin2Y cosD spots under external temperature stimuli. high contrast resulting from the ellipso-
I45 I135 (1)
metric measurement could have tremen-
Further technical details regarding the Hyperspectral imaging of dous application potential for the imaging
device and measurement protocol can heterogeneous thin films and characterisation of complex surfaces
be found in References 8 and 13. The first sample is a drop-cast (e.g., tissue classification for cancer iden-
The ellipsometric angles Y and D are thin film of myristic acid (MyA) tification, quality and morphology control
functions of the incidence angle j0, the [ C H 3 ( C H 2 ) 12 C O O H ] o n a g o l d of materials). In this regard, hyperspec-
wavelength l, the optical constants of s u b s t r a te .13 T h e h o m o g e n e o u s , tral data analysis based upon neural
substrate (NS), ambient medium (N0) 150 nm thick film was partially chem- networks, multivariate analysis and/or
and layers (Nj), as well as of the indi- ically modified using droplets of optical modelling could be a promising
vidual layer thicknesses dj, NaOH dissolved in ethanol, resulting tool for gaining a detailed understanding
in areas of pure MyA, intermediate of the structural and chemical specifici-
rp regions and areas of complexed-like ties of the sample.
tanY e i D F 0, , NS , N0 , N j , d j
rs MyA. Hyperspectral measurements Together with the high stabilit y
(2) of the film are presented in Figure 1, concerning disturbing environmental
www.spectroscopyeurope.com SPECTROSCOPYEUROPE 11VOL. 32 NO. 2 (2020)
ARTICLE
Figure 1. Hyperspectral IR ellipsometry images of a partially chemically modified, drop-cast MyA film. a) Phase and amplitude contrast at different
wavelengths. b) Chemical contrast between pure and complexed MyA. c) tan Y linescan across the heterogeneous sample surface and exemplary
ellipsometric spectra. Reprinted with permission from Reference 8 (©2019, Optical Society of America).
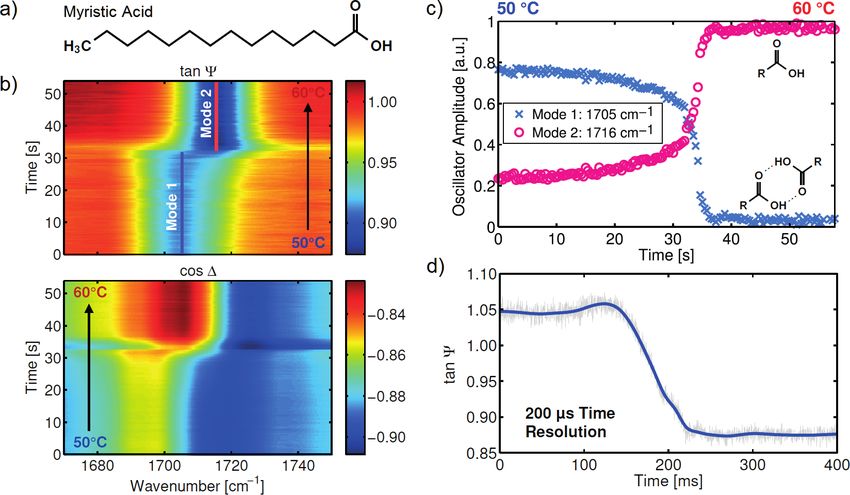
absorptions,7 the capabilities of the µs to hour range. This point is illustrated While both mode 1 and 2 are present
IR laser ellipsometer make accessible in Figure 2, which displays the temper- below the phase transition, only mode
multiple new IR spectroscopic imaging ature-resolved investigation of the ther- 2 is found above it. These observed
applications regarding the analysis of mal phase transition of a 150 nm thick changes reveal a tight interrelationship
structured, anisotropic films and biolog- MyA film around 55 °C.13 The amplitude between molecular interactions and
ical samples. Interesting systems to and phase images in Figure 2b show the thermo-induced phase transition.
be investigated with the device range n(C=O) band progression (cf. spectra in As these presented measurements
from functionalised surfaces and coat- Figure 1c). Characteristic band compo- demonstrate, the new IR polarimeter
ings, to polymer and protein materials, nents due to differently interacting C=O covers multiple time scales ranging from
minerals, as well as solar cells, OLEDs groups can be identified. A strongly inter- µs to minutes. The results highlight the
and other optoelectronic devices and acting component (mode 1) is found in applicability and sensitivity of the tech-
sensors. the solid phase at 50 °C, and a weakly nique for time-dependent analyses of
interacting one (mode 2) occurs at non-cyclic, irreversible processes and
Time-resolved studies of thin- higher wavenumbers mainly in the liquid reactions. We see powerful applications
film phase transitions phase at 60 °C. in process and quality control, but also in
Spectra of single spots can be monitored Figure 2c shows the time-dependent rheology, relaxation and related studies.
within about 100 ms, and single wave- development of the two n(C=O) band Because of the ellipsometer’s small spot
lengths even as rapidly as 10 μs. The IR components obtained from Figure 2b size (0.03 mm2), low sample volumes
laser polarimeter, therefore, pushes new during slow heating. Figure 2d displays and amounts can also be studied.
possibilities for time-resolved measure- the corresponding single-wavelength Currently, we are working on coupling
ments of non-cyclic processes via flex- monitoring of mode 1 during rapid cool- microfluidic flow cells17 to the instrument
ible measurement durations from the ing with a time resolution of 200 µs. in order to image and analyse processes
12 SPECTROSCOPYEUROPE www.spectroscopyeurope.comVOL. 32 NO. 2 (2020)
ARTICLE
Figure 2. Time-resolved IR laser ellipsometry of the solid-to-liquid phase transition of a fatty-acid thin film upon heating/cooling. a) Chemical struc-
ture of MyA. b) n(C=O) band amplitude and phase during slow heating. c) Oscillator amplitudes of mode 1 and 2 fitted from the spectral images.
Reprinted with permission from Reference 13 (©2019, Optical Society of America). d) Sub-ms single-wavelength monitoring of mode 1 during rapid
cooling.
of functional, sensor and biocompat- imaging and spectroscopy of order, 5. I. Amenabar, S. Poly, M. Goikoetxea,
ible surfaces at solid–liquid interfaces. phases, and domains in complex W. Nuansing, P. Lasch and R.
The set-up will then allow for sens- solids”, Adv. Phys. 61, 745–842 Hillenbrand, “Mid-infrared upcon-
ing of molecular adsorptions, structural (2012). https://doi.org/10.1080/00 version based hyperspectral imag-
transitions and the study of intra- and 018732.2012.737982 ing”, Nat. Commun. 8, 14402
intermolecular interactions of nL to mL 2. A. Dazzi and C.B. Prater, “AFM- (2017). https://doi.org/10.1038/
samples. IR: technology and applications in ncomms14402
A laser application laboratory will be nanoscale infrared spectroscopy 6. K. Hinrichs and T. Shaykhutdinov,
opened at ISAS Berlin (anticipated for and chemical imaging”, Chem. Rev. “Polarization-dependent atomic
the end of 2020) operating and making 117, 5146–5173 (2017). https://doi. force microscopy–infrared spec-
available a hyperspectral IR laser ellip- org/10.1021/acs.chemrev.6b00448 troscopy (AFM-IR): infrared nano-
someter. 3. A. Huber, D. Kazantsev, F. Keilmann, polarimetric analysis of structure
J. Wittborn and R. Hillenbrand, and anisotropy of thin films and
Funding “Simultaneous IR material recog- sur faces”, Appl. Spectrosc. 72,
Eu ro p ä i s c h e r F o n d s f ü r re g i o n- nition and conductivity mapping 817–832 (2018) . ht tps://doi.
ale Ent wicklung (EFRE) (1.8/13); by nanoscale near-field micros- org/10.1177/0003702818763604
Ministerium für Innovation, Wissenschaft copy”, Adv. Mater. 19, 2209–2212 7. K. Hinrichs, T. Shaykhutdinov, C.
und Forschung des Landes Nordrhein- (2007). https://doi.org/10.1002/ Kratz and A. Furchner, “Brilliant mid-
Westfalen; Regierender Bürgermeister adma.200602303 infrared ellipsometry and polarime-
von Berlin – Senatskanzlei Wissenschaft 4. S. Junaid, J. Tomko, M.P. Semtsiv, J. try of thin films: toward laboratory
und Forschung; Bundesministerium für Kischkat, W.T. Masselink, C. Pedersen applications with laser based tech-
Bildung und Forschung. and P. Tidemand-Lichtenberg, niques”, J. Vac. Sci. Technol. B
“Mid-infrared upconversion based 37, 060801 (2019). https://doi.
References hyperspectral imaging”, Opt. Exp. org/10.1116/1.5122869
1. J.M. Atkin, S. Berweger, A.C. Jones 26, 2203–2211 (2018). https://doi. 8. A. Furchner, C. Kratz, J. Rappich
and M.B. Raschke, “Nano-optical org/10.1364/OE.26.002203 and K. Hinrichs, “Hyperspectral
www.spectroscopyeurope.com SPECTROSCOPYEUROPE 13VOL. 32 NO. 2 (2020)
ARTICLE
infrared laser polarimetry for single- 11. D. Zhang, C. Li, C. Zhang, M.N. 14. R. Azzam, “Multichannel polar-
shot phase–amplitude imaging of Slipchenko, G. Eakins and J.-X. ization state detectors for time-
thin films”, Opt. Lett. 44, 4893–4896 Cheng, “Depth-resolved mid-infra- resolved ellipsometry”, Thin Solid
(2019). https://doi.org/10.1364/ red photothermal imaging of living Films 234, 371–374 (1993) .
OL.44.004893 cells and organisms with submi- ht tps://doi.org/10.1016/0040-
9. M. Hermes, R. Brandstrup Morrish, crometer spatial resolution”, Sci. Adv. 6090(93)90288-Z
L. Huot, L. Meng, S. Junaid, J. 2, e1600521 (2016). https://doi. 15. J. Qi and D.S. Elson, “A high defi-
Tomko, G.R. Lloyd, W.T. Masselink, P. org/10.1126/sciadv.1600521 nition Mueller polarimetric endo-
Tidemand-Lichtenberg, C. Pedersen, 12. K.L. Vodopyanov, E. Sorokin, I.T. scope for tissue characterisation”,
F. Palombo and N. Stone, “Mid-IR Sorokina and P.G. Schunemann, Sci. Rep. 6, 25853 (2016). https://
hyperspectral imaging for label-free “Mid-IR frequency comb source doi.org/10.1038/srep25953
histopathology and cytology”, J. Opt. spanning 4.4–5.4 μm based on 16. A. Barth, “Infrared spectroscopy
20, 023002 (2018). https://doi. subharmonic GaAs optical parametric of proteins”, Biochim. Biophys.
org/10.1088/2040-8986/aaa36b oscillator”, Opt. Lett. 36, 2275–2277 Acta 1767, 1073–1101 (2007).
10. D. Perez-Guaita, K. Kochan, M. (2011). https://doi.org/10.1364/ h t t p s : / / d o i . o r g / 1 0 .1 016 / j .
Batty, C. Doerig, J. Garcia-Bustos, S. OL.36.002275 bbabio.2007.06.004
Espinoza, D. McNaughton, P. Heraud 13. A. Furchner, C. Kratz and K. Hinrichs, 17. C. Kratz, A . Furchner, T.W.H.
and B.R. Wood, “Multispectral atomic “Sub-second infrared broadband- Oates, D. Janasek and K. Hinrichs,
force microscopy-infrared nano-imag- laser single-shot phase–amplitude “Nanoliter sensing for infrared bioan-
ing of malaria infected red blood polarimetry of thin films”, Opt. Lett. alytics”, ACS Sensors 3, 299–303
cells”, Anal. Chem. 90, 3140–3148 44, 4387–4390 (2019). https://doi. (2018). https://doi.org/10.1021/
(2018). https://doi.org/10.1021/acs. org/10.1364/OL.44.004387 acssensors.7b00902
analchem.7b04318
14 SPECTROSCOPYEUROPE www.spectroscopyeurope.comYou can also read