RESEARCH FRONT - CSIRO ...
←
→
Page content transcription
If your browser does not render page correctly, please read the page content below
RESEARCH FRONT
CSIRO PUBLISHING

Journal of Southern Hemisphere Earth Systems Science
https://doi.org/10.1071/ES19045

     The changing role of operational meteorologists

     Jenny Sturrock A,B and Deryn Griffiths A
     A
         Australian Bureau of Meteorology, GPO Box 1289, Melbourne, Vic 3001, Australia.
     B
         Corresponding author. Email: jenny.sturrock@bom.gov.au

     Abstract. The Bureau of Meteorology is changing the way forecasts are produced, from a labour-intensive approach to
     a more streamlined approach. We describe the essence of the new forecast process using a case study to demonstrate a
     situation in which meteorologists use their professional judgement to modify what would otherwise be a largely automated
     forecast service.

     Keywords: automated forecast, automation, FirstCut, forecast guidance, forecast production, forecaster’s role, forecasting,
     GFE, graphical forecasts, grid, grid edits, model blend, OCF, value-add.

     Received 28 May 2020, accepted 1 July 2020, published online 17 September 2020

1 Background                                                          withgoodconsistencybetweenNewSouthWalesandQueensland,
Since 2008, operational meteorologists at the Bureau of Meteo-        but a clear discontinuity where the Queensland and the Northern
rology (BOM) have used a software package called the Graphical        Territory areas of responsibility meet.
Forecast Editor (GFE) to generate graphical and text-based               Other concerns included a lack of control of the automati-
forecasts and warnings across Australia. The GFE allows fore-         cally generated text forecast. Sometimes meteorologists spent
casters to blend and edit data fields (such as wind, temperature,     time editing grids to capture their forecasts but the resulting
dew point, cloud cover and rainfall) from numerical models, or        automatically-generated text would not communicate the key
other gridded guidance, using graphical tools to produce weather      aspects of the situation. Other times, they would edit the grids
forecasts for the following seven days.                               specifically to obtain desired text forecasts and in doing so
   Guidance available to forecasters within GFE includes direct       publish a gridded forecast that was less than ideal. Extra work
numerical model output such as ACCESS-G (BOM 2012b)                   was also created by the need to run several GFE tools to ensure
interpolated to the scale of the GFE grid, and Operational            weather elements maintained consistency after editing (for
Consensus Forecast (OCF) guidance, which is a bias-corrected          example, ensuring that dew point temperatures did not exceed
blend of many different numerical models. The OCF algorithm is        temperature, or that wave heights were consistent with forecast
described in BOM (2012a, 2014), and has had further improve-          wind strengths).
ments since then.                                                        Over time questions began to arise: was the Bureau of
   Meteorologists have responsibility for one of seven regions,       Meteorology seeing a sufficient return on investment? That is,
largely aligned with state borders. They use their professional       was forecaster time spent editing grids resulting in enough
judgement to select the best starting point in terms of numerical     improved accuracy to justify their work? In 2019 a new approach
model data fields or other guidance, and then edit those fields to    was developed: the Optimised Forecast Process. The process was
construct a forecast that accurately depicts the expected weather.    designed to achieve a delicate balance between relying on
Tools within GFE range from ones that conduct simple linear           automated output as much as possible while maintaining a high
adjustments over an area and time period, to more sophisticated       standard of accuracy and producing final products that are fit for
tools that include algorithms that account for aspects such as        purpose, including suiting customers who use them to base
elevation, distance from coast, whether wind is upslope or            decisions on, and suiting meteorologists using them as a tool to
downslope, onshore or offshore and so on. Once the forecast is        communicate potential impacts. The Optimised Forecast Process
captured in a gridded format, the GFE generates text forecasts        is predicated on the high standard of much of the guidance
based on the grids. There is an opportunity for meteorologists to     available, including its improved performance over recent years.
review and edit the text forecasts before they are issued. Both the   It acknowledges situations in which human-added value is
gridded and text forecasts are made available to the public. See      important to improve the accuracy of the products and ensure
Leeuwenburg (2009) for a further description of GFE and Fig. 1        they communicate key messages.
for an example of the GFE interface.                                     The change to operations with the implementation of the
   There were issues with this approach, including border             Optimised Forecast Process is not a standalone change, but part of
consistency. In extreme cases, forecast rainfall, storms or fog       a broader restructure and refocus of the Bureau of Meteorology,
would end abruptly at state boundaries. Fig. 2 shows an example       which they refer to as the Public Services Transformation.

Journal compilation  BoM 2020 Open Access CC BY-NC-ND                                                  www.publish.csiro.au/journals/es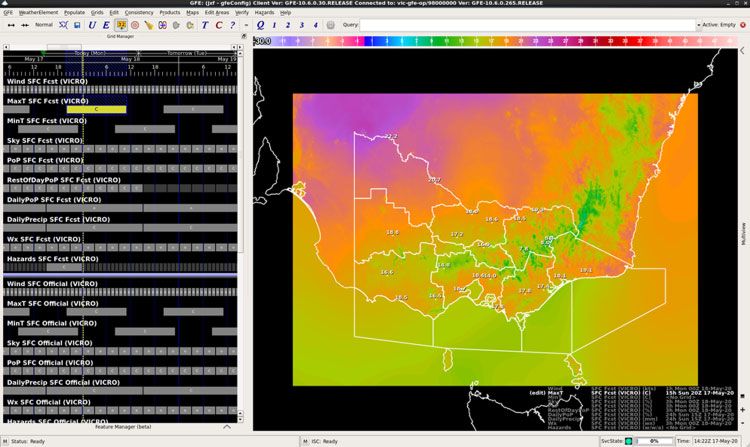
B     Journal of Southern Hemisphere Earth Systems Science                                                                J. Sturrock and D. Griffiths

                  Fig. 1. The GFE software. On the left, forecast elements and model or other guidance data can be selected. The
                  right shows a selected field and validity time (in this case maximum temperature across Victoria).

                                                                                                       LEGEND

                                                                                                       Rainfall (mm)
                                                                                                           200 +
                                                                                                           150–200
                                                                                                           100–150
                                                                                                           50–100
                                                                                                           25–50
                                                                                                           15–25
                                                                                                           10–15
                                                                                                           5–10
                                                                                                           1–5
                                                                                                           0–1
                                                                                                           no data

                  Fig. 2. Published GFE grids for the 75th percentile of rainfall forecast (mm) for Monday 9 March 2020, issued on
                  8 March 2020. The display shown is from www.bom.gov.au/australia/meteye.

2 The Optimised Forecast Process
The Optimised Forecast Process was developed and implemented                The grid edits are referred to as interventions. The criteria for
during 2019 (BOM n.d.). It is backed by verification and focuses            making interventions are discussed in more detail below. How-
on freeing up forecaster time enabling them to undertake other              ever, essentially the process takes into account the lead-time and
high impact activities. The process includes the use of FirstCut            outcome confidence of the event, and assesses the value inter-
Forecast guidance, described below, and stipulates that GFE grids           vention would have as measured by improvement to community
are only edited by forecasters when certain criteria are met.               safety and prosperity.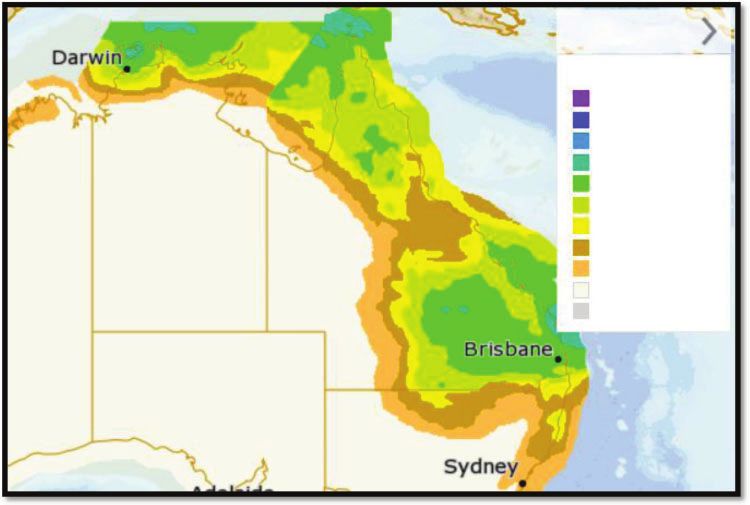
The changing role of operational meteorologists Journal of Southern Hemisphere Earth Systems Science C
GREY No intervention when an intervention is expected to have a ‘critical effect on
YELLOW Intervention recommended forecast/warning service outcome’.
RED Intervention required Consider an event expected in 6 days’ time where there is only
low confidence in the forecast and any one scenario modelled for
this weather event is considered ‘Unlikely’. Intervention would
Almost only be recommended if it was judged as adding ‘Extremely
certain
High’ value. For example, if there was a developing Tropical
Cyclone, or even the possibility of one, then professional
Probability →
Likely judgement would be used to ensure the grids and text forecasts
are consistent with the desired messaging around such a signifi-
cant event.
Possible When an event is forecast to occur in three days’ time with a
good degree of certainty regarding the general situation, then
intervention may be recommended for events such as capturing
Unlikely areas where severe thunderstorms are expected, or detail around
an expected significant wind change.
Extremely
Moderate
3 Case study
high
High
Low
We illustrate the Optimised Forecast Process by describing how it
was applied to a particular event.
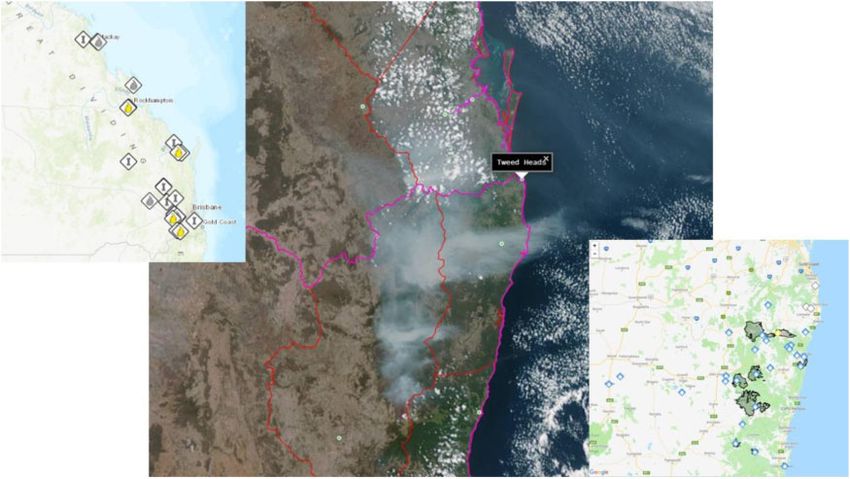
Value of intervention → Hot, dry conditions ahead of an unstable wind change meant
resultant fire activity on 8 and 9 October 2019 were fire flare up
Fig. 3. The intervention assessment matrix from the Optimised Forecast days in northeast New South Wales and southeast Queensland,
Process. The Probability reflects the confidence in the forecast. The Value
as illustrated in Fig. 4.
reflects the impact of changing the forecast.
Consider the position of the operational meteorologists on 8
October. They would have had a busy shift, monitoring and
issuing forecasts and warnings for fires that day and the next. In
FirstCut Forecast guidance relies heavily on OCF data where addition, they would have been assessing the weather situation
possible, including for wind, temperature, dew point and precipi- for the period 10 to 15 October and comparing their expectation to
tation. It includes modifications of OCF shown to improve the FirstCut Forecast guidance.
accuracy such as increasing wind speeds around alpine topogra- They would have noted a signal of precipitation expected
phy, and modifications to ensure consistency between elements. over the bushfire affected areas in northeast New South Wales
FirstCut Forecast guidance also includes automated running of and southeast Queensland on 11 and 12 October. The models
some GFE tools to populate grids where necessary, such as the suggested 10–20 mm as illustrated in Fig. 5, though note that
‘Weather’ grid with categorical elements such as ‘Isolated the values in Fig 5 are for a 6-hour period rather than the full 2-day
Showers’ or ‘Patchy Frost’. period. The occurrence of widespread rainfall over the fire
To begin, the forecaster loads the FirstCut Forecast guidance affected area would have an important dampening effect on the
then runs through the intervention rules to determine whether fires. The region had experienced three very dry and warm years
to change the gridded forecasts before publishing them. As (BOM 2019a, 2019b). Some October maximum temperature
implemented in 2019, the Optimised Forecast Process is applied records had already been broken (BOM 2019d) and the preceding
to grids populating the time scale of three days or more in advance. month had mean maximum temperatures in the top decile (BOM
The forecasts for today, tomorrow and the next day currently 2019c). Fire danger indices in September were very much above
remain subject to professional oversight and judgement. average as shown in Fig. 6.
The rules for intervention as stipulated in the Optimised However, rather than widespread rainfall, the forecasters in
Forecast Process take into account the synoptic situation and New South Wales and Queensland determined that the precipita-
weather elements of interest and rate how valuable an interven- tion would result from thunderstorms.The rainfall was likely tobe
tion is to the quality of the output and service. The Optimised highly spatially variable, with some sites receiving less than 1 mm
Forecast Process considers the value of the intervention accord- and others well over 20 mm. The distinction in precipitation type
ing to customer impact and the confidence in the forecast. After would have been important for emergency services, keen to know
assessment the forecaster arrives at a result of no intervention, the extent to which forecast rainfall might contribute to extin-
intervention recommended, or intervention required. The matrix guishing the ongoing fires. Furthermore, emergency services
summarising how the assessment is made is shown in Fig. 3. needed to know that severe wind gusts, causing damage and
No intervention means an assessment has determined that driving erratic and dangerous fire behaviour, and lightning, with
altering the grid would have ‘no effect on forecast/warning the potential to start new fires, were likely.
service outcome’. Intervention recommended is for situations In addition to the interest from the fire agencies, there was
where an intervention would have a ‘demonstrable effect on substantial community and media interest in the weather and
forecast/warning service outcome’. Intervention is required particularly in the potential for rain during the forecast period.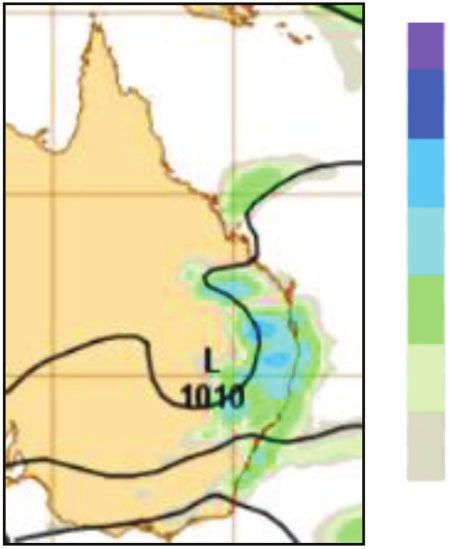
D     Journal of Southern Hemisphere Earth Systems Science                                                                J. Sturrock and D. Griffiths

          Fig. 4. Left: Location of fires in southeast Queensland as of 10 October 2019. Middle: Satellite imagery from the afternoon of 9
          October 2019. The map overlay shows the forecast districts, with the Southeast Coast of Queensland and the Northern Rivers in New
          South Wales being the main two coastal districts. Right: Location of fires in northeast NSW as of 10 October 2019.

                                                                             forecasts to ensure that the messaging balanced the possibility
                                                                             of rainfall with information about it resulting from gusty thunder-
                                                                   50        storms. Their decision was in line with the Optimised Forecast
                                                                             Process.
                                                                                 The forecasters assessed that intervention was recommended
                                                                   20        or required. Using the matrix shown in Fig. 3, they had high
                                                                             confidence in the expected situation (that is, probability of Likely),
                                                                             and assessed the value as High to Very High because intervention
                                                                   10        would ensure that the graphical and text forecasts aligned with
                                                                             key messaging to the general public, the fire agencies and other
                                                                             emergency services. In comparison had the expected thunder-
                                                                   5         storms been expected over an area not affected by bushfires or
                                                                             drought,theinterventionvaluewouldhavebeenassessedasLowto
                                                                             Moderate and no intervention would have been pursued.
                                                                   2             In Queensland the interventions to the 3–4 day forecast
                                                                             included some modifications of the Chance of Rain, but the main
                                                                             focus of the intervention was on capturing the areas of thunder-
                                                                   1         storms appropriately within the gridded forecast. In New South
                                                                             Wales the main focus of the intervention was regarding the
                                                                             description of the thunderstorms.
                                                                   0.2           Widespread thunderstorm activity was observed over the two
                                                                             days with many rainfall totals around 10 mm and isolated heavier
                                                                             falls of up to 50 mm. The forecast, as captured by the GFE grids
                                                                             following intervention, was well aligned with messaging pro-
                                                                             vided by other means such as social media, radio interviews and
Fig. 5. Rainfall forecast by ACCESS-G for a 6-hour period overnight          briefings to the fire agencies.
(12 to 18 UTC) 11–12 October, issued on 8 October.
                                                                             4 The future
   On the whole, operational meteorologists in New South Wales               Meteorologist are continually adapting to new forms of data, and
and Queensland decided they were happy with OCF guidance                     new means of communicating forecasts. They understand that
from the FirstCut Forecast process regarding the likelihood of               their role will continue to change. For example, there are plans
rain. However, they decided to intervene in the thunderstorm                 to issue forecasts of the Probability of Thunderstorms. As the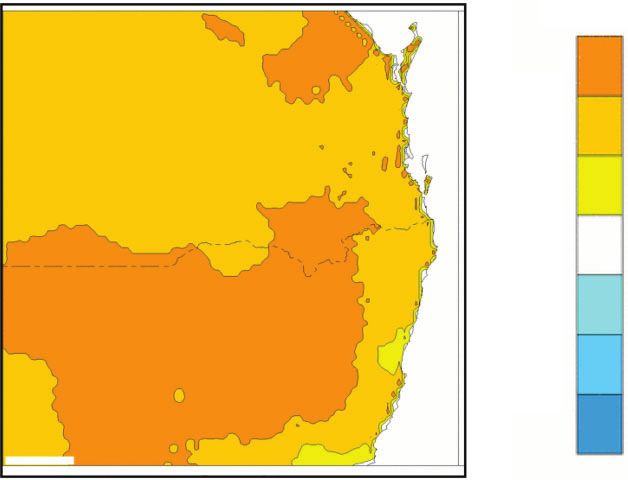
The changing role of operational meteorologists                                                                       Journal of Southern Hemisphere Earth Systems Science             E

                                                                                                                                    FFDI decile ranges

                                                                                                                                                   Highest on
                                                                                                                                                   record

                                                                                                                                                   Very much
                                                                                                                                    10
                                                                                                                                                   above average

                                                                                                                                   8–9             Above average

                                                                                                                                   4–7             Average

                                                                                                                                   2–3             Below average

                                                                                                                                     1             Very much
                                                                                                                                                   below average

                                                                                                                                                   Lowest on
                                                                                                                                                   record
                      http://www.bom.gov.au
                     © Commonwealth of Australia 2020, Australian Bureau of Meteorology   ID code: Analyser

                    Fig. 6. Deciles of the mean daily maximum Forest Fire Danger Index for September 2019, based on all years
                    since 1950.

guidance to support forecasts of Probability of Thunderstorms                                                 Optimised Forecast Process using a case study to demonstrate the
improves, the need for an intervention regarding thunderstorms                                                role meteorologists continue to play.
forecasts, such as that described in the case study above, will                                                  We have provided a snap-shot of a rapidly evolving profes-
reduce. There is work underway to allow the GFE to be used to edit                                            sion. The forecast process will continue to evolve as the Bureau
grids that cover the national domain. Working on a national scale                                             of Meteorology strives to provide a coherent, consistent and
will allow meteorologists to edit grids for weather events near                                               valuable weather forecast service that combines automation and
state borders without being constrained by those borders, increas-                                            professional judgement in a way that maintains the accuracy of its
ing the efficiency of grid editing.                                                                           forecasts and warnings.
    As forecast interventions become less frequent, meteorologists
will be able to use their time in other ways to continue to ensure                                            Conflicts of interests
the community receives impact and value from weather forecasts                                                The authors declare that they have no conflicts of interest.
and warnings. The Public Services Transformation is the vehicle
enabling and directing these changes. Some meteorologists will                                                Acknowledgements
design new products to allow improved communication of any                                                    The first author, Jenny Sturrock, would like to thank the organising
given weather forecastincluding the uncertaintyofthe forecast and                                             committee of the 2019 Bureau of Meteorology Research and Development
the range of possibilities. Others will assist to improve OCF, or its                                         Workshop for the invitation to present at the workshop. The content of that
successor, ensuring its continued improvement.                                                                presentation formed the basis of this paper. Thank you to Tamika Tihema
    The Bureau of Meteorology has assessed that it is still                                                   and Robert Fawcett for providing Fig. 6. Thank you to Stewart Allen, Simon
important that meteorologists direct their time towards examin-                                               Louis and Michael Foley for internal reviews of this manuscript prior to
                                                                                                              publishing. Thank you to the anonymous reviewers whose comments
ing the forecast and using their professional judgement when
                                                                                                              encouraged and assisted the revision of this manuscript. This research did
necessary. Although grid intervention is expected to decrease in                                              not receive any specific funding.
frequency, meteorologists will always need time to understand
the forecast if they are going to assist customers with key                                                   References
messages, or key points relevant to their specific business. As
                                                                                                              Bureau of Meteorology (BOM) (n.d.). National Standard Operating Proce-
the duties of operational meteorologists evolve it is essential that
                                                                                                                 dures for the Graphical Forecast Editor. Unpublished internal document.
this ‘traditional’ forecasting task is retained.                                                                 Bureau of Meteorology.
                                                                                                              Bureau of Meteorology (BOM) (2012a). Operations Bulletin Number 91:
5 Conclusion                                                                                                     Operational Upgrades to the Gridded OCF and PME systems. Available
We have described why the Bureau of Meteorology is changing                                                      at: http://www.bom.gov.au/australia/charts/bulletins/apob91.pdf [Veri-
the way forecasts are produced, from a labour intensive approach                                                 fied 16 May 2020].
to a more streamlined approach, relying on automation for many                                                Bureau of Meteorology (BOM) (2012b). Operations Bulletin Number 93:
tasks much of the time. We have described the essence of the                                                     APS1 upgrade of the ACCESS-G Numerical Weather Prediction system.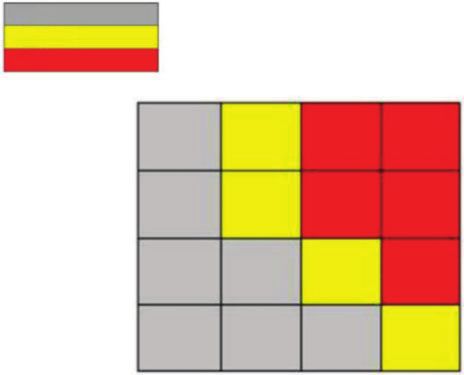
F     Journal of Southern Hemisphere Earth Systems Science                                                             J. Sturrock and D. Griffiths

   Available at: http://www.bom.gov.au/australia/charts/bulletins/apob93.   Bureau of Meteorology (BOM) (2019c). Monthly Weather Review Australia
   pdf [Verified 16 May 2020].                                                 September 2019. Available at: http://www.bom.gov.au/climate/mwr/
Bureau of Meteorology (BOM) (2014). Operations Bulletin Number 102             aus/mwr-aus-201909.pdf [Verified 18 May 2020].
   Upgrades to the Operational PME System. Available at: http://www.bom.    Bureau of Meteorology (BOM) (2019d). Monthly Weather Review
   gov.au/australia/charts/bulletins/apob102.pdf [Verified 16 May 2020].       Australia October 2019. Available at: http://www.bom.gov.au/climate/
Bureau of Meteorology (BOM) (2019a). Special Climate Statement 70              mwr/aus/mwr-aus-201910.pdf [Verified 17 May 2020].
   update – drought conditions in Australia and impact on water resources   Leeuwenburg, T. (2009). Introducing the Natural Language Generation of
   in the Murray–Darling Basin. Available at: http://www.bom.gov.au/           Text Weather Forecasts in the GFE. CAWCR Research Letters. Issue 2.
   climate/current/statements/scs70.pdf [Verified 17 May 2020].                (Eds P. A. Sandery, T. Leeuwenburg, G. Wang, A. J. Hollis) pp. 24–29.
Bureau of Meteorology (BOM) (2019b). Special Climate Statement 71 –            Available at: https://www.cawcr.gov.au/researchletters/CAWCR_Re-
   severe fire weather conditions in southeast Queensland and northeast        search_Letters_2.pdf [Verified 16 May 2020].
   New South Wales in September 2019. Available at: http://www.bom.
   gov.au/climate/current/statements/scs71.pdf [Verified 17 May 2020].

                                                          www.publish.csiro.au/journals/es
You can also read