Gas Transmission
Winter Review &
Consultation
June 2020
←
→
Page content transcription
If your browser does not render page correctly, please read the page content below
Gas Transmission Winter Review & Consultation June 2020
Contents

01     Welcome                       03

02     Key Messages                  04

03     Demand                        06

04     Supply                        10

05     System Operability            12

06     Consultation Summary          16

07     Glossary                      17

08     Appendix                      19

09     Continuing the conversation   20

                                          2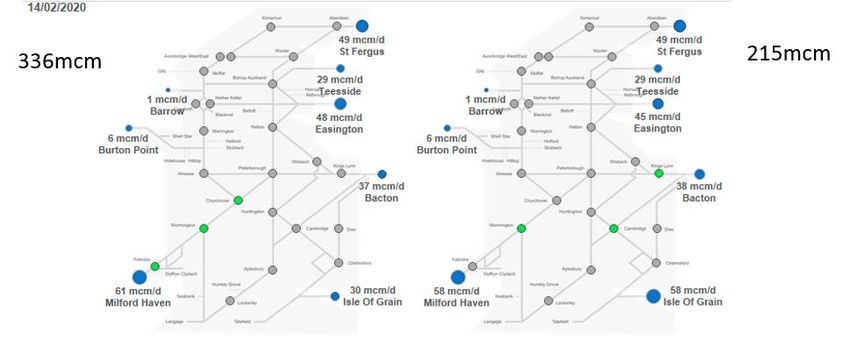
Welcome
to our 2020 Winter Review and Consultation
 Thank you for reading our Gas Winter Review and Consultation report. This report        Other Gas System Operations publications in this suite are:
 compares what happened in winter 2019/20 with our Winter Outlook Forecast. The
                                                                                         • Winter and Summer Outlook, both published annually, with the
 review and consultation is designed to help the energy industry to understand what
                                                                                           next due in October 2020 and March 2021 respectively.
 happened. It is an opportunity to look at factors that influenced differences between
 our forecast and actual events, together with how well challenges were both             • Gas Ten Year Statement (GTYS), published annually every
 anticipated and met.                                                                      November.
 Looking back, winter 2019/20 was a mild winter comparable to 2018/19 with the           • Gas Future Operability Planning (GFOP), published periodically
 National Transmission System reliably supplying gas to meet demand. In the Winter         when required.
 Outlook Forecast, we predicted that the global production of LNG would outstrip
 demand leading to high levels of LNG being supplied to GB shores. This pattern          I hope you find the Gas Winter review and Consultation and all the
 materialised and led to LNG supplies influencing the way we used our assets.            documents mentioned useful. Thank you again for reading the Gas Winter
 However, unlike our expectations in the Winter Outlook forecast, there was a            Review and Consultation report.
 reduction in the import of gas via the interconnectors, IUK and BBL. This was driven
 by a combination of low UK demand, high availability of supply, with subsequent
 market pricing making EU to UK transit less attractive compared to previous years.
 During the final eight days of the winter, the UK wide lockdown came into force as a
 consequence of the global COVID-19 pandemic, however this had little impact on the
 overall demand that was forecasted in the Winter Outlook Report. There was a
 reduction in overall demand when compared to the seasonal normal, but this was
 primarily due to falling embedded industrial demand and power station demand.
 An important part of our Gas Winter Review and Consultation is hearing from
 industry stakeholders and our customers. If you would like to engage with us then
 please send us your responses using the template provided. This can be emailed to
 .box.OperationalLiaison@nationalgrid.com. Alternatively, you can let us know what
 you think on Twitter and LinkedIn. The consultation closes on 24 July. We look
 forward to hearing your views.
                                                                                                                      Ian Radley
                                                                                                                      Head of Gas System Operations     3
Key Messages

1. Throughout winter 2019/20 we safely and efficiently operated the gas transmission network
   ensuring a reliability rate of 99.999598%.

2. Higher levels of LNG were supplied to the network when compared to the previous winter. With
   supply spread more evenly across the country and geographically closer to sources of demand,
   we have been able to reduce the amount of compression required through the winter.

3. In a typical winter, we would expect the interconnectors from Belgium and Holland to
   predominantly supply gas to the UK. This winter the large levels of supply from LNG, coupled
   with lower national demand, reversed this trend.

                                                                                           4
Executive Summary
Winter 2019/20 saw no significant events that                                            Winter 2018/19                     Winter 2019/20
                                                                                                  2018/19                                     2019/20
adversely affected gas supply and demand.                   Demand (BCM)
                                                                                      2018/19
                                                                                       Actual
                                                                                                  Weather        2019/20
                                                                                                                              2019/20
                                                                                                                               Actual
                                                                                                                                              Weather
                                                                                                 Corrected      Forecast                     Corrected
                                                                                      Demand                                  Demand
                                                                                                  Demand                                      Demand
LNG deliveries increased by approximately 70% on                  NDM                   28.7        30.0             30.6        30.7           30.9
                                                            DM + Industrial             4.4          4.5             4.7         4.5            4.5
the previous winter, despite relatively static demand           Ireland                 2.1          2.1             2.4         2.6            2.6
over the two winter periods                               Total for electricity
                                                                                        12.3          12.3           11.7        10.6            10.6
                                                              generation
                                                            Total demand                47.6          49.1           49.4        48.4            48.7
                                                              IUK export                0.0           0.0            0.8         0.5             0.5
This year saw an overall reduction in compressor           Storage injection            1.5           1.5            1.9         1.4             1.4
running hours compared to the previous winter and to           GB Total                 49.4          50.7           52.3        50.5            50.8

the Winter Outlook Forecast, but saw an increase in           Table 1 – Break down of Gas Demand – A version in TWh can be found in the appendix

the running hours of assets that we would not                                                  Winter Supply (BCM)
normally expect to run in the winter, again due to the                                                       2018/2019                  2019/2020

high deliveries of LNG                                                     UKCS                                 18.6                      18.3
                                                                          Norway                                18.6                      15.8
                                                                        BBL Import                                2                        0.2
Against the Winter Outlook forecast, there was a                        IUK Import                              0.3                        0.1
reduction in the import of gas via the interconnectors,                     LNG                                 7.8                       13.4
IUK and BBL, with both regularly switching their flow               Storage Withdrawal                          1.8                        2.4

direction to deliver gas to the continent                               Grand Total                             49.2                      50.3
                                                              Table 2 – Break down of Gas Supply - – A version in TWh can be found in the appendix

                                                                                                                                             5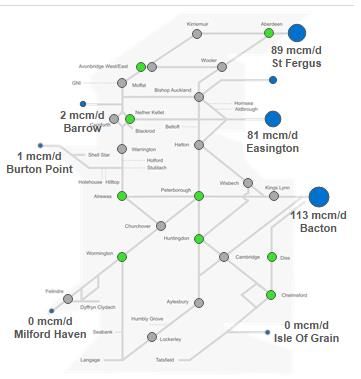
Non-Daily Metered Demand
                                                                  250
 Key messages: Demand from non-daily metered
 customers was broadly in line with our seasonal-normal           200

 forecast
                                                                  150

                                                          mcm/d
Throughout winter 2019/20 the Non-Daily Metered                   100

(NDM) demand followed the seasonal normal profile                 50

and there were no significant peaks or troughs as seen
                                                                   0
in Figure 1. The demand during January was slightly                1/10/19        1/11/19           1/12/19          1/1/20      1/2/20      1/3/20       1/4/20

lower than the seasonal norm due to the mild weather                                        NDM demand                NDM seasonal normal

that was seen over this period. Figure 2 shows that for                 Figure 1 – NDM demand during Winter 2019/20 in relation to seasonal normal

most of the winter period the actual CWV                          16

trended towards the warm average.                                 14
                                                                  12
                                                                  10

In the Winter Outlook report, the expected NDM                     8
                                                                   6
demand was 30.6 bcm and the actual NDM demand                      4

was 30.7 bcm. The highest overall demand day this                  2
                                                                   0
winter was 363 mcm on 21st January 2020 with the                   -2
LDZ demand on that day being 238 mcm.                              -4
                                                                    1/10/19      1/11/19        1/12/19              1/1/20      1/2/20      1/3/20       1/4/20

                                                                                           Normal             Cold        Warm       Actual CWV

                                                                                 Figure 2 – CWV for Winter 19/20 in relation to seasonal normal
                                                                                                                                                      6
Demand for Electricity Generation
Key messages: Demand for gas for electricity generation
has decreased compared to winter 18/19.
The overall gas demand for electricity generation was lower than
forecast in the Winter Outlook Report as well as being lower than
last winter's actual demand. 120
100
Supply from many competing non-fossil fuel sources of electricity
generation has increased this winter, with wind having the 80
largest impact. Electricity generation from nuclear, hydroelectric,
mcm/d
and wind increased this year compared to last year, with wind 60
generating 25% more. Due to the continued growth in renewable
40
generation capacity, gas demand for electricity generation was
again more volatile than the previous winter. 20
The rise in renewable electricity generation had also impacted 0
1/10/19 1/11/19 1/12/19 1/1/20 1/2/20 1/3/20 1/4/20
the gas daily demand for electricity generation throughout last
2018/2019 2019/2020
winter. The maximum and minimum daily demand both fell by 7
Figure 3 – Gas demand for power stations
and 8 mcm, respectively. There were also 20 days where daily
demand dropped below 30 mcm in winter 2019/20 comparing
this to only 2 days in winter 2018/19. Furthermore, there were 5
days where demand exceeded 80 mcm in winter 2019/20
compared to 19 days in winter 2018/19. 7EU Interconnectors
Key messages: Interconnector activity over the winter period was
low for both imports and exports.
This year was the first winter that BBL could export gas to the continent. 75
Export
Over the winter, there was a small amount of supply seen from both IUK 18/19 0
and BBL into the UK, a maximum of 25 mcm in late February. Such low
levels of imports from interconnectors, especially BBL, have not been -75
seen for a number of years. 1/10/18 1/11/18 1/12/18 1/1/19 1/2/19 1/3/19 1/4/19
Typically over the winter, the NTS would expect to see imports from the Figure 4 – EU daily interconnector important and export Winter 18/19
EU interconnectors, however as shown in Figure 5, during Winter 19/20
the interconnectors were operating in export mode for much of the winter.
75
Lower than normal flows through the interconnectors was a consequence Export
of relatively mild winters in both the UK and Europe, coupled with high
supply availability in the UK and relatively high continental storage stocks. 19/20 0
This provided minimal market incentive for large flows between the UK
and Europe.
-75
1/10/19 1/11/19 1/12/19 1/1/20 1/2/20 1/3/20 1/4/20
This did not negatively impact on the operability of the network with any
potential shortfall being picked up by an increase in LNG. The supply from
Figure 5 – EU daily interconnector important and export Winter 19/20
the Isle of Grain, in particular, aided operability due to its proximity to the
high demand areas of Greater London. This reduced the amount of
compression typically required in winter to transmit gas into the south east
of the country. 8Storage
800
Key messages: Similar behavior of storage facilities in 2019/2020 winter to
that of 2018/19 winter.
600
mcm/d
As forecast in the Winter Outlook Report, high supply availability from LNG Storage 400
Injection
depressed the required withdrawal from MRS. This remained true for the
majority of the winter. 200
In February, inclement weather conditions at the LNG reception terminals 0
delayed the offloading of a number of cargos, which in turn reduced supply Oct Nov Dec Jan Feb Mar
into the NTS. During this period, MRS responded accordingly to pick up the 18/19 19/20
shortfall. This behavior was expected with UKCS and Norwegian gas forming Figure 7 – Monthly storage injection
the base level of supply, with responsive balancing traditionally provided by
LNG, MRS and Interconnectors.
100%
90%
80% 800
70%
60% 600
50%
mcm/d
Storage 400
40% Withdraw al
30%
200
20%
10%
0
0% Oct Nov Dec Jan Feb Mar
1/10/19 1/11/19 1/12/19 1/1/20 1/2/20 1/3/20 1/4/20
18/19 19/20
2018/2019 2019/2020
Figure 6 – Gas in medium-range storage Figure 8 – Monthly storage withdrawal 9Liquefied Natural Gas
Key messages: There was a high supply of gas from all LNG 13391
terminals in this winter compared to winter 2018/19.
There had been higher LNG flows in winter 2019/20 compared to winter 2018/19
across all terminals as predicted in our Winter Outlook Report. 7815
mcm
5955
Looking at Figure 10, it can be seen that this winter there were much larger peaks in 4811
LNG flows compared to winter 2018/19. Two days stand out, the first in early
2625 2889 2884
December and the second in late January. These two days show that supply from 2042
LNG terminals reached a maximum of almost 140 mcm, compared with only 80-90
mcm last year.
18/19 19/20 18/19 19/20 18/19 19/20 18/19 19/20
Due to this rise in supply of LNG, the Isle of Grain terminal exported its highest ever Total LNG Dragon South Hook Isle of Grain
daily amount of gas into the UK’s network this winter.
Figure 9 – Total LNG flows by terminal for entire Winter period
160
140
120
100
mcm/d
80
60
40
20
0
1/10/19 1/11/19 1/12/19 1/1/20 1/2/20 1/3/20 1/4/20
18/19 19/20
Figure 10 – Total LNG flows by day
10Gas Supply/Demand Profiles
Key messages: There were sufficient supplies from a variety of
sources to meet the winter 19/20 demand.
The supply and demand profiles showed a similar level of
variability compared to last winter’s profile; this can be seen in
Figure 11. The main difference between the two winters is
related to the LNG supply, supplies from Norway and the
interconnectors. LNG supply was significantly higher in winter
2019/20 compared to winter 2018/19; the average supply
profile for LNG from winter 2018/19 is now at the lower end of
the supply profile from winter 2019/20. Furthermore, the
supply coming from Norway and the interconnectors has
reduced significantly from the winter previous.
Supplies from UKCS and Norway remained strong as
expected but were slightly reduced. Norway and UKCS
supplies had decreased on average by 15% and 1.6%
respectively and LNG supplies had risen by 71%. Both
storage and LNG supply was highly market-driven as
expected, the highest LNG flow was 138 mcm on 15th
December. Supplies from interconnectors also saw a
Figure 11 – Proportion of daily NTS Demand/Supply
reduction this winter.
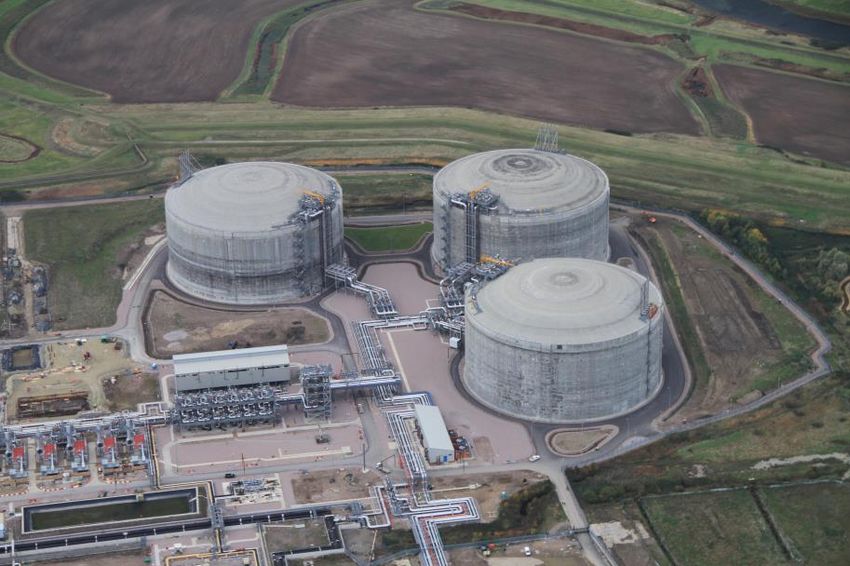
11System Operability – Winter by Winter
Key messages: Historic supply flows from the north and east of the country have once again been supplanted by high volumes of
LNG
The nature of the supply make up into the UK forms the basis of the way we operate the network, in particular with respect to compression. This is shown by
considering the two different scenarios below. The image on the left has a geographically balanced supply as well as a demand of 336 mcm. There is much less
compression being used in this scenario compared to the image to the right which has a lower demand but a more localised supply. These two networks show that
the NTS must be able to accommodate a multitude of different configurations and flow patterns.
336 mcm 293 mcm
Figure 12– Supply between winter 2017/18 and winter 2019/20.
Figure 12 gives a simplified view of the NTS. Each blue circle represents a terminal and its flowrate, each green circle represents an online 12
compressor station and the blue arrows represent the direction of the flow within the system.System Operability – Within Day
Key messages: Market responsiveness from our customers continues to drive the need for greater flexibility in the way we operate
the network
The changing nature of our customers’ requirements for the network are not just apparent across seasons but are increasingly observed within the gas day, where
supplies to and demands from the network can change dramatically at relatively short notice. Figure 13 shows an example of this where a large increase in the
supply flows in at the Isle of Grain resulted in changes at four compressor stations; significantly altering the way gas was flowing across the south of the network. We
expect such increased need for network flexibility to continue into RIIO2.
14:00 01:00
Figure 13 – Supply profiles at 14:00 and 01:00 on Gas Day 14th February 2020
Figure 13 gives a simplified view of the NTS. Each blue circle represents a terminal and its flowrate, each green circle represents an online 13
compressor station and the blue arrows represent the direction of the flow within the system.Linepack and Compressor Running Hours
25,000
Key messages: Total compressor running hours have decreased
20,888
but variety of compressor configuration has increased
20,000
Throughout the years there has been steady increase in linepack swing as seen in
Figure 15. Linepack swing is the difference between the volume of gas in the NTS 15,000 14,155
Hours
at the start of the gas day, compared to its lowest point.
10,000
On average this winter there was a more balanced supply throughout the NTS.
This meant that the sources of supply tended to be geographically closer to
demand centres, reducing the amount of compressor assets required to be online. 5,000
However, there has been more non-standard compressor usage, to accommodate
0
the high volumes of gas entering the network from locations such as LNG 2018/2019 2019/2020
terminals. This increase in LNG has meant there was less of a requirement to run Figure 14 – Compressor running hours between winter 18/19 and winter 19/20
standard compression to push gas from the North to the South of the network.
45
39 39
40
35 33
30 29 30 31
30 28 28
26
25 22 21
19 19 19 20 19 17
20 18 17 15 15 15
14 14
11 11 12
15 9 10
7 7 7 7 8
10 4 5 5
5
0
Max. Swing Avg. Swing
Figure 15 – Linepack swing
14Consultation Questions
The consultation section is a vital element of the stakeholder engagement that feeds into our 2020/21 Winter Outlook
Report.
Your views on the market and related issue are important to provide a comprehensive picture of the challenges and
opportunities that lie ahead next winter. It also allows us to test how useful the suite of our publications are and to identify
potential improvements.
Please send us your responses using the template provided. This can be emailed to
.box.OperationalLiaison@nationalgrid.com. Alternatively, you can let us know what you think on Twitter and LinkedIn.
1. What do you use the Winter Review and Consultation document for?
2. What information in the report is the most useful to you for this?
3. Is there anything else that could be included in the Winter Review and Consultation?
4. How do you think the Winter Review and Consultation could be improved to increase benefit for consumers?
5. Is there anything that could impact European supply or demand that may affect interconnector flows to and from GB
over winter 2020/21?
6. Do you have any other comments in relation to gas demand and supply ahead of winter 2020/21?
7. Do you have any other feedback on the format of this report and the 2019/20 Summer Outlook Report?
8. Is there anything different you would like to see in the 2020/21 Winter Outlook Report which will be published in
October?
9. Are there any factors that may impact trends in LNG production, supply or prices in winter 2020/21?
The consultation closes on 24th July 2020. We look forward to hearing your views. 15Glossary
Term Description
BCM Billions of cubic metres.
BBL A bi-directional gas pipeline running from Balgzand in the Netherlands to Bacton in the UK.
Compressors are used to move gas around the transmission network through high pressure pipelines. There are currently 71
Compressor compressors at 24 sites across the country. These compressors move the gas from entry points to exit points on the gas network.
They are predominately gas driven turbines that are in the process of being replaced with electric units.
Combined Cycle Gas A combined-cycle power plant uses both a gas and a steam turbine together to produce up to 50 percent more electricity from the
Turbine (CCGT) same fuel than a traditional simple-cycle plant.
Composite Weather The Composite Weather Variable (CWV) is a single measure of daily weather in each LDZ and is a function of actual temperature,
Variable (CWV) wind speed, effective temperature and seasonal normal effective temperature
Daily metered (DM)
A classification of customers where gas meters are read daily. These are typically large-scale consumers.
demand
Injection Gas for storage injection This is gas which is put (‘injected’) into a gas storage facility.
IUK Interconnector/ IUK The Interconnector (UK) Limited is a bi-directional gas pipeline connecting Bacton in the UK and Zeebrugge in Belgium.
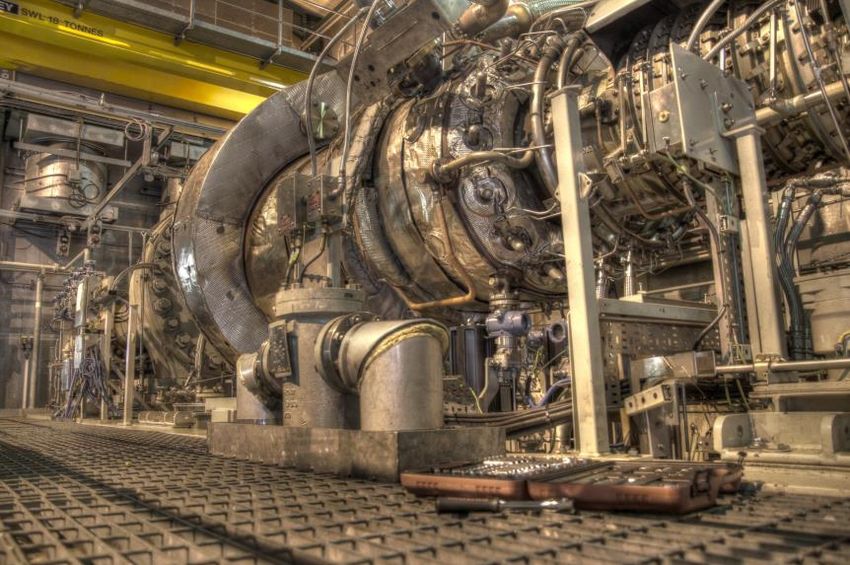
Liquefied natural gas Natural gas that has been converted to liquid form for ease of storage or transport. It is formed by chilling gas to -161°C so that it
(LNG) occupies 600 times less space than in its gaseous form
Medium-range storage Gas storage facilities designed to switch rapidly between injection and withdrawal to maximise the value from changes in gas
(MRS) price.
The interconnector pipeline that connects the British system at Moffat, in Scotland to the Republic of Ireland, Northern Ireland and
Moffat interconnector
the Isle of Man. Physical gas flows are currently only possible in the direction of exit from GB
National transmission A high pressure gas transportation system consisting of compressor stations, pipelines, multijunction sites and offtakes. Pipelines
system (NTS) transport gas from terminals to offtakes. The system is designed to operate at pressures up to 94 barg.
Non-daily metered A classification of customers where gas meters are read monthly or at longer intervals. These are typically residential, commercial
(NDM) demand or smaller industrial consumers.
16Glossary
Term Description
NTS shrinkage: NTS shrinkage is made up of 3 components.
Unaccounted for gas (UAG) is unallocated gas or gas that is lost or stolen from the system. Own use gas (OUG), is gas that is
NTS shrinkage
used in the running of the system e.g. compressor fuel, and calorific value shrinkage (CVS) where gas of a particularly low or high
CV enters the distribution network which differs with the flow weighted average CV entering that network.
Renewables Forms of energy generation from renewable resources, which are naturally replenished, such as sunlight, wind
A set of conditions representing the average weather that we could reasonably expect to occur. We use industry-agreed seasonal
Seasonal normal
normal weather conditions. These reflect recent changes in climate conditions, rather than being a simple average of historic
conditions
weather.
Seasonal normal The level of gas demand that would be expected on each day of the year. It is calculated using historically observed values that
demand (SND) have been weighted to account for climate change.
Transit gas Gas that enters and exits the national transmission system without being consumed in GB and Ireland.
UK Continental Shelf UKCS is made up of the areas of the sea bed and subsoil beyond the territorial sea over which the UK exercises sovereign rights
(UKCS) of exploration and exploitation of natural resources.
The demand expected with the impact of weather removed. Actual demand is converted to demand at seasonally normal weather
Weather corrected
conditions, by multiplying the difference between actual CWV and expected CWV by a value that represents demand sensitivity to
(demand)
weather.
Withdrawal Gas for storage withdrawal This is gas which is taken from (‘withdrawn’) from a gas storage facility.
17Appendix – Data Tables in TWh
Winter 2018/19 Winter 2019/20
2018/19 2019/20
A good guide for converting to energy in watt hours
2018/19 2019/20
Demand (TWh) Actual
Weather 2019/20
Actual
Weather from gas volume in cubic metres is to multiply by 11.
Corrected Forecast Corrected
Demand Demand
Demand Demand
NDM 315.8 330.2 336.4 337.7 340.3 So, for example, 4 mcm approximates to 44 GWh, and
DM + Industrial 48.9 49.4 52.2 49.3 49.5
Ireland 23.1 23.1 26.0 29.0 29.0
80 bcm approximates to 880 TWh.
Total for electricity
135.6 135.6 128.7 116.8 116.9
generation Note: 1 TWh = 1000 GWh, and 1 bcm = 1000 mcm
Total demand 523.4 540.3 543.3 532.7 535.6
IUK export 0.4 0.4 8.3 5.1 5.1
Storage injection 16.9 16.9 20.7 15.0 15.0
GB Total 543.8 557.5 575.2 555.9 558.9
Table A – Breakdown of Gas Demand
Winter Supply (TWh)
2018/2019 2019/2020
UKCS 204.6 201.3
Norway 204.6 173.8
BBL Import 22 2.2
IUK Import 3.3 1.1
LNG 85.8 147.4
Storage Withdrawal 19.8 26.4
Grand Total 541.2 553.3
Table B – Breakdown of Gas Supply
18Continuing the conversation
Email us with your views on the Gas Winter Review and
Consultation at:
.Box.OperationalLiaison@nationalgrid.com
National Grid plc
National Grid House,
Warwick Technology Park,
Gallows Hill, Warwick.
CV34 6DA United Kingdom
Registered in England and Wales
No. 4031152
www.nationalgrid.com
19Legal Notice
National Grid has prepared this document in good faith, and has endeavoured to prepare this document in a manner
which is, as far as reasonably possible, objective, using information collected and compiled by National Grid from users of
the National Transmission System, together with its own forecasts of the future development of those systems.
While National Grid has not sought to mislead any person as to the contents of this document and whilst such content
represents National Grid’s best views as at the time of publication, readers of this document should not place any reliance
on the contents of this document.
The contents of this document must be considered as illustrative only and no warranty can be or is made as to the
accuracy and completeness of such contents, nor shall anything within this document constitute an offer capable of
acceptance or form the basis of any contract.
Other than in the event of fraudulent misstatement or fraudulent misrepresentation, National Grid does not accept any
responsibility for any use which is made of the information contained within this document.
Copyright
Any and all copyright and all other intellectual property rights contained in this outlook document belong to National Grid. To the extent that you re-use the outlook document, in its
original form and without making any modifications or adaptations thereto, you
must reproduce, clearly and prominently, the following copyright statement in your own documentation:
© National Grid plc, all rights reserved.
2021
You can also read