Impact of the upper tropospheric cooling trend over Central Asia on the Indian summer monsoon rainfall and the Bay of Bengal cyclone tracks ...
←
→
Page content transcription
If your browser does not render page correctly, please read the page content below
Uncorrected Proof

                                                                                                          RESEARCH ARTICLES

Impact of the upper tropospheric cooling trend
over Central Asia on the Indian summer
monsoon rainfall and the Bay of Bengal
cyclone tracks
P. V. Joseph1,*, G. Bindu1 and B. Preethi2
1
    Nansen Environmental Research Centre India, 6A Oxford Business Centre, Sreekandath Road, Kochi 682 016, India
2
    Indian Institute of Tropical Meteorology, Dr Homi J. Bhabha Road, Pune 411 008, India

                                                                          lions. In more recent times during the drought monsoon
The Indian summer monsoon rainfall had a three-
decade long alternate dry and wet epochs during                           of 1972, arrangements had to be made by the Indian Gov-
about 150 years from 1840 to 1989. The dry epochs re-                     ernment to import 2 million metric tonnes of food grains.
sulted in frequent drought monsoons affecting agricul-                       During the dry epoch 1960–89, there were 10 monsoon
ture, power generation and the overall economy of the                     drought years (1965, 1966, 1968, 1972, 1974, 1979,
country. A high percentage of severe cyclones in the                      1982, 1985, 1986 and 1987). The just earlier wet epoch
Bay of Bengal moved northwards during the dry ep-                         1930–59 had only two drought monsoons (1941 and
ochs causing disasters in Bangladesh, Myanmar and                         1951). Such three-decade long epochs of alternating dry
the Indian States of Odisha and West Bengal. These                        and wet monsoons have been observed since the 1840s,
dry epochs have been shown to be associated with the                      when India began to take rainfall measurements. If this
cold phase of the Atlantic multidecadal oscillation in                    natural cyclicity of period about 60 years which is
sea surface temperature. Using the available tropo-
                                                                          found linked to the global sea surface temperature (SST)
spheric temperature (re-analysis) data since 1948, the
recent dry epoch during 1960–89 which had 10 mon-                         anomalies, particularly the well-known Atlantic multi-
soon drought years was found to have cold upper tro-                      decadal oscillation (AMO) continues, India may have to
pospheric temperature anomaly over Central Asia.                          face yet another epoch of frequent monsoon droughts
This cold anomaly region has also experienced a long-                     during 2020–49. Indications are that due to the observed
term cooling trend. Extrapolating the naturally occur-                    cooling trend of the upper tropospheric temperature over
ring epochal nature of the ocean–atmosphere system                        continental Asia, the frequency and severity of droughts
into the future, we fear that the epoch 2020–49 is like-                  expected during 2020–49 is likely to be higher than that
ly to be another dry one, and the cooling trend over                      of the recent dry epoch 1960–89. The atmospheric circu-
the Asian continent is likely to make it even more se-                    lation (winds) over South Asia is also found to have
vere in its impact than 1960–89. This article presents                    parallel multidecadal oscillation which has influenced the
details of an ocean–atmosphere instability that gener-
                                                                          tracks of the cyclones of the Bay of Bengal (BoB),
ates frequent drought monsoons during dry epochs
and which needs urgent research.                                          making resulting in higher proportion of north-moving
                                                                          cyclones during dry epochs. In the BoB, north-moving
                                                                          cyclones have longer lifetime over the sea and therefore
Keywords: Cooling trend, cyclone tracks, summer                           are able to reach higher intensities than west-moving cy-
monsoon, upper troposphere.                                               clones. In view of the shallow bathymetry of the coastal
                                                                          areas of north BoB, north-moving cyclones have the
THE recent severe Indian monsoon droughts of 1982,                        potential to create very high storm surges and the conse-
1987, 2002 and 2009 had an adverse impact on agricul-                     quent heavy loss of life and property.
ture, energy generation and the overall economy of the
country. However, these droughts did not create famine
conditions, as the Government had taken action to have                    Dry and wet epochs in Indian summer monsoon
enough stock of food grains for public distribution. This                 rainfall
was not the case for drought monsoons of earlier years1.
Following the drought monsoon of 1899, the famine was                     According to India Meteorological Department (IMD), if
widespread and severe. It was not merely a food famine,                   the Indian summer monsoon rainfall (ISMR) during the
but also one of fodder and water. Cattle died by the mil-                 four monsoon months of June to September is deficient
                                                                          by 10% (about one standard deviation) of its long-term
*For correspondence. (e-mail: joporathur@gmail.com)                       average, it is declared as a drought monsoon. Using data

CURRENT SCIENCE, VOL. 110, 2016                                                                                                    1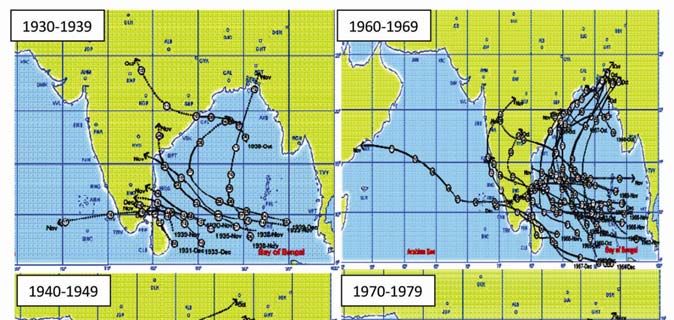
Uncorrected Proof

RESEARCH ARTICLES
from a network of 306 climatological raingauge stations                  to reproduce the general characters of the observed link-
well distributed over India, scientists at the Indian Insti-             age between AMO and ISMR; a positive AMO favours
tute of Tropical Meteorology (IITM), Pune have derived                   more rainfall over India from July to October. A recent
an ISMR series for the period 1871 to the current year                   study has shown that ISMR on the decadal scale is better
using the method developed by Parthasarathy and                          related to the global SST gradient between the tropics and
Mooley2. This series is updated every year and provided                  the northern hemisphere mid-latitude oceans than to the
in the IITM (www.tropmet.res.in). A prominent decadal                    AMO9.
variability in ISMR, first reported3 in the 1970s (Figure
1 a), gives the anomaly in units of its standard deviation
                                                                         Decadal change in wind/temperature and cyclone
for each year from 1871 to 2010. During the three-decade
                                                                         tracks
long dry epochs 1900–29 and 1960–89, India had mon-
soon droughts on average once in three years. In contrast,
                                                                         Using NCEP/NCAR reanalysis data10 available from the
during the wet epochs 1870–99 and 1930–59, the
                                                                         year 1948, it was shown by Joseph11 that during 1965–87
frequency of droughts had been once in 10–20 years only.
                                                                         (part of the dry epoch which produced 10 droughts in
Using the available network with a smaller number of
                                                                         ISMR), the upper tropospheric westerlies intruded equa-
raingauge stations4, it was found that 1840–69 was a dry
                                                                         torwards during the monsoon season as a wave number-3
epoch. Thus, during the 150 years from 1840 to 1989,
                                                                         trough over Asia (see Figure 11 of Joseph11) when com-
there were regular 30-year epochs alternating between
                                                                         pared to 1950–59, a decade of the wet epoch 1930–59.
dry and wet. In dry (wet) epochs, the decadal mean ISMR
                                                                         Figure 2 a and b shows the 200 hPa wind anomaly and
is lower (higher) than the long-term mean5.
                                                                         300 hPa temperature anomaly of the decade 1970–79
   Parallel epochal changes are seen in an index derived
                                                                         compared to the decade 1950–59 for the monsoon season.
from the SST of the Atlantic Ocean, i.e. AMO Figure 1 b
                                                                         The equatorward intrusion of westerlies over Asia is con-
(ref. 6). During the dry (wet) epochs of ISMR, AMO is
                                                                         sistent with the cold temperature anomaly at 300 hPa
negative (positive). Goswami et al.7 have given a hy-
                                                                         over the Asian continent according to thermal wind
pothesis regarding the link between AMO and ISMR. A
multi-century simulation8 using a fully coupled atmos-
phere–ocean–sea ice general circulation model was able

Figure 1. (Top) Standardized anomaly of Indian summer monsoon
rainfall of 1871–2010 with drought monsoons marked by red bars.
(Bottom) Atlantic multi-decadal oscillation in sea surface temperature   Figure 2. June to September anomaly (1970–79) minus (1950–59) of
(SST) of 1860–2000 taken from Enfield et al.6.                           200 hPa wind (m/s; top) and 300 hPa temperature (°C; bottom).

2                                                                                                    CURRENT SCIENCE, VOL. 110, 2016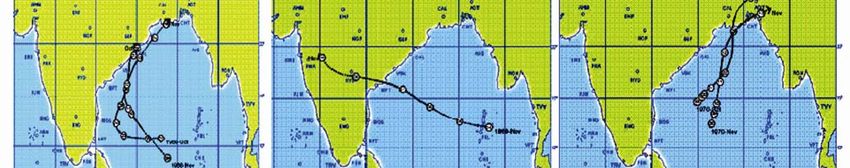
Uncorrected Proof
RESEARCH ARTICLES
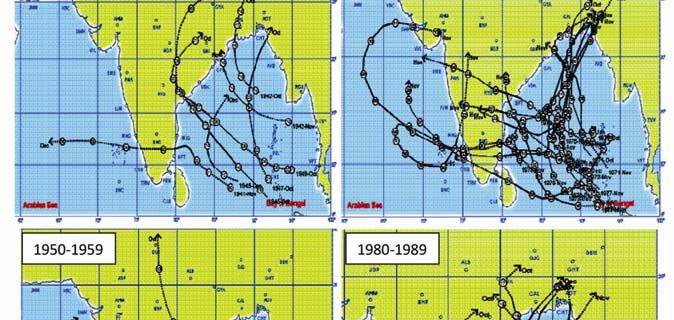
Figure 3. a, October–December tracks of severe cyclones in the Bay of Bengal (BoB) during
each decade of the wet epochs 1930–1959 (left panel) and dry epochs 1960–89 (right panel).
b, Ten-year moving average of cyclone motion index for the period 1925–2013. In the October–
December season, if all the severe cyclones in the BoB move west (east), the index for that year
is –1 (+1), and for all other years it is zero.
CURRENT SCIENCE, VOL. 110, 2016 3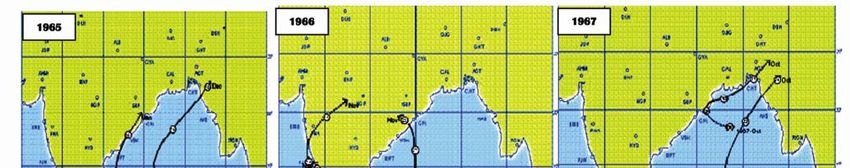
Uncorrected Proof
RESEARCH ARTICLES
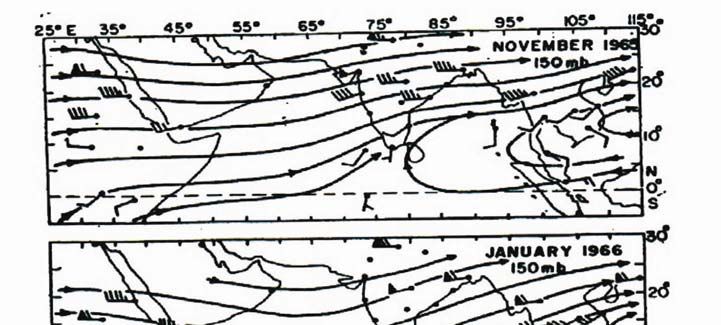
Figure 4. a, Monthly station mean wind at 150 hPa and streamlines taken from Joseph17 show-
ing the change from a westerly regime in November 1965 to an easterly regime in November
1966 over BoB. b, Twelve-month moving average of the mean HadISST of north Indian Ocean
between lat. 5–20 N and long 60–90 E.
4 CURRENT SCIENCE, VOL. 110, 2016
Uncorrected Proof

                                                                                                RESEARCH ARTICLES
considerations. Similar equatorward intrusion of upper         Inter-annual variability of Indian summer
tropospheric westerlies in the following October–              monsoon rainfall and cyclone tracks
December season is the main cause for the large percent-
age of northward-moving Bay cyclones of that season in         Some studies (and references therein)9,11 have shown that
a dry epoch. Figure 3 a shows the tracks of severe cy-         during the dry epoch when upper tropospheric westerlies
clones (defined by IMD as a tropical cyclonic system           were more equatorward over South Asia, wave number 6
with maximum sustained surface wind speed of 48 knots          stationary Rossby wave trains were superposed on these
or more – one knot is 0.51 m/s) of the BoB during Octo-        westerlies, with opposite spatial phases for the wave dur-
ber–December, taken from the e-atlas of IMD (which             ing monsoon seasons with deficit (drought) and excess
gives cyclone tracks and other related information from        rainfall. This wave was named Asia-Pacific wave (APW)
1891 to the current year; www.rmcchennaieatlas.tn.nic.in)      by Joseph and Srinivasan12, who hypothesized that the
for each decade of the wet epoch 1930–59 and dry epoch         spatial phase of the wave depended on the location of the
1960–89. In the three dry decades, a high percentage of        convective heating anomalies, which in turn depended on
the cyclones had northward tracks, and Bangladesh,             the location of warm SST anomalies. Figure 5 a and b
Myanmar and the Indian states of Odisha and West Ben-          provides the composites of 200 hPa meridional wind
gal experienced many cyclone-related disasters. The cy-        anomalies showing the APW of the five driest and five
clone of November 1970, which had landfall over                wettest years of the dry epoch 1960–89. This wave was
Bangladesh and claimed 300,000 lives, is one among             also found modulating the spatial distribution of total at-
them. In the three decades of the wet epoch 1930–59, Bay       mospheric ozone13. During monsoon seasons of drought
cyclones had mostly westward tracks.                           years such a wave trough intrudes into northwest India,
   To quantify the change in severe cyclone tracks, the        which is one of the causes for monsoon drought14,15; the
following method is used. Most of the cyclones of the          very next wave trough to its east (close to Japanese
BoB during October–December season have genesis                islands) is found to steer a large percentage of the
south of lat 15°N. If such a severe cyclone has landfall       typhoons of the Pacific Ocean northwards during drought
south of lat 17°N (on the coast this point is close to         monsoon seasons16. There is an interesting negative feed-
Vishakapatnam), it is taken as a west-moving cyclone. If       back process hypothesized9,11 to occur in a dry epoch,
landfall is north of 17°N, it is taken as north-moving         which was proposed in the 1980s (refs 17–19). One or
cyclone. Most of the October–December seasons have             two consecutive drought monsoons are followed by warm
cyclones moving either west (represented by –1) or north       SST anomaly in the tropical Indian Ocean which persists
(represented by +1). If in the season there are no             till the following monsoon, resulting in normal or excess
cyclones, or if there are both west and north-moving cy-       rainfall. The excess rainfall cools the Indian Ocean SST
clones, that season is represented by 0. A few severe cy-      and brings back the atmospheric circulation conditions
clones had their genesis north of lat 15°N. If their
movement is westwards it is taken as west-moving and if
northwards as north-moving, but such cases have been
very few. Figure 4 provides examples of the above-
mentioned cases of cyclone movement. Years 1969 and
1972 are each represented by –1, while years 1965, 1968,
1970, 1971 and 1973 each by +1. Year 1967 has one west
moving and one north-moving cyclone, both originating
south of lat 15°N and so the index for the year is 0. In the
same year, there is an example of a cyclone having its
genesis north of 15°N, and it is taken as a north moving
cyclone. Figure 3 b gives the ten-year moving average of
this series. During the wet epoch 1930–59, the ten-year
moving average of this index is mostly negative showing
that cyclone movement is predominantly westwards and
during the dry epoch 1960–89 cyclone movement is
northwards. Cyclone movement during the decade 1990–
99 is westwards and 2000 onwards is northwards. Since
the BoB is a small ocean basin with land to the west,
north and east, and is criss-crossed by merchant ships
recording meteorological observations, we have reliable
records in the e-atlas of the tracks of all the cyclones       Figure 5. a, June–September meridional wind anomaly composite of
since 1925 whose data have been used. Satellite data have      (a) drought years 1965, 1972,1979, 1982 and 1987, and (b) excess rain
been used to track cyclones only from 1965.                    years 1961,1970,1975,1983 and 1988.

CURRENT SCIENCE, VOL. 110, 2016                                                                                                   5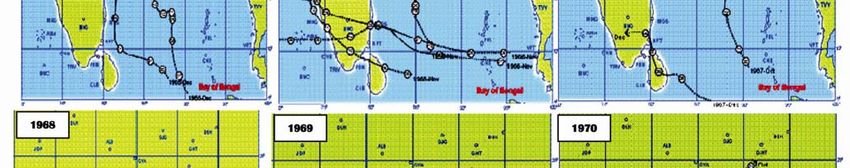
Uncorrected Proof

RESEARCH ARTICLES

                 Figure 6.   Tracks of October–December severe cyclones in the BoB during each year from 1965 to 1973.

for causing another drought monsoon. This negative                   ing of the atmosphere. Thus, there in an association with
feedback process between monsoon and ocean, and the                  the warm SST anomaly (see Figure 4 a taken from
excitation of the APW are hypothesized to be the cause               Joseph17). The upper tropospheric easterlies associated
for the occurrence of frequent drought monsoons during a             with that anticyclone steered the Bay cyclones of Octo-
dry epoch. A slightly different hypothesis was framed for            ber–December 1966 season westwards. Similar westward
the phenomenon known as tropospheric biennial oscilla-               motion of the Bay cyclones of October–December season
tion20, a critique of which may be found in Joseph et al.9.          may be seen in 1969 and 1972, associated with similar
   In the study by Joseph17, the warm SST anomaly in the             warm SST anomalies in the north Indian Ocean and Bay
Indian ocean following the two consecutive drought mon-              upper tropospheric anticyclone and easterly winds. In the
soons of 1965 and 1966 was found to cause an anticy-                 remaining years of the period 1965–73, Bay cyclones of
clone to form in the upper troposphere of north Indian               October–December moved northwards (Figure 6). Thus
Ocean, presumably due to the increased convective heat-              during a dry epoch there are both west- and north-moving
6                                                                                                   CURRENT SCIENCE, VOL. 110, 2016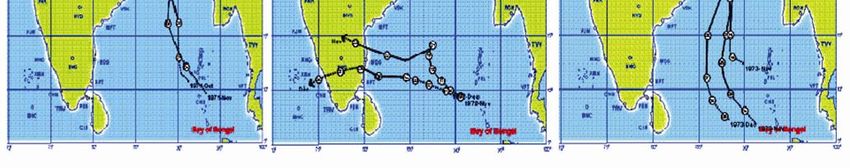
Uncorrected Proof

                                                                                                  RESEARCH ARTICLES

             Figure 7. Schematic diagram showing the ocean–atmosphere instability that produces frequent drought mon-
             soons when upper tropospheric westerly winds move equatorwards over South Asia.

cyclones, but in a wet epoch most of the cyclones move            phenomenon requires focused research efforts, including
westwards only. Figure 4 b provides the 12 month                  modelling studies by the global scientific community.
moving average SST of a representative area of the north
Indian Ocean (5–20°N, 60–90°E) for the period 1960–74.
Westward motion of the Bay cyclones occurred when the             Climate change in upper tropospheric
SST (HadISST) of the north Indian Ocean reached                   temperature
maxima in a cycle of period three years. Thus, during the
dry epochs there is large interannual variability in ISMR,        Abish et al.22 studied the change in the upper tropo-
the upper tropospheric winds over the north Indian Ocean          spheric temperature (at 300 hPa) during the recent six
and in Bay cyclone tracks of the October–December sea-            decades and which found large climate change in tem-
son. The SST variation in the north Indian Ocean of               perature in the mid-latitude belt between 30° and 60° in
1960–74 is similar (and with temporal phase different             both the northern and southern hemispheres (see Figures
only by a few months) to the SST variation in a three-            1 e and 3 e of Abish et al.22. Figure 8 a shows the change
year cycle in the El Nino warm anomaly area of the equa-          in temperature for the monsoon season, decades 2000–09
torial Pacific Ocean (Figures 5 and 13 of Pan and Oart21),        minus 1950–59. While over Asia there cold anomaly in
which shows the involvement of El Nino in the inter-              the same area as seen in Figure 2 (bottom), the rest of the
annual changes to the atmospheric circulation over South          world had warm anomalies in the mid-latitude belt
Asia and north Indian ocean. Thus, the interannual vari-          between 30° and 60° lat. A strong upper tropospheric
ability observed during a dry epoch is a planetary-scale          cooling trend was found in East Asia during July and
ocean–atmosphere instability (negative feedback)                  August around 300 hPa (ref. 23). Accompanying this
phenomenon occurring when the upper tropospheric                  summer cooling the upper level westerly jetstream over
winds move to lower latitudes over Asia, allowing the             East Asia was found to shift southwards. Figure 8 b gives
monsoon heat sources to better interact with the wester-          the temperature of the atmosphere at 300 hPa averaged
lies and produce APW. Figure 7 provides the details of            for the monsoon season over a box bounded by lat 40 and
this ocean–atmosphere instability phenomenon that pro-            60°N and long 70 and 140°E (the core region of the cold
duces frequent drought monsoons in a dry epoch. This              anomaly) for each year of the period 1950–2011.

CURRENT SCIENCE, VOL. 110, 2016                                                                                            7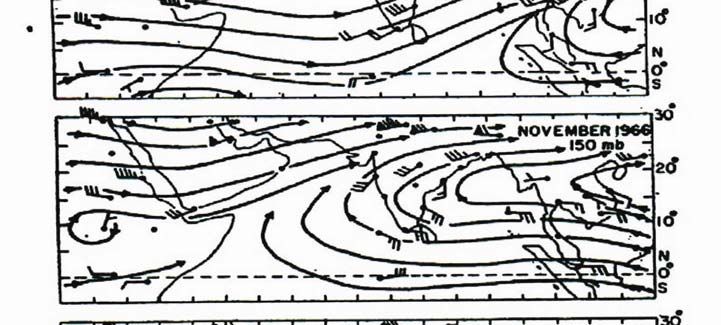
Uncorrected Proof

RESEARCH ARTICLES

Figure 8. a, Mean June–September temperature (°C) anomaly, (2000–09) minus (1950–59) at 300 hPa. b, Bars showing June–September mean
temperature of each year averaged over the box 40–60 N; 70–140 E. Red line shows five-year moving average blue line shows the linear trend.
c, June–September mean geopotential height of 500 hPa surface of Delhi, India. Red line shows five-year moving average and blue line shows the
linear trend. d, Indian summer monsoon rainfall (ISMR) of June–September of 1950 to 2011. Red line shows five-year moving average and blue
line shows the linear trend.

The five-year moving average shows the coldness (de-                     Extrapolation to the epochs 1990–2019 and 2020–
cadal variation) of the dry epoch 1960–89. The linear                    2049
cooling trend is also marked.
   Flohn24 used the thickness of the 1000–500 hPa layer                  The 300 hPa temperature was warm over Asian mid-
of the atmosphere to study the climate change in atmos-                  latitudes during the wet decade 1950–59, which had only
pheric circulation (see Figure 4 of Flohn24), which shows                one drought monsoon. It was warm also during the dec-
a major change from the 1950s to 1960s. Figure 8 c gives                 ade 1990–99, which did not have even a single year of
the June to September average of the altitude of the                     drought in the ISMR. The epoch 1990–2019 was
500 hPa surface over Delhi, India, as observed by the                    expected to be a wet one, extrapolating the natural cycli-
radiosonde ascents of the period 1953–2011 (data taken                   city of the ocean–atmosphere system of the earlier 150-
from the Monthly Climatic Data of the World, a publica-                  year period. But during the decade 2000–09 there were
tion of NOAA, Ashville, USA). The five-year moving                       three droughts (monsoons of 2002, 2004 and 2009). Dur-
average clearly shows the dry epoch 1960–89. The wet                     ing the first part of the following decade, the years 2014
decades 1950–59 and 1990–99 are also clearly seen in the                 and 2015 had monsoon droughts. Thus the frequent
data with high 500 hPa altitude. There is a long-term                    drought scenario has reappeared after the first decade of
trend of decreasing 500 hPa altitude. The linear trend                   the expected wet epoch. The cooling trend of the Asian
marked shows the effect on the atmospheric circulation                   upper troposphere over Central Asia is believed to have
caused by atmospheric cooling over Central Asia. It may                  caused this. The upper troposphere cooling trend is ex-
be noted that the NCEP/NCAR re-analysis data (which                      pected to continue in the near future decades. With the
have some influence from the model used in the                           natural cyclicity of the ocean – atmosphere system that
re-analysis) and the pure observational data (500 hPa                    gave rise to the observed dry and wet epochs for a cen-
radiosonde measurements) give the same type of decadal                   tury and a half expected to continue and cause a dry
variation and climate change (decreasing trend).                         epoch during 2020–49, the observed cooling trend could

8                                                                                                      CURRENT SCIENCE, VOL. 110, 2016
Uncorrected Proof

                                                                                                               RESEARCH ARTICLES
make the upper troposphere over Central Asia even cold-                          on the Indian summer monsoon. Geophys. Res. Lett., 2006, 33,
er during 2020–49 accompanied by more intense equa-                              doi: 10.1029/2005GL02480.
                                                                           8.    Luo, F., Li, S. and Furevik, T., The connection between the Atlan-
torward intrusion of upper tropospheric westerlies over                          tic multidecadal oscillation and the Indian summer monsoon in
South Asia compared to the dry epoch 1960–89. We                                 Bergen Climate Model Version 2.0, Geophys. Res. Lett., 2011,
therefore expect more frequent and intense monsoon                               116, doi: 10.1029/2011JD015848.
droughts during 2020–49 than what we experienced dur-                      9.    Joseph, P. V., Bindu, G, Nair, A. and Wilson, S. S., Variability of
ing 1960–89 and a large percentage of severe cyclones of                         summer monsoon rainfall in India on inter-annual and decadal
                                                                                 time scales. Atmos. Oceanic Sci. Lett., 2013, 6, 398–403.
the BoB is expected to move north.                                        10.    Kalnay, E. et al., The NCEP/NCAR 40 year reanalysis project.
                                                                                 Bull. Am. Meteorol. Soc., 1996, 77, 437–471.
                                                                          11.    Joseph, P. V., Role of ocean in the variability of Indian summer
Summary and conclusion                                                           monsoon rainfall. Surv. Geophys., 2014, 35, 723–738.
                                                                          12.    Joseph, P. V. and Srinivasan, J., Rossby waves in May and the
Dry epochs, when frequent drought monsoons and north-                            Indian summer monsoon rainfall. Tellus A, 1999, 51, 854–864.
moving BoB severe cyclones occurred, were periods                         13.    Sathiyamoorthy, V., Mohankumar, K. and Joseph, P. V., Interan-
when the phase of AMO was cold. During the 150-year                              nual variability of total ozone and its relation with the Asia-Pacific
                                                                                 wave. Tellus B, 2002, 54, 269; doi: 10.1034/j.1600-0889.
period 1840–1990, there were alternating 30 year dry and                         2002.01219.x.
wet epochs. Extrapolating this natural cyclicity of the                   14.    Krishnan, R. and Mujumdar, M., Remotely and regionally forced
ocean – atmosphere system, the three decades 2020–49                             pre-monsoon signals over Northern India and neighbourhood.
are likely to have frequent disastrous droughts in the                           Q.J.R. Meteorol. Soc., 1999, 125, 55–78.
ISMR and a large percentage of the severe cyclones of                     15.    Joseph, P. V., Subtropical westerlies in relation to large-scale fail-
                                                                                 ure of Indian summer monsoon, Indian J. Meterol. Hydrol. Geo-
the BoB are likely to have northward tracks, adversely                           phys., 1978, 29, 412–418.
affecting the coastal region of north BoB. The upper                      16.    Vinay Kumar and Krishnan, R., On the association between the
troposphere of the mid-latitude region of Asia is found to                       Indian summer monsoon and the tropical cyclone activity over
have a cold anomaly in a dry epoch (decadal variability).                        northwest Pacific. Curr. Sci., 2005, 88, 602–612.
This region is also experiencing a long-term cooling                      17.    Joseph, P. V., Ocean–atmosphere interaction on a seasonal scale
                                                                                 over north India Ocean and Indian monsoon rainfall and cyclone
trend. It is feared that this cooling trend over the Asian                       tracks – a preliminary study. Mausam, 1981, 32, 237–246.
continent is likely to make the expected dry epoch 2020–                  18.    Joseph, P. V. and Pillai, P. V., Air–sea interaction over north In-
49 more severe in its impact than the dry epoch 1960–89.                         dian Ocean, inter-annual variations of sea surface temperature and
The South Asian region to be affected by droughts and                            Indian summer monsoon rainfall. Mausam, 1984, 35, 323–330.
cyclones has a high population density. There is urgent                   19.    Joseph, P. V. and Pillai, P. V., Air sea interaction on a seasonal
                                                                                 scale over north Indian Ocean, Part II: Monthly mean atmospheric
need for the global scientific community to take up fur-                         and oceanic parameters during 1972 and 1973. Mausam, 1986, 37,
ther studies, including modelling to understand the                              159–168.
ocean – atmosphere instability (negative feedback) on                     20.    Meehl, G. A., The south Asian monsoon and the tropospheric
both regional and global scales as described in this                             biennial oscillation. J. Climate, 1997, 10, 1921–1943.
article.                                                                  21.    Pan, Y. H. and Oort, A. H., Global climate variations connected
                                                                                 with sea surface temperature anomalies in the eastern tropical Pa-
 1. Bhalme, H. N. and Mooley, D. A., Large-scale droughts/floods                 cific Ocean for the 1958–73 period. Mon. Weather Rev., 1983,
    and monsoon circulation, Mon. Weather Rev., 1980, 108, 1197–                 111, 1244–1258.
    1211.                                                                 22.    Abish, B., Joseph, P. V. and Ola, M. J., Climate change in the sub-
 2. Parthasarathy, B. and Mooley, D. A., Some features of a long                 tropical jetstream during 1950–2009. Adv. Atmosp. Sci., 2015, 32,
    homogeneous series of Indian summer monsoon rainfall. Mon.                   140; doi: 10.1007/s00376-014-4156-6.
    Weather Rev., 1978, 106, 771–781.                                     23.    Yu, R., Wang, B. and Zhou, T., Tropospheric cooling and summer
 3. Joseph, P. V., Climate change in monsoon and cyclones 1891–                  monsoon weakening trend over East Asia. Geophys. Res. Lett.,
    1974. In Proceedings of the IITM Symposium on Monsoon, Pune,                 2004, 31, doi: 10.10.1029/2004GL021270.
    1976, pp. 378–387.                                                    24.    Flohn, H., History and intransitivity of climate. Physical Basis of
 4. Sontakke, N. A. and Singh N., Longest instrumental regional and              Climate and Climate Modelling (GARP publication No. 16), 1975,
    all-India summer monsoon rainfall series using optimum observa-              pp. 106–118.
    tions: reconstruction and update, Holocene, 1996, 6(3), 315–331.
 5. Parthasarathy, B., Munot, A. A. and Kothawale, D. R., All India       ACKNOWLEDGEMENTS. We thank the referees for their construc-
    monthly and seasonal rainfall series. Theor. Appl. Climatol., 1994,   tive suggestions. We also thank the European Union’s Seventh Frame-
    49, 217–224.                                                          work Programme (FP7/2012-2015) for funds under grant agreement
 6. Enfield, D. B., Mestas-Nunez, A. M. and Trimble, P. J., The           No.295092, INDO-MARECLIM coordinated by Nansen Environmental
    Atlantic multidecadal oscillation and its relationship to rainfall    Research Centre–India.
    and river flows in the continental US. Geophys. Res. Lett., 2001,
    28, 2077–2080.                                                        Received 28 January 2015; revised accepted 2 February 2016
 7. Goswami, B. N., Madhusoodanan, M. S., Neema, C. P. and Sen-
    gupta, D., A physical mechanism for North Atlantic SST influence      doi:

CURRENT SCIENCE, VOL. 110, 2016                                                                                                                      9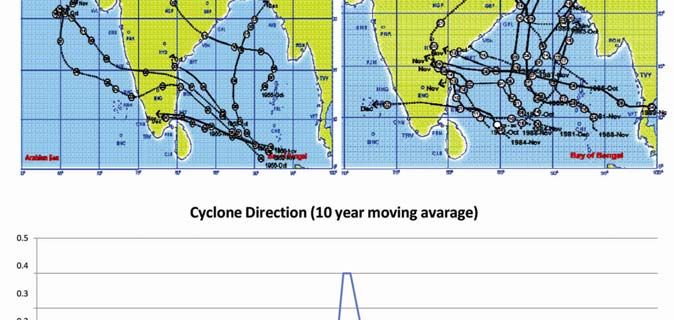
You can also read