A multi-year analysis of Canadian Arctic historical weather data in support of solar and wind renewable energy deployment
←
→
Page content transcription
If your browser does not render page correctly, please read the page content below
E3S Web of Conferences 246, 03006 (2021)                                                                  https://doi.org/10.1051/e3sconf/202124603006
Cold Climate HVAC & Energy 2021

        A multi-year analysis of Canadian Arctic historical weather data
        in support of solar and wind renewable energy deployment
        Adam Wills1*, Carsen Banister1, Mathieu Pellissier2, and Justin Berquist1
        1National   Research Council Canada, Construction Research Centre, 1200 Montreal Rd., Ottawa, Canada
        2Concordia   University, Building, Civil, and Environmental Engineering, 1455 De Maisonneuve Blvd. W., Montréal, Canada

                       Abstract. This work explores the importance of renewable resource temporal distribution for solar and
                       wind energy deployment in Arctic communities to meet building and ancillary loads. An analysis of ten
                       years of historic weather data was performed for six locations in the Canadian Arctic to assess renewable
                       resource variation. Simulations of similar capacity solar and wind generation systems were then coupled
                       with the historic data to compare and contrast generation potential. This analysis highlighted the importance
                       of considering hourly, daily, monthly, and year-to-year renewable generation when deploying solar and
                       wind to the Arctic. As many northern communities in Canada have local electricity generation and
                       distribution systems, and no connection to the continental grid, managing grid interactions effectively is
                       crucial to the success of deployment, integration, and operation. The results for the solar energy analysis
                       showed high consistency of production year-to-year. The results for the wind energy analysis showed that
                       the annual outputs have significantly less variation than the year-to-year output of individual months for all
                       the locations under study. For the high latitude locations studied, solar energy can still provide useful
                       electricity generation output, but the more pronounced bias of the annual output to the summer months can
                       leave several months with little or no output. The use of additional renewable sources is crucial in beginning
                       to transition some electricity generating capacity within Arctic communities from being solely reliant on
                       fossil fuels.

        1 Introduction
            Most remote communities in Canada are not                              2 Weather data source
        connected to the North American continental electricity
                                                                                       Environment and Climate Change Canada (ECCC)
        distribution network and therefore rely exclusively on
                                                                                   is a governmental department that maintains the
        diesel generators for electricity production. There is a
                                                                                   Canadian Weather Energy and Engineering Datasets
        strong interest developing within many remote
                                                                                   (CWEEDS) [1]. The most recent version of this dataset
        communities for successful integration of renewable
                                                                                   contains historic hourly weather data for 564 Canadian
        energy systems to reduce diesel dependency and to
                                                                                   locations, with most locations having data from 2005 to
        increase sustainability and resiliency. Diesel
                                                                                   2017. The weather datasets are publically available
        combustion not only emits a high intensity of
                                                                                   online, and are published in WYEC3 format. In addition
        greenhouse gases, but also emits black carbon which
                                                                                   to typical observations such as temperature and wind
        further contributes to global warming through reduction
                                                                                   speed at 10 m, solar irradiance data is also provided.
        of snow and ice albedo.
                                                                                   Hourly solar is however, primarily modeled data using
            Although diesel electricity generation has
                                                                                   a technique developed at the State University of New
        environmental drawbacks, it is dispatchable and can
                                                                                   York (SUNY).
        therefore respond to changes in demand as long as fuel
                                                                                       To make the weather datasets more accessible to
        and functional generators are available. This work
                                                                                   energy modeling tools, all weather data used for this
        quantifies the variability of solar and wind resources in
                                                                                   study were converted from WYEC3 to EPW format
        several Arctic locations within Canada. Most solar and
                                                                                   using the Weather Statistics and Conversion tool from
        wind resource assessment tools are limited in the level
                                                                                   the National Renewable Energy Laboratory (NREL) [2].
        of detail of their data and analysis. This paper
                                                                                   This format was initially created for use with the
        contributes to the gap that exists in detailed solar and
                                                                                   building simulation tool EnergyPlus [2], but is also
        wind resource analysis by presenting data on finer time
                                                                                   compatible with several detailed building energy and
        scales over several years. The value of this approach is
                                                                                   energy system simulation tools.
        the ability to assess consistency and intermittency of
        sustainable energy from solar and wind over their
        operational life.

        * Corresponding author: Adam.Wills@nrc-cnrc.gc.ca

   © The Authors, published by EDP Sciences. This is an open access article distributed under the terms of the Creative Commons Attribution License 4.0
   (http://creativecommons.org/licenses/by/4.0/).
E3S Web of Conferences 246, 03006 (2021)                                                      https://doi.org/10.1051/e3sconf/202124603006
Cold Climate HVAC & Energy 2021

       2.1 Climate locations considered                                using typically reported manufacturer performance data.
                                                                       The circuit analogy model is then used to estimate PV
           The six locations selected for this study are               module performance under operating conditions.
       geographically dispersed across the north and include               For this analysis, an array of four 350 W PV modules
       some population centres as well as smaller                      was modeled using the parameters of a commercially-
       communities:                                                    available poly-crystalline module [5]. The model’s 5
       - Whitehorse, Yukon;                                            parameters were determined using manufacturer data
       - Inuvik, Northwest Territories;                                and the TRNSYS PV parameter calculator, summarized
       - Yellowknife, Northwest Territories;                           in Table 1. Other model inputs may be found in [5].
       - Cambridge Bay, Nunavut;
       - Iqaluit, Nunavut;                                             Table 1. PV model 5-parameter inputs.
       - Kuujjuarapik, Québec.                                                     Parameter                       Value
           All locations are at a northern latitude greater than        Ideality factor, a                       1.589 eV
       55°, with the most northern location, Cambridge Bay, at          Light current, IL                         11.25 A
       a latitude of 69°. The locations also represent different        Reverse saturation current, I0         1.146E-10 A
       climate types across Canada’s North. Annual weather              Series resistance, Rs                    0.2272 Ω
       data from 2008 to 2017, inclusive, were processed for            Shunt resistance, Rsh                     396.4 Ω
       each of the locations.
                                                                           For each location considered, the 1.4 kW PV array
                                                                       was modeled as facing due south with a slope equal to
       3 Methodology                                                   location latitude; according to Duffie and Beckman [6],
                                                                       this slope generally provides optimal solar collection of
           Renewable generation potential for solar and wind
                                                                       non-tracking systems.
       sources were analysed and compared using detailed
       energy models of solar photovoltaic (PV) and wind
       turbine power conversion systems. Wind kinetic energy           3.2 Wind turbine modeling
       and solar radiation energy are different forms of energy,
       thus making it challenging to compare renewable energy              Wind conversion and generation was modeled using
       potential at different locations directly from                  TRNSYS 18 standard component Type 90. Type 90 is a
       measurements of the natural phenomena. The approach             steady-state empirical model initially developed by
       in this work was therefore to compare the renewable             Quinlan [7]. The model primarily uses a power output
       energy conversion and generation performance of a               versus wind speed curve to estimate wind turbine
       solar PV array and wind turbine generator of identical          performance, where the curve is corrected for the
       rated capacities at 1.4 kW. Detailed electricity                variations in operating condition air density. For this
       generation modeling of these systems using historic             study a performance curve from a commercially-
       weather data also provides supplementary data beyond            available 1.4 kW horizontal-axis wind turbine [8] was
       rated capacity to energy planners, such as monthly              used. This curve is plotted in Figure 1.
       electricity generation estimates, peak power, and finer
       resolution data.
           For this analysis solar and wind conversion and
       generation was modeled using TRNSYS 18 [3].
       TRNSYS is a detailed energy systems simulation tool
       initially developed to model the performance of solar
       thermal systems. It has since been expanded to include
       transient modeling of a variety of energy conversion and
       transfer systems and components down to sub-hourly
       timescales. Energy system models are constructed in
       TRNSYS by linking model subunits, referred to as                Figure 1. Modeled wind turbine power curve.
       ‘Types’, which represent individual components of the
       system. For this work three Types were used and are                 The 1.4 kW rated turbine capacity was selected to
       described below. For each location and weather year,            correspond to the rated output of the PV array. The cut-
       these models were used to estimate monthly and hourly           in speed of the turbine is 2.5 m/s, and the cut-out is
       renewable generation.                                           25 m/s.

       3.1 PV modeling                                                 4 Results
           Solar conversion and generation was modeled using               The results are divided into the following three
       TRNSYS 18 standard component Type 190. Type 190                 sections. The first summarizes the annual outputs for all
       is the 5-parameter model developed previously by De             six locations. The second presents the year-to-year
       Soto et al. [4] which represents PV modules as an               variation of the monthly solar and wind electricity
       equivalent resistor/diode circuit. The characteristics of       production. The third section presents the analysis of
       the circuit components (resistance, etc.) are defined

                                                                   2
E3S Web of Conferences 246, 03006 (2021) https://doi.org/10.1051/e3sconf/202124603006
Cold Climate HVAC & Energy 2021
daily and hourly generation variation focused on
Cambridge Bay, Nunavut.
4.1 Annual outputs
A summary of the annual outputs for solar and wind
are provided in Table 2. The annual solar outputs for
these locations are fairly consistent, indicated by the
relatively low standard deviation. For wind output, the
mean annual output varies significantly across the
different locations. Cambridge Bay, Iqaluit, and
Kuujjuarapik have very high annual wind output, while
the remaining three do not. Although not exhaustive,
one of the reasons is that the three highest producing
locations are coastal, whereas the three lowest
producing locations are inland and not at exposed Figure 2. Measured monthly electrical demand for Gjoa
elevations. Wind measurements at the inland locations Haven, NU, from QEC (as cited in [9])
could vary significantly with variations in local position. Figure 2 shows peak demand occurring in December
The coefficients of variance (CVs) of the annual wind and January, whereas it can be seen in Figure 3 peak
outputs are far greater relative to the solar CVs. The solar output occurs in April and May. Another
three highest output locations have a standard deviation interesting characteristic of Figure 2 is that it suggests
of approximately 10% of the mean and for Yellowknife the year-to-year variability in community electrical
this figure is over 30%. demand is relatively low. This is beneficial as it reduces
Table 2. Annual mean and CV of modeled electricity uncertainty of load estimates for electricity generation
generation for all locations. planning.
Qualitatively, the modeled wind energy outputs for
Solar Output Wind Output
four of the locations in Figure 4 (Iqaluit, Cambridge
Location [Latitude] Mean Mean
CV CV Bay, Kuujjuarapik and Whitehorse) show a pattern of
[kWh] [kWh]
Cambridge Bay [69°] 1270 2.9% 1765 10.1% producing more during the winter months. Three of the
Inuvik [68°] 1279 3.8% 265 7.2% locations; Cambridge Bay, Iqaluit, and Kuujjuarapik,
Iqaluit [64°] 1367 4.8% 1569 10.1% have high output in comparison to the other three
Kuujjuarapik [55°] 1462 4.7% 1289 10.7% locations. The higher output locations have typical
Whitehorse [61°] 1347 3.3% 788 12.6% monthly outputs of around 100 to 200 kWh per kW,
Yellowknife [62°] 1402 2.9% 542 32.5% whereas the lower output locations have less than 100
kWh per kW output for most of the months evaluated.
The year-to-year outputs for a given month have
4.2 Year-to-year monthly assessments significantly greater variation for the wind data
Monthly data for both solar PV and wind turbine compared to the solar, with relatively larger CV values
modeled outputs were tabulated for the six locations and for each month as shown in Figure 4. In fact, the lowest
are presented in Figure 3 and Figure 4, respectively. years for a given month are often approximately half of
Also provided in the figures are the CVs of the energy the highest output for that same month in a different
outputs for each month of the year, across the ten climate year.
years.
The output from the solar PV system in all locations
is shown to be concentrated to the summer months, as
expected. The solar output is relatively consistent year-
to-year for each month for all locations, as shown by the
relatively low CV values provided in Figure 3. The
differences observed are due to atmospheric variations,
such as cloud cover or fog. As expected, the highest
latitude locations show the most concentration of
generation with close to zero production in the core of
winter, whereas for the lowest latitude locations it is
more spread across summer and winter.
A challenge posed by the concentrated solar
production is that peak production is often seasonally
mismatched from the peak demand in cold climates. For
example, Figure 2 plots the monthly electrical demand
of a northern Nunavut community at latitude 68.6°.
3E3S Web of Conferences 246, 03006 (2021) https://doi.org/10.1051/e3sconf/202124603006
Cold Climate HVAC & Energy 2021
400
N/A 13% 8% 8% 7% 10% 11% 11% 19% 30% 33% N/A
300
Cambridge 200
Bay
100
0
Jan Feb Mar Apr May Jun Jul Aug Sep Oct Nov Dec
400
N/A 10% 6% 6% 10% 8% 12% 14% 18% 30% 31% N/A
300
200
Inuvik
100
0
Jan Feb Mar Apr May Jun Jul Aug Sep Oct Nov Dec
400
N/A 13% 7% 7% 8% 9% 12% 12% 19% 18% 30% N/A
300
200
Iqaluit
100
0
Jan Feb Mar Apr May Jun Jul Aug Sep Oct Nov Dec
400
19% 11% 8% 12% 9% 8% 10% 9% 14% 13% 22% 19%
300
200
Kuujjuarapik
100
0
Jan Feb Mar Apr May Jun Jul Aug Sep Oct Nov Dec
400
16% 18% 13% 5% 6% 5% 9% 11% 9% 15% 24% 20%
300
200
Whitehorse
100
0
Jan Feb Mar Apr May Jun Jul Aug Sep Oct Nov Dec
400
22% 15% 6% 5% 7% 5% 7% 7% 17% 22% 32% 23%
300
200
Yellowknife
100
0
Jan Feb Mar Apr May Jun Jul Aug Sep Oct Nov Dec
Figure 3. Modeled solar energy output by month per system nominal power output [kWh/kW] and CV for each month for 2008-2017
4E3S Web of Conferences 246, 03006 (2021) https://doi.org/10.1051/e3sconf/202124603006
Cold Climate HVAC & Energy 2021
400
20% 31% 23% 19% 20% 29% 22% 21% 18% 23% 28% 43%
300
Cambridge 200
Bay
100
0
Jan Feb Mar Apr May Jun Jul Aug Sep Oct Nov Dec
400
95% 79% 40% 44% 20% 25% 25% 31% 28% 60% 47% 57%
300
200
Inuvik
100
0
Jan Feb Mar Apr May Jun Jul Aug Sep Oct Nov Dec
400
27% 31% 28% 31% 26% 38% 41% 34% 17% 11% 21% 21%
300
200
Iqaluit
100
0
Jan Feb Mar Apr May Jun Jul Aug Sep Oct Nov Dec
400
25% 36% 32% 24% 26% 22% 26% 23% 22% 29% 10% 25%
300
200
Kuujjuarapik
100
0
Jan Feb Mar Apr May Jun Jul Aug Sep Oct Nov Dec
400
25% 35% 35% 33% 37% 29% 26% 37% 31% 32% 29% 30%
300
200
Whitehorse
100
0
Jan Feb Mar Apr May Jun Jul Aug Sep Oct Nov Dec
400
50% 30% 41% 33% 40% 38% 45% 34% 44% 34% 28% 53%
300
200
Yellowknife
100
0
Jan Feb Mar Apr May Jun Jul Aug Sep Oct Nov Dec
Figure 4. Modeled wind energy output by month per system nominal power output [kWh/kW] and CV for each month for 2008-2017
5E3S Web of Conferences 246, 03006 (2021) https://doi.org/10.1051/e3sconf/202124603006
Cold Climate HVAC & Energy 2021
4.3 Daily and hourly assessments
To examine the impacts of daily and hourly
renewable generation variability, the hourly simulation
results for Cambridge Bay, Nunavut were considered.
Of all locations considered, it is the furthest north with
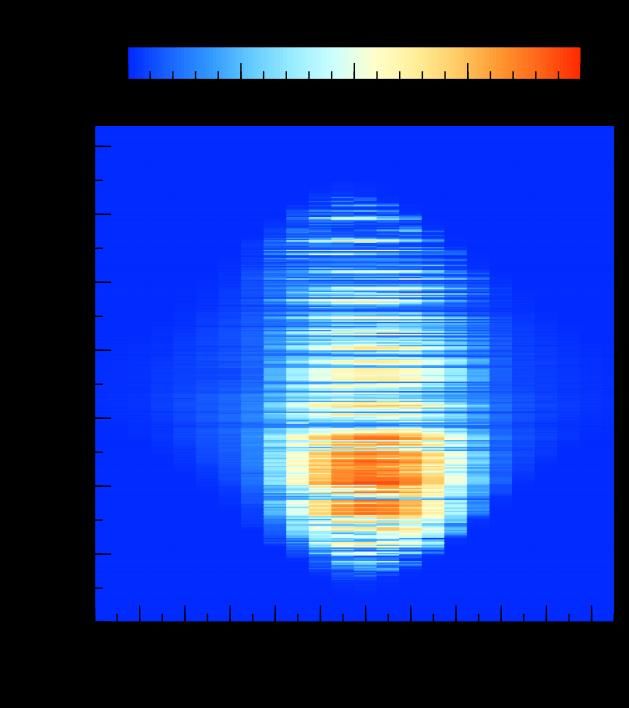
a latitude of 69°. Figures 5 and 6 plot the temporal
distribution of hourly solar and wind production
modeled using 2017 weather data, respectively. The
annual electricity generation for 2017 is 1.75 and
2.23 MWh for solar and wind, respectively.
Similar to what can be seen in Figures 3 and 4, the
seasonal variation of electricity generation from solar
radiation can be clearly seen in Figure 5. Electricity
generation from wind in Figure 6 varies considerably
throughout the year with no obvious seasonal pattern
visible on this image, although a faint seasonal bias
towards increased production in the winter months can
be noticed.
It can also be seen in Figure 5 that during periods of Figure 5. Modeled solar generation for 2017 in Cambridge
high solar production there is less day-to-day generation Bay.
variation compared to wind generation. To better
visualize the day-to-day variation differences, the daily
solar and wind production for June is plotted in Figure
7. June was selected since it illustrates the month of
highest solar production.
To quantify and compare the daily generation
variability the sample means, standard deviations, and
CVs of the data in Figure 7 were determined,
summarized in Table 3.
Table 3. Mean, standard deviation, and CV of modeled daily
electricity generation for Cambridge Bay in June 2017.
Mean Std. Dev. CV [%]
System
[kWh/day] [kWh/day]
Solar 8.20 2.45 30%
Wind 4.33 3.13 72%
The relatively high CV for wind compared to solar
demonstrates the high variability of wind production
compared to solar.
Figure 6. Modeled wind generation for 2017 in Cambridge
Bay.
Figure 7. Modeled daily solar and wind generation for June
2017 in Cambridge Bay.
6E3S Web of Conferences 246, 03006 (2021) https://doi.org/10.1051/e3sconf/202124603006
Cold Climate HVAC & Energy 2021
5 Discussion demand are seasonally mismatched, as expected.
However, the multi-year energy analysis highlighted
One of the big challenges of solar and wind energy that year-to-year solar production is more consistent
is that they are both intermittent and non-dispatchable. compared to wind, both for monthly and total annual
This analysis looked at the variability of these renewable production. Therefore, it is important to consider the
resources over ten years of weather data for 6 locations combination of renewable sources to balance their
in the Arctic. The analysis shows that solar PV systems strengths and weaknesses.
can be expected to provide a consistent annual energy To bridge the gap between renewable generation and
output from year-to-year for the locations studied. A demand, energy storage is often used. For all energy
wind energy system in these locations would have more storage systems there are associated losses associated
variation in annual output based on this modeling. with charge/discharge and losses to ambient. Future
A demand profile for a community in the Canadian work will explore the integration of energy storage with
Arctic was presented as an example. However, the wind and solar, and analyse the optimal balances of
application of this work is not focused specifically on wind, solar, and energy storage to achieve high
community-scale renewable energy projects. Individual renewable energy penetration without impractical
building demands could be expected to mirror the storage capacity requirements. Future analyses will also
seasonal trend seen for an overall community of higher explore the robustness of these optimal solutions across
electricity demands in the winter months and lower several weather years.
during the summer months. Possible reasons for these
trends is more electricity use by HVAC equipment,
engine block heating, appliances, lighting and plug References
loads as occupants spend more time indoors during the
winter months. Note that space and water heating loads
[1] ECCC, "Engineering Climate Datasets," Government
in the Arctic are almost universally met using diesel
of Canada, 24 Mar 2018. [Online]. Available:
fuel, not electricity. http://climate.weather.gc.ca/prods_servs/engineering_
The electricity generation from solar radiation varies e.html. [Accessed 31 May 2018].
from month-to-month as a result of the geometry
[2] NREL, "EnergyPlus," U.S. Department of Energy,
between the sun and earth, but its monthly output is 2020. [Online]. Available: https://energyplus.net/.
much more consistent than wind energy from year-to- [Accessed 13 January 2021].
year. This could form a significant base output for Arctic [3] TESS, "TRNSYS: Transient System Simulation
communities during the six sunniest months of the year. Tool," 2019. [Online]. Available:
Although wind energy output is more variable on http://www.trnsys.com/. [Accessed 26 July 2019].
annual, monthly, daily, and hourly timescales, its [4] W. De Soto, S. A. Klein and W. A. Beckman,
distribution throughout the year is far more spread out "Improvement and validation of a model for
compared to the seasonally concentrated output of solar. photovoltaic array performance," Solar energy, pp.
As a result, solar output can be predicted better on all 78-88, 2006.
timescales, but wind output is better able to meet [5] Canadian Solar, "HiKu High Power Poly Perc Module
demands throughout the course of a year. 325 W ~ 350 W," Canadian Solar Inc., Guelph, 2020.
[6] J. A. Duffie and W. A. Beckman, Solar Engineering
of Thermal Processes, Hoboken: John Wiley & Sons,
6 Conclusions and future work 2006.
The combination of solar and wind energy is [7] P. J. A. Quinlan, Time series modelling of hybrid
expectedly variable and often out of sync with building wind photovoltaic diesel power systems, Madison:
electricity demands in the Arctic. These renewable University of Wisconsin-Madison, 1996.
energy sources are not expected to meet the full energy [8] Fortis, "Fortis Wind Energy Passaat Wind Turbine
demands of Arctic communities, but the near-term goal Instruction Manual," Fortis Wind BV, Haren, 2013.
is to increase reliable renewable energy deployment in [9] WWF, "Community Energy Report: Gjoa Haven,"
these communities to reduce diesel use, build local World Wide Fund For Nature, Gland, 2018.
capacity for the required skills, and gain confidence in [10] ECCC, "Winter 2015 to 2016: Climate Trends and
the products and installation techniques. Variations Bulletin," Environment and Climate
Based on the analysis of the six Arctic locations it Change Canada, 2017. [Online]. Available:
was determined that wind generation systems nominally https://www.ec.gc.ca/sc-
cs/default.asp?lang=En&n=55965A8C-
achieve more annual energy production per system 1&wbdisable=true. [Accessed 13 January 2021].
power rating compared to solar for two of the six
locations studied. Even for the locations with lower
annual normalized output, it can still make sense to
install wind power due to its more favourable
distribution throughout the year.
The data also illustrated that across all Arctic
locations wind generation is more spread throughout the
year, whereas peak solar production and peak electric
7You can also read