Indicators to measure intraday electricity market efficiency in 18 selected Member States of the European Union
←
→
Page content transcription
If your browser does not render page correctly, please read the page content below
Indicators to measure intraday electricity market
efficiency in 18 selected Member States of the
European Union
Jan Frederick George*, Barbara Breitschopf, Jenny Winkler
Fraunhofer Institute for Systems and Innovation Research ISI
Karlsruhe, Germany
jan.george@isi.fraunhofer.de
Abstract—With increasing volatile wind and solar energy avoiding grid bottlenecks, the availability of flexibility options
generation, the importance regarding designs of intraday and and their efficient utilisation becomes increasingly important.
balancing energy markets ensuring efficient allocation of energy
supply is growing. Typically yearly traded volumes and prices of The availability of flexibility is most crucial during hours,
intraday power exchanges and imbalances are used to analyse the in which the deviation of the actual and forecasted (day ahead)
market performance. This study introduces two indicators to residual load (οܴ )ܮis highest. In this paper, based on the
measure efficiency in intraday electricity markets. The efficiency approach used for assessing flexibility in the context of the
is measured during hours of high deviation of actual and Eur’ObservER Report1, we define such hours as critical hours
forecasted residual load. The results of the analysis show non- ሺ݄ା ሻǤ[1]
complementarity of activated balancing energy to forecast
deviations, thus pointing to an inefficient market. As the power In this analysis, we investigate how efficiently the
plant generation mix cannot sufficiently explain the intraday electricity market delivers “flexibility” in these critical hours.
market inefficiency, further research regarding imbalance When doing so, we focus on critical hours with a positive
regulations and incentives as well as forecast information deferral deviation. In these hours, the actual residual energy demand is
and OTC trading practice is needed. higher than forecasted, hence the market is short on energy and
ramp-up capacity is needed. In order to deliver sufficient ramp-
Index Terms— forecast deviation, intraday market, inefficiency up capacity at reasonable costs, i.e. to meet the objective of the
EU Energy Union2, an efficient performance of the market, i.e.
I. INTRODUCTION a functioning market clearing mechanism providing this
flexibility at least cost is required.
The integration of renewable energies in the existing power
system is currently a major challenge. This challenge is the In this study, two indicators measuring the efficiency of
result of increasing renewable energy shares in the electricity flexibility provision between day-ahead and actual, physical
system aimed at decarbonizing energy supply in the European delivery are developed. It is assumed that intraday electricity
Union (EU) and Member States (MS). Volatile renewable markets work efficient when balancing needs are low, i.e. are
energies (vRE), especially technologies converting wind and close to zero. [2] Based on this assumption and the derived
solar radiation, are crucial for such sustainable energy indicators, the market efficiency for providing flexibility in the
provision. To tremendously reduce greenhouse emissions, it is EU MS is assessed and evaluated. In addition, we discuss some
not only necessary to not replace the existing fossil power possible reasons for low efficiencies.
generation units with sustainable technology, but to install
In the remainder of this paper, first the motivation of
expand capacities beyond to provide clean energy for mobility
developing enhanced indicators measuring the market
and heat applications as well as industrial processes.
efficiency for flexibility will be explained. Next, the
The fluctuating production of electrical energy from vRE methodology for the determination of these indicators and the
plants and the location-dependent resource availability of utilized data will be introduced. Afterwards, the results of the
decentralized locations as well as their comparatively small size approach will be depicted and discussed. Subsequently,
challenges the historically evolved electricity system possible reasons for differences between MS regarding the
characterised by central and dispatchable power plants. To indicators will be assessed, i.e. the share of vRE as well as
ensure energy supply security and system stability as well as flexible and inflexible power plants of the MS. Finally, the
1 2
See: https://www.isi.fraunhofer.de/en/competence-center/energiepolitik- Sustainable, affordable, secure, competitive energy
energiemaerkte/projekte/eu-res-monitoring.html#tabpanel-3
978-1-7281-1257-2/19/$31.00 ©2019 IEEE
Authorized licensed use limited to: FhI fur System- und Innovationsforschung. Downloaded on February 23,2021 at 10:38:00 UTC from IEEE Xplore. Restrictions apply.
conclusions of this study will be discussed considering findings
from previous research and further research needs listed.
II. MOTIVATION FOR ENHANCED FLEXIBILITY INDICATORS
Studies assessing flexibility of the power system so far
mostly focus on the physical availability of flexibility options
(compare among others [3, 4]) or the assessment of market
rules, market liquidity or other regulatory provisions (compare
among others [2, 5–9]). As explained above, however, in times
when flexibility needs are high but flexibility capacity is scarce,
it needs to be allocated in an efficient and effective way.
Above, critical hours ݄ା with the need of flexibility Figure 1. Intraday exchange volume, οܴ ܮand the share of indraday
provision were explained. In such hours, when οܴ ܮis high, the exchange trade of οܴ ܮin France 2017 (source: own assessment with data for
provision of flexibility means that capacity is ramped up during οܴ[ ܮ11] and intraday volume [12])
the day, reacting to new information about electricity demand
and generation from vRE. Thus, intraday trading enables short-
term distribution of non-expected deviations. Ideally, the
balancing market is then used to cover a relatively small
remaining difference between actual and forecasted (i.e. traded)
demand and supply. If intraday markets work efficiently, the
sum of intraday trading (including im-/exports) for any certain
hour should equal οܴ ܮof this hour. [2]
As shown among others by [10] based on the example of
Germany, a higher intraday power exchange volume, slender
temporal resolution, shorter time period between gate closure
and physical delivery as well as extended trading times to 24/7,
decrease the need for reserve power. Based on this interrelation Figure 2. Positive and negative balancing energy and correlating imbalance
costs trade in France 2017 (source: own assessment with data from [11])
between intraday exchange trading and balancing needs, we use
the actual balancing power in a certain hour as a key parameter To illustrate the performance of reserve power to balance
for the efficiency of the intraday power market of the MS. οܴܮ, the imbalance volumes of the highest 50 critical hours ݄ା
Further, we define the intraday market as all trading being done are depicted for France as a specific example in Figure 2. The
(stock exchange-based and over-the-counter (OTC)) after gate- figure shows first that a higher need for activation of reserves is
closure of the day-ahead power exchange. Even though correlated with higher imbalance prices, which is not
temporal inaccuracies between power exchange trading times surprising. Second, it displays, that the vast majority of
and day-ahead forecasts of vRE exist, the focus is put on the imbalance volumes are negative during the 50 most critical
short-term trading features. hours ݄ା . This effect is non-complementary to the need of
Figure 1 and Figure 2 show actual stock exchange-based positive ramp-up energy to compensate οܴܮ. Not only the
intraday trading, and the activation of balancing energy for the negative sign of the imbalance, but also the volume emphasises
50 highest critical hours ݄ା of France in 2017, respectively. a possible distortion of expected flexibility needs. For example,
Both figures give a first impression that market efficiency for the absolute value of hour 2 is almost half of the absolute οܴܮ
providing flexibility is not very high in critical hours ݄ା . when comparing it with the related value from Figure 1. The
results of the balancing markets in the critical hours ݄ା are very
Figure 1 shows the absolute deviation between day-ahead counterintuitive and give an indication that at least in France in
forecasted residual load and actual load, as well as the volume the most critical hours ݄ା in 2017, intraday markets did not
and relative share of this deviation traded in the intraday work as expected. The need for negative balancing in hours
market. It can be seen, that the volume of the intraday power with a high demand for ramp-up capacities could even be called
exchange in France does not contribute significantly to a paradox.
compensate the forecast errors. The highest shares of at the
intraday exchange traded volumes in relation to the absolute In the following, we will first test whether the observed
deviation of actual and forecasted volume can be found with paradoxical need for negative balancing energy in critical hours
19% in the 50th critical hour ݄ା and 16% in the 16th and 49th ݄ା and thus existing intraday market inefficiencies are a
critical hour ݄ା . Consequently, the rest of deviation not being broader phenomenon in the EU energy markets or only prevail
traded at the intraday exchange has to be compensated via OTC in the French market. In order to do this, two indicators for
intraday market or with activation of reserve energy. intraday market efficiency are developed and analysed.
Afterwards, the observed results are analysed regarding some
possible reasons such as the plant mix of a specific country.
Authorized licensed use limited to: FhI fur System- und Innovationsforschung. Downloaded on February 23,2021 at 10:38:00 UTC from IEEE Xplore. Restrictions apply.
III. METHODOLOGY volume independent view: on the hours of activated negative
To assess the efficiency of intraday market flexibility reserve power in the top thousand critical hours ݄ା . This
provision, two indicators are developed and explained in the measurement enables a perspective on the frequency of
following. In addition, we briefly outline the methodology overcompensation of οܴܮ. The indicator for negative reserve
applied for identifying critical hours ݄ା and checking for share during the high hours ݄ା in which up-flexibility is
potential relations between intraday market behaviour and needed, depicts the ratio of critical hours with negative reserve
selected parameters characterising the power system. energy of the 1000 highest critical hours ݄ା where up-
flexibility is needed (NIS).
A. Identification of critical hours ݄݊ ݂ ݎܾ݁݉ݑା ݏ݈ܾ݁ܿ݊ܽܽ݉݅݁ݒ݅ݐ݄ܽ݃݁݊ݐ݅ݓ
A critical hour ݄ is calculated according to [1] as one hour ܰؔ ܵܫ
ͳͲͲͲ (IV)
of a specific year with a high deviation of the actual residual ǡ ݂݄ ݈݈ܽ ݎା ൌ ሼͳǡ ǥ ǡͳͲͲͲሽ
load (ܴܮ ) from forecasted residual load (ܴܮ ሻ (day ahead of
physical delivery). The residual load itself is defined as the Because the share of hours with negative reserve power
difference between the demanded energy (ܮሻ and the generated activation during the top thousand critical hours ݄ା do not
energy from Wind and Photovoltaics ሺܧܴݒሻ in hour ݄ with ݂ contain any information about the volume of activated reserve
and ܽ indicating either forecasted or actual values: power, an additional measurement is needed. Therefore, a
second indicator is calculated: the median of the imbalance
ܴܮሺ݄ሻ ൌ ܮሺ݄ሻ െ ܧܴݒሺ݄ሻ (I) shares (MSI). The imbalance shares indicate for each critical
hour the absolute values of imbalances (negative and positive)
ܴܮሺ݄ሻ ൌ ܮሺ݄ሻ െ ܧܴݒሺ݄ሻ (II)
in relation to the positive οܴܮ. The share is used because only
The deviation between residual load forecast and actual the absolute volume would not provide an adequate basis for a
residual load οܴ ܮis determined as followed: comparison between the MS, since the total energy demand and
vRE generation varies significantly within the MS. Thus, the
οܴܮሺ݄ሻ ൌ ܴܮሺ݄ሻ െ ܴܮሺ݄ሻ (III) hourly share takes the volume of imbalance as nominator and
The value of οܴܮcan be both, positive or negative, stating positive οܴ ܮas denominator.
either undersupply or oversupply of energy. When οܴܮሺ݄ሻ ܾܽ ݈ܾ݂݁ܿ݊ܽܽ݉݅݁ݑ݈ܽݒ݁ݐݑ݈ݏሺ݄ା ሻ
Ͳ the energy system is short on energy and either extra electrical ݂ ݊ܽ݅݀݁ܯ ؔ ܫܵܯ
οܴܮሺ݄ା ሻ (V)
energy needs to be allocated/generated or load has to be
reduced. These hours are defined as ݄ା . Analogically, in hours ǡ ݂݄ ݈݈ܽ ݎା ൌ ሼͳǡ ǥ ǡͳͲͲͲሽ
with οܴܮሺݐሻ ൏ Ͳ more energy is available than demanded i.e. This indicator depicts the average magnitude of the
the power system is long. In these hours defined as ݄ି either distortion between energy supply and demand, i.e. it shows how
reduction of power generation is needed or an increase of load much the need for ramping up and the actual activation of
is necessary. Every hour ݄ା and ݄ି receives a position in the reserves diverges. It is a measure for the extent of inefficiency
order of positive and negative critical hours, decreasing with in the intraday market.
lower οܴܮ. As short term ramp up power is considered the
more challenging flexibility condition, this study will focus on Following this approach, countries with low shares exhibit
critical hours of ݄ା , with high οܴ ܮand power shortage. efficient intraday market performance, while high shares define
inadequate intraday mechanism.
B. The efficiency measurement approach of energy intraday
markets C. Definition of inflexable and flexible generation capacities
Considering the need of balancing power as the key As agility varies with technology and utilized energy type
criterion for efficiency in the intraday market, the efficiency among power plants, it is assumed that inflexible (e.g. nuclear
indicators are based on the imbalance values of the highest and lignite) and flexible (e.g. gas and hydro) power plants
thousand critical hours. contribute differently to intermittent ramp-up, especially when
fast reactions are needed. The indicators will be analysed
As stated above an ideal system, intraday trading, both considering the power plant mix of the selected MS especially
exchange-based and OTC should reduce the deviations during regarding the share of ܧܴݒgeneration.
physical delivery and thus lead to a lower need for balancing
energy3. Hence, the efficiency is measured regarding the In order to enhance the assessment of intraday market
activated reserves in times of energy shortage, i.e. in critical efficiency, flexible generation potential of the MS is also taken
hours. This approach is also motivated by [13] expecting to into consideration. The generation share (GS) of ܧܴݒas well
reduce imbalances through intraday market mechanisms. as the share of flexible and inflexible power plants of the total
energy generation in 2017 are computed for the selected MS.
Thus, the activated balancing reserve volume is considered The GS is calculated with the nominator containing the
as an appropriate key parameter to measure efficiency of the cumulated power generation of yearly produced energy from
intraday market. Regarding the imbalances during the critical specific power plant types i that display a limited flexibility and
hours ݄ା , two indicators are calculated. One indicator depicts a
3
Assuming that balancing market compensates for unforeseen load,
technical and system problems, and the intraday market for vRE
Authorized licensed use limited to: FhI fur System- und Innovationsforschung. Downloaded on February 23,2021 at 10:38:00 UTC from IEEE Xplore. Restrictions apply.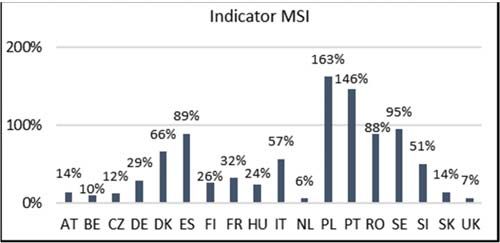
the denominator containing the total energy generation of one extreme lack of reaction of the intraday market, i.e. an
year for each MS: undershooting mobilisation of ramping-up capacities, which
has to be corrected by the balancing market.
σୀଵ ݁݊݁݅ ݁ݕݐݐ݈݂݊ܽ݊݅ݐܽݎ݁݊݁݃ݕ݃ݎ
ܵܩൌ (VI)
݊݅ݐܽݎ݁݊݁݃ݕ݃ݎ݈݁݊݁ܽݐݐ
The ܧܴݒplants encompass solar and wind power
plants. Flexible power plants are containing plant types of
biomass, hydro and gas. The inflexible share displays the ratio
of all nuclear, lignite, fossil hard coal and oil power plants
generation to the overall energy production in 2017.
D. Data
The data for imbalance volumes and prices are taken from the
imbalance power data provided by transparency platform from
ENTSO-E in section imbalances [11]. Data source regarding
the actual generation of all power plant types is also taken from Figure 4. Indicator 2 - Median share of imbalance and οܴ ܮduring the
the transparency platform of ENTSO-E from section generation highest 1000 critical hours ݄
ܿ (source: own assessment with data from [11] )
[11]. The data providing the forecast of ܧܴݒcan be found as
well at transparency platform in section forecast [11]. Data for There are several possible explanations for such paradoxical
the intraday exchange for France is taken from the intraday market behaviour. A first assumption is that in countries with a
exchange EPEX Spot [12]. Missing data in one specific hour less flexible generation fleet, flexibility is lower and thus more
led to exclusion of this hour in this investigation balancing power needs to be activated. To explore this a bit
more, Fig. 5 shows shares of ܧܴݒ, flexible and inflexible power
IV. RESULTS plant generation of the total energy generation for each MS in
2017.
In the following the results of the enhanced flexibility
indicators are presented.
Fig. 3 depicts the share of hours with negative imbalance
(NIS) of the highest 1000 critical hours ݄ା for the selected MS.
Figure 5. Share of inflexible, flexible and vRE energy generation for
Figure 3. Indicator NIS - Negative imbalance share during the highest 1000 selected MS in 2017 (source: own assement with data from [11])
critical hours (source: own assessment with data from [11])
Comparing the shares in Fig. 5 with the two efficiency
It gives evidence, that in 10 member states, the NIS is larger indicators NIS and MSI, provide no answer. The reasons
than zero. This means, that despite the need for up-flexibility explaining the balancing paradox of the NIS and the wide
(ramp-up of power plants) the intraday volume failed to spread of MSI (6% to 163%) seem to be far more complex.
appropriately supply electricity during the top thousand critical Hence, a simple approach with the GS explaining this paradox
hours ݄ା . Thus, the activation of reserve energy was not in the MS seems not feasible.
complementary to the need of flexibility but reacted to the Denmark, with the highest share of ܧܴݒgeneration, does
overshooting of the intraday market. In Belgium, Czech not show any negative imbalance quantities, but quite high MSI
Republic, France and Romania the share is even above 50%, volumes during the highest critical hour scope. Germany, with
meaning that in more than half of the top thousand critical hours the second highest ܧܴݒshare shows lower MSI than Denmark
݄ା the energy supply of the reserve market was opposite to the but a negative reserve share of 17%, meaning that in 17% of the
estimated need for ramp-up power. top 1000 critical hours, the intraday market is overshooting. But
Fig. 4 shows the results of the second efficiency indicator. even though the two MS are characterised by high ܧܴݒshares,
It illustrates that in Poland and Portugal the total balancing their indicators show opposing results.
volume (negative and positive) was even significantly above In contrast, the Netherlands and Austria show a similar
the residual load deviation, while in Spain, Romania and pattern of generation type shares and also both depict small
Sweden activated balancing reserves almost reached the level MSI. However, the Netherlands do not display a NIS value
of the οܴܮ. These results are puzzling as they point to an above zero, while Austria shows a considerably high NIS (31%)
Authorized licensed use limited to: FhI fur System- und Innovationsforschung. Downloaded on February 23,2021 at 10:38:00 UTC from IEEE Xplore. Restrictions apply.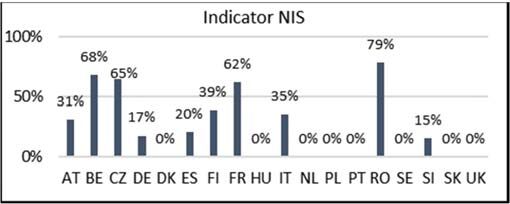
in the investigated critical hours ݄ା . Besides, the United REFERENCES
Kingdom, with similar results of NIS and MSI than the [1] B. Breitschopf and A. Baumann, “Do Variable
Netherlands, depicts significantly higher shares of inflexible
Renewable Energies Endanger the Power System ? - An
power plants.
Approach to Measure Flexibility,” in 2018 15th
The hypothesis that large-scale inflexible power plant International Conference on the European Energy
capacities might lead to imprecise ramp-up power seems Market (EEM), Lodz, 2018, pp. 1–5.
reasonable. But considering the GS of ܧܴݒ, flexible and [2] C. Weber, “Adequate intraday market design to enable
inflexible power plants in Fig. 5, it can be seen, that not all of the integration of wind energy into the European power
the afore mentioned countries with pattern of high inflexible systems,” Energy Policy, vol. 38, no. 7, pp. 3155–3163,
power GS exhibit such a reserve paradox. 2010.
Transparency and full information is a precondition for the [3] P. D. Lund, J. Lindgren, J. Mikkola, and J. Salpakari,
functioning of markets in economics. Therefore, a delayed “Review of energy system flexibility measures to enable
exchange of information within the intraday market, i.e. high levels of variable renewable electricity,” Renewable
between the OTC and stock exchanges, or cross-border flows and Sustainable Energy Reviews, vol. 45, pp. 785–807,
could be another possible reason for the failure of market 2015.
clearing in the intraday market. In addition, the design and [4] G. Papaefthymiou, E. Haesen, and T. Sach, “Power
regulations of intraday markets differ from country to country; System Flexibility Tracker: Indicators to track flexibility
some are rather flexible, allowing for very short-term trade and progress towards high-RES systems,” Renewable
gate closure times while others offer only large time spans and Energy, vol. 127, pp. 1026–1035, 2018.
early gate closure times and thus limit the efficiency of the [5] J. Riesz and M. Milligan, “Designing electricity markets
intraday markets. Finally, regulations regarding the balancing for a high penetration of variable renewables,” WIREs
market such as available capacities, coordination of reserves, Energy Environ, vol. 4, no. 3, pp. 279–289, 2015.
scheduling resolution, incentives of the balancing responsible [6] F. Ocker, S. Braun, and C. Will, “Design of European
party etc., might also play a role for the inappropriate
balancing power markets,” in 2016 13th International
activations.
Conference on the European Energy Market (EEM),
V. CONCLUSION Porto, Portugal, 2016, pp. 1–6.
[7] K. Neuhoff, N. Ritter, A. Salah-Abou-El-Enien, and P.
The developed approach of the intraday market efficiency Vassilopoulos, “Intraday Markets for Power:
measurement enables further insights in the intraday energy Discretizing the Continuous Trading?,” SSRN Journal,
allocation. The results of the year 2017 give evidence, that 2016.
current intraday market mechanism in many MS do not lead to
[8] J. Kiviluoma et al., “Short-Term Energy Balancing With
an efficient energy distribution. It is shown, that activation of
negative balancing power during the highest thousand critical Increasing Levels of Wind Energy,” IEEE Trans.
hours ݄ା was non- complementary to the shortage of energy Sustain. Energy, vol. 3, no. 4, pp. 769–776, 2012.
demand in 10 out of the 18 investigated MS. Further, activated [9] F. Borggrefe and K. Neuhoff, “Balancing and Intraday
reserve power in the highest critical hours ݄ା is relatively high Market Design: Options for Wind Integration,” SSRN
compared to οܴ ܮin some MS, with high variations between 6- Journal, 2011.
163 % among all analysed countries. No correlation can be [10] C. Koch and L. Hirth, “Short-Term Electricity Trading
observed between the generation shares of inflexible, flexible for System Balancing - An Empirical Analysis of the
and ܧܴݒpower plants and the measured intraday market Role of Intraday Trading in Balancing Germany’s
efficiency. Evaluating the intraday exchange and reserve Electricity System,” SSRN Journal, 2018.
market results in France in 2017 prove that the majority of [11] ENTSO-E, “Transparency Platform,” Available at:
trading is done OTC. https://transparency.entsoe.eu/ (Accessed at: 18.
November 2018).
This paper has identified the need for assessing the
efficiency of intraday trading to enable the provision of [12] EPEX SPOT, “Intraday Market,” Available at:
flexibility beyond assessing market rules, liquidity and pricing. http://www.epexspot.com/en/market-
It shows that a large number of intraday markets do not data/intradaycontinuous/intraday-table/-/FR (Accessed
contribute to effective flexibility provision. Further research is at: 18. November 2018).
necessary to detect the reasons for these observations. Possible [13] Commission Regulation (EU) 2017/2195, “Guideline on
explanations include different imbalance price regulations and Electricity Balancing,” Available at: https://eur-
varying incentives for avoiding imbalances as well as available lex.europa.eu/legal-
imports or exports, intraday market rules, bilateral long-term content/GA/TXT/?uri=CELEX:32017R2195 (Accessed
contracts (PPAs), missing information regarding forecast at: 01. Juni 2019).
updates and practise of OTC trading.
Authorized licensed use limited to: FhI fur System- und Innovationsforschung. Downloaded on February 23,2021 at 10:38:00 UTC from IEEE Xplore. Restrictions apply.You can also read