ENVIRONMENTAL PRODUCT DECLARATION - Glass Wool Insulation 4+ In accordance with EN 15804 and ISO 14025 - Isover
←
→
Page content transcription
If your browser does not render page correctly, please read the page content below
ENVIRONMENTAL PRODUCT DECLARATION
In accordance with EN 15804 and ISO 14025
 Glass Wool Insulation 4+
 Date of publication: 2018-06-26
 Valid until: 2021-06-25
 Based on PCR 2014:13 Insulation materials
 Scope of the EPD®: Italia

Registration number
The International EPD® System:
S-P-01138

 1
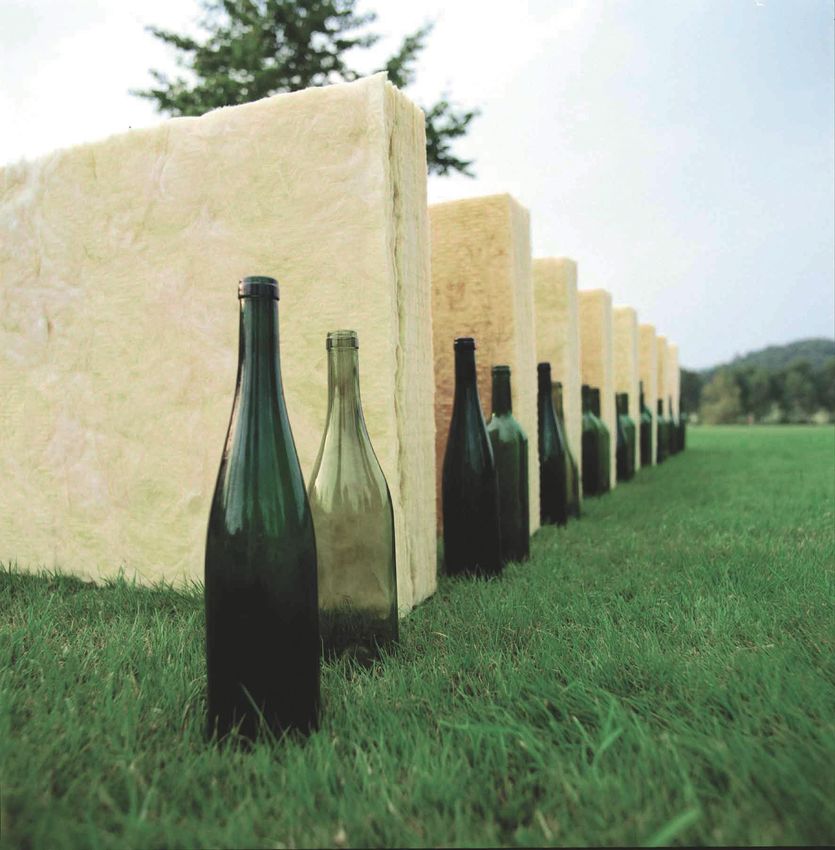
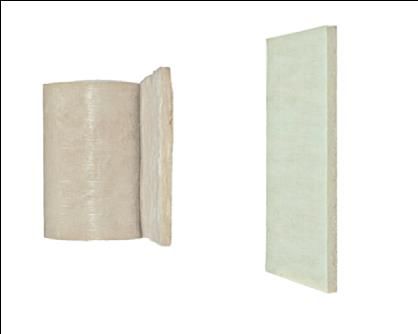
General information
Manufacturer: Saint- Gobain PPC Italia S.p.A.
 ®
Programme used: The International EPD System. More information at www.environdec.com
 ®
EPD registration number: S-P-01138
PCR identification: PCR Multiple CPC codes Insulation materials version 1.2 (2014:13)
Product name and manufacturer represented: Glass Wool type 4+; Saint- Gobain PPC Italia S.p.A.
Owner of the declaration: Saint- Gobain PPC Italia S.p.A.
Company Contact: Email: paola.bonfiglio@saint-gobain.com
 ®
EPD prepared by: Politecnico di Milano, Department DASTU
Contact: Giancarlo Paganin / Monica Lavagna Email: giancarlo.paganin@polimi.it /
monica.lavagna@polimi.it
Declaration issued: 2018-06-26, valid until: 2021-06-25

 ®
EPD program operator The International EPD System. Operated by
 ®
 EPD International AB. www.environdec.com.
PCR review conducted by The Technical Committee of the International
 EPD® System
EPD owner: Saint-Gobain PPC Italia S.p.A.
LCA author: Politecnico di Milano
 Independent verification of the environmental declaration and data according to standard EN
 ISO 14025:2010

 Internal External

Verifier
Vito D’Incognito appointed by the International EPD System Committee

Product description
Product description and description of use:
 ®
This Environmental Product Declaration (EPD ) describes the environmental impacts of 1 m² of
 2 -1
mineral wool with a thermal resistance of 1.0 K*m *W .
 2 -1
The declared unit is therefore the amount of material necessary to achieve 1 m *K*W of thermal
resistance as requested by the applicable PCR.

The production site of Saint- Gobain PPC Italia SpA in Vidalengo di Caravaggio (BG) uses natural and
abundant raw materials (sand) and secondary material (glass cullet), using fusion and fiberizing
techniques to produce glass wool. The products obtained come in the form of a "mineral wool mat"
consisting of a soft, airy structure.

On Earth, naturally, the best insulator is dry immobile air at 20°C: its thermal conductivity factor,
expressed in λ, is 0.025 W/(m.K) (watts per meter Kelvin degree). The thermal conductivity of glass
wool is close to immobile air as its lambda varies from 0.031 W/(m.K) for the most efficient to 0.043
W/(m.K) to the least.

With its entangled structure, glass wool is a porous material that traps the air, making it one of the best
insulating materials. The porous and elastic structure of the wool also absorbs noise in the air, knocks
and offers acoustic correction inside premises. Mineral wool containing incombustible materials does
not fuel fire or propagate flames.

 2

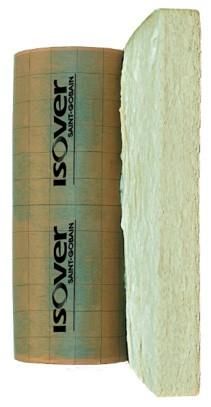
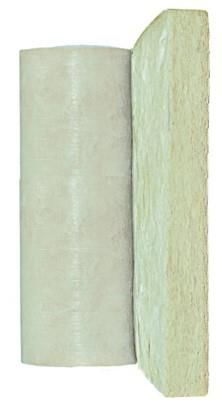
Glass wool insulation (glass wool) is used in buildings as well as industrial facilities. It ensures a high level of comfort, lowers energy costs, minimizes carbon dioxide (CO 2) emissions, prevents heat loss through pitched roofs, walls, floors, pipes and boilers, reduces noise pollution and protects homes and industrial facilities from the risk of fire. Glass wool products last for the average building’s lifetime (which is often set at 50 years as a default), or as long as the insulated building component is part of the building. The glass wool products in this EPD are identified as products belonging to a family called “4+”. This type of glass wool differs from other traditional products for the binder that is used in the manufacturing process; the binder in the 4+ family of products is made mainly of citric acid. In this document the environmental impacts are described for two different configuration of the glass wool 4+: Insulating products without facing (the reference product assumed is “IBR N 4+” with a 3 density of 12 kg/m and a thermal conductivity of 0,039 W/mK); Insulating products with facing normally made up of paper and bitumen (the reference product 3 assumed is “IBR K 4+” with a density of 12 kg/m and a thermal conductivity of 0,039 W/mK). Technical data/physical characteristics -1 Thermal resistance of the Product: 1.0 K.m².W (EN 12667) according to the PCR The thermal conductivity of the Glass wool is: 0,039 W/(m·K) (EN 12667) (for both product with and without facing) Reaction to fire: Euro classes as follows: A1 (products without facing or with glass veil) A2FL-s1 (Isover Ekosol N 4+) F (bituminized/aluminium kraft paper) PRODUCT WITHOUT FACING 3 (nominal values of density = 12 kg/m and thermal conductivity = 0,039 W/mK) 2 Description of the main components and/or materials for 1 m of product without facing with a 2 -1 ® thermal resistance of 1 K.m .W for the calculation of the EPD : PARAMETER VALUE 2 Quantity of wool for 1 m of product 0,468 Kg Thickness of wool 39 mm Surfacing No facing or glass mat Polyethylene Packaging for the transportation and distribution Wood pallet Paper for the label Product used for the Installation None 3

PRODUCT WITH FACING
 3
(nominal values of density = 12 kg/m and thermal conductivity = 0,039 W/mK)
 2
Description of the main components and/or materials for 1 m of product with facing with a
 2 -1 ®
thermal resistance of 1 K.m .W for the calculation of the EPD :

 PARAMETER VALUE
 2
Quantity of wool for 1 m of product 0,468 Kg

Thickness of wool 39 mm
Surfacing Paper, aluminum foil, bitumen

 Polyethylene
Packaging for the transportation and distribution Wood pallet
 Paper for the label

Product used for the Installation None

During the life cycle of the product any hazardous substance listed in the “Candidate List of
 1
Substances of Very High Concern (SVHC) for authorization ” has been used in a percentage higher
than 0,1% of the weight of the product.

The verifier and the program operator do not make any claim nor have any responsibility of the legality
of the product.

1
 http://echa.europa.eu/chem_data/authorisation_process/candidate_list_table_en.asp

 4
LCA calculation information Providing a thermal insulation on 1 m² of product with FUNCTIONAL UNIT 2 -1 a thermal resistance of 1 K.m .W Cradle to Grave: Mandatory stages = A1-3, A4-5, B1- SYSTEM BOUNDARIES 7, C1-4. Optional stage = D not taken into account REFERENCE SERVICE LIFE (RSL) 50 years In the case that there is not enough information, the process energy and materials representing less than 1% of the whole energy and mass used can be excluded (if they do not cause significant impacts). The addition of all the inputs and outputs excluded cannot be bigger than the 5% of the whole mass and energy used, as well of the emissions to environment CUT-OFF RULES occurred. Flows related to human activities such as employee transport are excluded. The construction of plants, production of machines and transportation systems are excluded since the related flows are supposed to be negligible compared to the production of the building product when compared at these systems lifetime level. ALLOCATIONS Allocation criteria are based on mass GEOGRAPHICAL COVERAGE Italia production 2015 AND TIME PERIOD Italia transportation 2015 “EPDs of construction products may be not comparable if they do not comply with EN 15804" “Environmental Product Declarations within the same product category from different programs may not be comparable” . 5
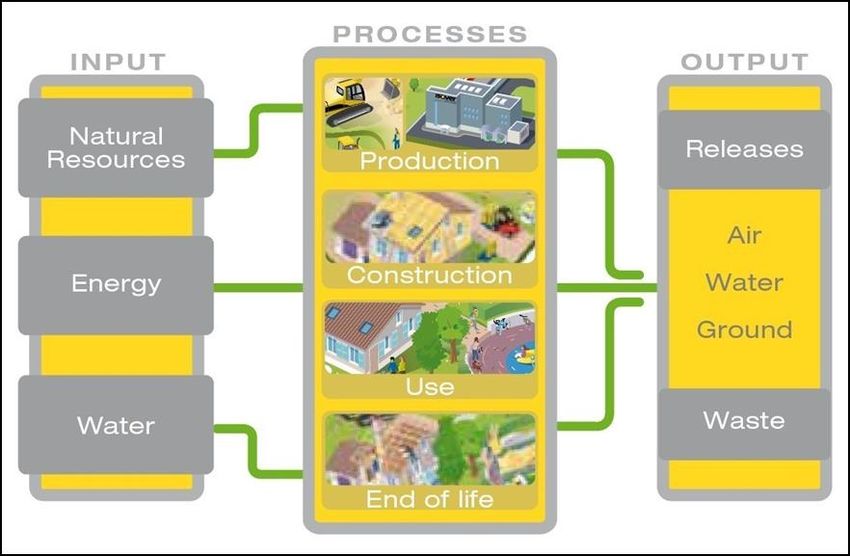
Life cycle stages
Flow diagram of the Life Cycle

Product stage, A1-A3
Description of the stage: the product stage of the glass wool products is subdivided into 3 modules
A1, A2 and A3 respectively “Raw material supply”, “transport” and “manufacturing”.

The aggregation of the modules A1, A2 and A3 is a possibility considered by the EN 15804 standard.
This rule is applied in this EPD.

Description of the scenarios and other additional technical information:

A1, Raw materials supply
This module takes into account the extraction and processing of all raw materials and energy which
occur upstream to the studied manufacturing process.

Specifically, the raw material supply covers production of binder components and sourcing (quarry) of
raw materials for fiber production, e.g. sand and borax for glass wool. Besides these raw materials,
recycled materials (glass cullet) are also used as input.

A2, Transport to the manufacturer
The raw materials are transported to the manufacturing site. In our case, the modeling include: road,
rail and ship transportation (average values) of each raw material.

A3, Manufacturing
This module includes the manufacturing of the product and packaging. Specifically, it covers the
manufacturing of glass, resin, glass wool (including the processes of fusion and fiberizing showed in
the flow diagram), and the packaging.

 6
Manufacturing process flow diagram

Construction process stage, A4-A5
Description of the stage: the construction process is divided into 2 modules: A4, transport to the
building site and A5, installation in the building.

A4, Transport to the building site: this module includes transport from the production gate to the
building site.
Transport is calculated on the basis of a scenario with the parameters described in the following table.

 PARAMETER VALUE/DESCRIPTION
Fuel type and consumption of vehicle or vehicle type Average truck trailer with a 24t payload, diesel
used for transport e.g. long distance truck, boat, etc. consumption 38 liters for 100 km
 Distance 456 km
 Capacity utilisation (including empty returns) 100 % of the capacity in volume
 3
 Bulk density of transported products* 20-100 kg/m
 Volume capacity utilisation factor 1

*Isover products from Vidalengo factory present a compression factor between 4 and 8.

 7
A5, Installation in the building: this module includes:

No additional accessory was taken into account for the implementation phase insulation product.

 PARAMETER VALUE/DESCRIPTION

 Wastage of materials on the building site before
 waste processing, generated by the product’s 5%
 installation (specified by type)
 Distance 25 km to landfill by truck
 Packaging wastes are 100 % collected and modeled
 Output materials (specified by type) as results of
 as recovered matter
 waste processing at the building site e.g. of
 collection for recycling, for energy recovering,
 disposal
 (specified by route)
 Glass wool losses are landfilled

Use stage (excluding potential savings), B1-B7
Description of the stage: the use stage is divided into the following modules:
 - B1: Use
 - B2: Maintenance
 - B3: Repair
 - B4: Replacement
 - B5: Refurbishment
 - B6: Operational energy use
 - B7: Operational water use

Description of the scenarios and additional technical information:
Once installation is complete, no actions or technical operations are required during the use stages
until the end of life stage. Therefore glass wool insulation products have no impact (excluding potential
energy savings) on this stage.

End of Life Stage, C1-C4
Description of the stage: this stage includes the next modules:

C1, Deconstruction, demolition
The de-construction and/or dismantling of insulation products take part of the demolition of the entire
building. In our case, the environmental impact is assumed to be very small and can be neglected.

C2, Transport to waste processing
The model use for the transportation (see A4, transportation to the building site) is applied.

C3, Waste processing for reuse, recovery and/or recycling
The product is considered to be landfilled without reuse, recovery or recycling.

C4, Disposal
The glass wool is assumed to be 100% landfilled.

Description of the scenarios and additional technical information:

End of life:
 PARAMETER VALUE/DESCRIPTION
 The entire product, including any surfacing is collected
 alongside any mixed construction waste
 Collection process specified by type

 8
Recovery system specified by type There is no recovery, recycling or reuse of the product
 once it has reached its end of life phase.
 The product alongside the mixed construction waste
 Disposal specified by type from demolishing will go to landfill

 We assume that the waste going to landfill will be
 Assumptions for scenario development (e.g. transported by truck with 24 tons payload, using diesel
 transportation) as a fuel consuming 38 liters per 100km.
 Distance covered is 25 km

Reuse/recovery/recycling potential, D
Description of the stage: module D has not been taken into account.

LCA results
LCA model, aggregation of data and environmental impact are calculated from the LCA SimaPro 8.3
software together with Ecoinvent 3.3 databases to obtain the inventory of generic data.
The impacts have been assessed with a combination of the following methods: CML-IA baseline v. 4.1
(Global Warming Potential, Ozone Layer Depletion, Acidification, Eutrophication, Abiotic depletion non
fossil, Abiotic depletion fossil), Cumulative Energy Demand V1.09 (Use of renewable primary energy
excluding renewable primary energy resources used as raw materials, Total use of renewable primary
energy resources, Use of non-renewable primary energy excluding non-renewable primary energy
resources used as raw materials, Total use of non-renewable primary energy resources), ReCiPe
Midpoint (H) V1.13 (Photochemical Ozone Creation and Use of net fresh water) and EDIP 2003 V1.06
(Hazardous waste disposed, Non-hazardous waste disposed, Radioactive waste disposed).

Raw materials and energy consumption, as well as transport distances have been taken directly from
the manufacturing plant (Production data according 2015 and transport data according 2015).

In the next pages the environmental impacts for the family 4+ with no facing are listed

 9
TABLE 1.1_ENVIRONMENTAL IMPACTS family 4+ without facing
 Produ
 Construction
 ct Use stage End of life stage

 D Reuse, recovery,
 stage
 stage

 recycling
 B6 Operational

 B7 Operational
 Refurbishment
 A4 Transport

 Replacement
 Maintenance

 Deconstructio
 n / demolition

 C2 Transport
 A1 / A2 / A3

 Installation
 Parameters

 C4 Disposal
 processing
 energy use
 B3 Repair

 water use

 C3 Waste
 B1 Use
 A5

 B2

 B4

 B5

 C1
 7,49 4,39 3,59 1,76 2,26
 0 0 0 0 0 0 0 0 0 MND
 Global Warming Potential E-01 E-02 E-04 E-03 E-03
 (GWP) - kg CO2 equiv/FU The global warming potential of a gas refers to the total contribution to global warming resulting from the emission
 of one unit of that gas relative to one unit of the reference gas, carbon dioxide, which is assigned a value of 1.
 9,88 8,56 8,88 3,43 7,97
 0 0 0 0 0 0 0 0 0 MND
 E-08 E-09 E-11 E-10 E-10
Ozone Depletion (ODP)
 kg CFC 11 equiv/FU Destruction of the stratospheric ozone layer which shields the earth from ultraviolet radiation harmful to life.
 This destruction of ozone is caused by the breakdown of certain chlorine and/or bromine containing compounds (chlorofluorocarbons or halons),
 which break down when they reach the stratosphere and then catalytically destroy ozone molecules.

 4,33 1,76 1,91 7,05 1,79
 0 0 0 0 0 0 0 0 0 MND
Acidification potential (AP) E-03 E-04 E-06 E-06 E-05
 kg SO2 equiv/FU Acid depositions have negative impacts on natural ecosystems and the man-made environment incl, buildings.
 The main sources for emissions of acidifying substances are agriculture and fossil fuel combustion used for electricity production, heating and transport.

 1,38 3,96 4,17 1,59 3,79
Eutrophication potential (EP) 0 0 0 0 0 0 0 0 0 MND
 E-03 E-05 E-07 E-06 E-06
 3
 kg (PO4) - equiv/FU
 Excessive enrichment of waters and continental surfaces with nutrients, and the associated adverse biological effects.

 2,63 2,42 2,62 9,70 2,45
Photochemical ozone 0 0 0 0 0 0 0 0 0 MND
 E-03 E-04 E-06 E-06 E-05
creation (POPC)
 kg Ethene equiv/FU Chemical reactions brought about by the light energy of the sun.
 The reaction of nitrogen oxides with hydrocarbons in the presence of sunlight to form ozone is an example of a photochemical reaction.

 Abiotic depletion potential for
 1,65 1,24 8,26 4,98 2,73
 non-fossil resources (ADP- 0 0 0 0 0 0 0 0 0 MND
 E-06 E-07 E-10 E-09 E-09
 elements) - kg Sb equiv/FU

 1,23 6,76 7,21 2,71 6,66
 Abiotic depletion potential for 0 0 0 0 0 0 0 0 0 MND
 E+01 E-01 E-03 E-02 E-02
 fossil resources (ADP-fossil
 fuels) - MJ/FU Consumption of non-renewable resources, thereby lowering their availability for future generations.

 10
TABLE 1.2_RESOURCE USE family 4+ without facing

 Product Construction
 Use stage End of life stage

 D Reuse, recovery,
 stage process stage

 recycling
 A5 Installation

 Refurbishmen

 Deconstructio
 n / demolition
 A4 Transport

 Replacement

 C2 Transport
 Maintenance

 C4 Disposal
 Parameters

 Operational

 Operational
 A1 / A2 / A3

 processing
 energy use
 B3 Repair

 water use

 C3 Waste
 B1 Use

 B2

 B4

 B5

 B6

 B7

 C1
 t
 Use of renewable primary energy
 excluding renewable primary 3,70 7,42 1,47 3,94 1,78
 0 0 0 0 0 0 0 0 0 MND
 energy resources used as raw E+00 E-01 E-04 E-04 E-03
 materials - MJ/FU

 Use of renewable primary energy
 - - - - - - - - - - - - - - MND
 used as raw materials MJ/FU

 Total use of renewable primary energy
 resources (primary energy and primary 3,70 7,42 1,47 3,94 1,78
 0 0 0 0 0 0 0 0 0 MND
energy resources used as raw materials) E+00 E-01 E-04 E-04 E-03
 MJ/FU

 Use of non-renewable primary
 energy excluding non-renewable 1,34 9,84 7,86 2,97 7,21
 0 0 0 0 0 0 0 0 0 MND
 primary energy resources used as E+01 E-03 E-03 E-02 E-02
 raw materials - MJ/FU
 Use of non-renewable primary
 energy used as raw materials - - - - - - - - - - - - - - MND
 MJ/FU
 Total use of non-renewable primary
 energy resources (primary energy and 1,34 9,84 7,86 2,97 7,21
 0 0 0 0 0 0 0 0 0 MND
 primary energy resources used as raw E+01 E-03 E-03 E-02 E-02
 materials) - MJ/FU
 Use of secondary material 3,53
 0 0 0 0 0 0 0 0 0 0 0 0 0 MND
 kg/FU E-01

 Use of renewable secondary
 - - - - - - - - - - - - - - MND
 fuels- MJ/FU

 Use of non-renewable secondary
 - - - - - - - - - - - - - - MND
 fuels - MJ/FU

 4,75 1,32 4,69 5,28 7,54
 Use of net fresh water - m3/FU 0 0 0 0 0 0 0 0 0 MND
 E-02 E-04 E-06 E-06 E-05

 11
TABLE 1.3_WASTE CATEGORIES family 4+ without facing

 Product Construction
 Use stage End-of-life stage

 D Reuse, recovery,
 stage process stage

 recycling
 Deconstruction
 B6 Operational

 B7 Operational
 Refurbishment
 A5 Installation
 A4 Transport

 Replacement

 C2 Transport
 Maintenance
 Parameters

 C4 Disposal
 / demolition
 A1 / A2 / A3

 processing
 energy use
 B3 Repair

 water use

 C3 Waste
 B1 Use

 B2

 B4

 B5

 C1
Hazardous waste disposed 3,76 4,51 1,50 4,65
 0 0 0 0 0 0 0 0 0 MND
kg/FU 2,45E-05 E-07 E-09 E-08 E-08

Non-hazardous waste disposed 1,03 3,29 2,36 1,32 4,44
 0 0 0 0 0 0 0 0 0 MND
kg/FU E-01 E-02 E-02 E-03 E-01

Radioactive waste disposed 4,90 5,05 1,96 4,50
 3,78 0 0 0 0 0 0 0 0 0 MND
kg/FU E-06 E-08 E-07 E-07
 E-05

 12
TABLE 1.4_OTHER OUTPUT FLOWS family 4+ without facing

 Product Construction
 Use stage End-of-life stage

 D Reuse, recovery,
 stage process stage

 recycling
 B6 Operational

 B7 Operational
 Refurbishment
 A5 Installation

 Deconstructio
 n / demolition
 A4 Transport

 Replacement

 C2 Transport
 Maintenance

 C4 Disposal
 A1 / A2 / A3

 processing
 energy use
 Parameters

 B3 Repair

 water use

 C3 Waste
 B1 Use

 B2

 B4

 B5

 C1
Components for re-use
 0 0 0 0 0 0 0 0 0 0 0 0 0 0 MND
kg/FU

Materials for recycling 3,76
 0 0 0 0 0 0 0 0 0 0 0 0 0 MND
kg/FU E-02

Materials for energy recovery
 - - - - - - - - - - - - - - MND
kg/FU

Exported energy
 - - - - - - - - - - - - - - MND
MJ/FU

 13
TABLE 2.1_ENVIRONMENTAL IMPACTS family 4+ with facing
 Produ
 Construction
 ct Use stage End of life stage

 D Reuse, recovery,
 stage
 stage

 recycling
 B6 Operational

 B7 Operational
 Refurbishment
 A4 Transport

 Replacement
 Maintenance

 Deconstructio
 n / demolition

 C2 Transport
 A1 / A2 / A3

 Installation
 Parameters

 C4 Disposal
 processing
 energy use
 B3 Repair

 water use

 C3 Waste
 B1 Use
 A5

 B2

 B4

 B5

 C1
 7,84 4,39 3,59 1,76 2,26
 0 0 0 0 0 0 0 0 0 MND
 Global Warming Potential E-01 E-02 E-04 E-03 E-03
 (GWP) - kg CO2 equiv/FU The global warming potential of a gas refers to the total contribution to global warming resulting from the emission
 of one unit of that gas relative to one unit of the reference gas, carbon dioxide, which is assigned a value of 1.
 1,16 8,56 8,88 3,43 7,97
 0 0 0 0 0 0 0 0 0 MND
 E-07 E-09 E-11 E-10 E-10
Ozone Depletion (ODP)
 kg CFC 11 equiv/FU Destruction of the stratospheric ozone layer which shields the earth from ultraviolet radiation harmful to life.
 This destruction of ozone is caused by the breakdown of certain chlorine and/or bromine containing compounds (chlorofluorocarbons or halons),
 which break down when they reach the stratosphere and then catalytically destroy ozone molecules.

 4,60 1,76 1,91 7,05 1,79
 0 0 0 0 0 0 0 0 0 MND
Acidification potential (AP) E-03 E-04 E-06 E-06 E-05
 kg SO2 equiv/FU Acid depositions have negative impacts on natural ecosystems and the man-made environment incl, buildings.
 The main sources for emissions of acidifying substances are agriculture and fossil fuel combustion used for electricity production, heating and transport.

 1,45 3,05 4,17 1,59 3,79
Eutrophication potential (EP) 0 0 0 0 0 0 0 0 0 MND
 E-03 E-05 E-07 E-06 E-06
 kg (PO4)3- equiv/FU
 Excessive enrichment of waters and continental surfaces with nutrients, and the associated adverse biological effects.

 2,85 2,42 2,62 9,70 2,45
Photochemical ozone 0 0 0 0 0 0 0 0 0 MND
 E-03 E-04 E-06 E-06 E-05
creation (POPC)
 kg Ethene equiv/FU Chemical reactions brought about by the light energy of the sun.
 The reaction of nitrogen oxides with hydrocarbons in the presence of sunlight to form ozone is an example of a photochemical reaction.

 Abiotic depletion potential for
 1,81 1,24 8,26 4,98 2,73
 non-fossil resources (ADP- 0 0 0 0 0 0 0 0 0 MND
 E-06 E-07 E-10 E-09 E-09
 elements) - kg Sb equiv/FU

 1,39 6,76 7,21 2,71 6,66
 Abiotic depletion potential for 0 0 0 0 0 0 0 0 0 MND
 E+01 E-01 E-03 E-02 E-02
 fossil resources (ADP-fossil
 fuels) - MJ/FU Consumption of non-renewable resources, thereby lowering their availability for future generations.

 14
TABLE 2.2_RESOURCE USE family 4+ with facing

 Product Construction
 Use stage End of life stage

 D Reuse, recovery,
 stage process stage

 recycling
 A5 Installation

 Refurbishmen

 Deconstructio
 n / demolition
 A4 Transport

 Replacement

 C2 Transport
 Maintenance

 C4 Disposal
 Parameters

 Operational

 Operational
 A1 / A2 / A3

 processing
 energy use
 B3 Repair

 water use

 C3 Waste
 B1 Use

 B2

 B4

 B5

 B6

 B7

 C1
 t
 Use of renewable primary energy
 excluding renewable primary 4,04 9,84 1,47 3,94 1,78
 0 0 0 0 0 0 0 0 0 MND
 energy resources used as raw E+00 E-03 E-04 E-04 E-03
 materials - MJ/FU

 Use of renewable primary energy
 - - - - - - - - - - - - - - MND
 used as raw materials MJ/FU

 Total use of renewable primary energy
 resources (primary energy and primary 4,04 9,84 1,47 3,94 1,78
 0 0 0 0 0 0 0 0 0 MND
energy resources used as raw materials) E+00 E-03 E-04 E-04 E-03
 MJ/FU

 Use of non-renewable primary
 energy excluding non-renewable 1,52 7,42 7,86 2,97 7,21
 0 0 0 0 0 0 0 0 0 MND
 primary energy resources used as E+01 E-01 E-03 E-02 E-02
 raw materials - MJ/FU
 Use of non-renewable primary
 energy used as raw materials - - - - - - - - - - - - - - MND
 MJ/FU
 Total use of non-renewable primary
 energy resources (primary energy and 1,52 7,42 7,86 2,97 7,21
 0 0 0 0 0 0 0 0 0 MND
 primary energy resources used as raw E+01 E-01 E-03 E-02 E-02
 materials) - MJ/FU
 Use of secondary material 3,53
 0 0 0 0 0 0 0 0 0 0 0 0 0 MND
 kg/FU E-01

 Use of renewable secondary
 - - - - - - - - - - - - - - MND
 fuels- MJ/FU

 Use of non-renewable secondary
 - - - - - - - - - - - - - - MND
 fuels - MJ/FU

 4,83 1,32 4,69 5,28 7,54
 Use of net fresh water - m3/FU 0 0 0 0 0 0 0 0 0 MND
 E-02 E-04 E-06 E-06 E-05

 15
TABLE 2.3_WASTE CATEGORIES_family 4+ with facing

 Product Construction
 Use stage End-of-life stage

 D Reuse, recovery,
 stage process stage

 recycling
 Deconstruction
 B6 Operational

 B7 Operational
 Refurbishment
 A5 Installation
 A4 Transport

 Replacement

 C2 Transport
 Maintenance
 Parameters

 C4 Disposal
 / demolition
 A1 / A2 / A3

 processing
 energy use
 B3 Repair

 water use

 C3 Waste
 B1 Use

 B2

 B4

 B5

 C1
Hazardous waste disposed 2,57 3,76 4,51 1,50 4,65
 0 0 0 0 0 0 0 0 0 MND
kg/FU E-05 E-07 E-09 E-08 E-08

Non-hazardous waste disposed 1,07 3,29 2,36 1,32 4,44
 0 0 0 0 0 0 0 0 0 MND
kg/FU E-01 E-02 E-02 E-03 E-01

Radioactive waste disposed 4,75 4,90 5,05 1,96 4,50
 0 0 0 0 0 0 0 0 0 MND
kg/FU E-05 E-06 E-08 E-07 E-07

 16
TABLE 2.4_OTHER OUTPUT FLOWS_ family 4+ with facing

 Product Construction
 Use stage End-of-life stage

 D Reuse, recovery,
 stage process stage

 recycling
 B6 Operational

 B7 Operational
 Refurbishment
 A5 Installation

 Deconstructio
 n / demolition
 A4 Transport

 Replacement

 C2 Transport
 Maintenance

 C4 Disposal
 A1 / A2 / A3

 processing
 energy use
 Parameters

 B3 Repair

 water use

 C3 Waste
 B1 Use

 B2

 B4

 B5

 C1
Components for re-use
 0 0 0 0 0 0 0 0 0 0 0 0 0 0 MND
kg/FU

Materials for recycling 3,76
 0 0 0 0 0 0 0 0 0 0 0 0 0 MND
kg/FU E-02

Materials for energy recovery
 - - - - - - - - - - - - - - MND
kg/FU

Exported energy
 - - - - - - - - - - - - - - MND
MJ/FU

 17
LCA interpretation

 18
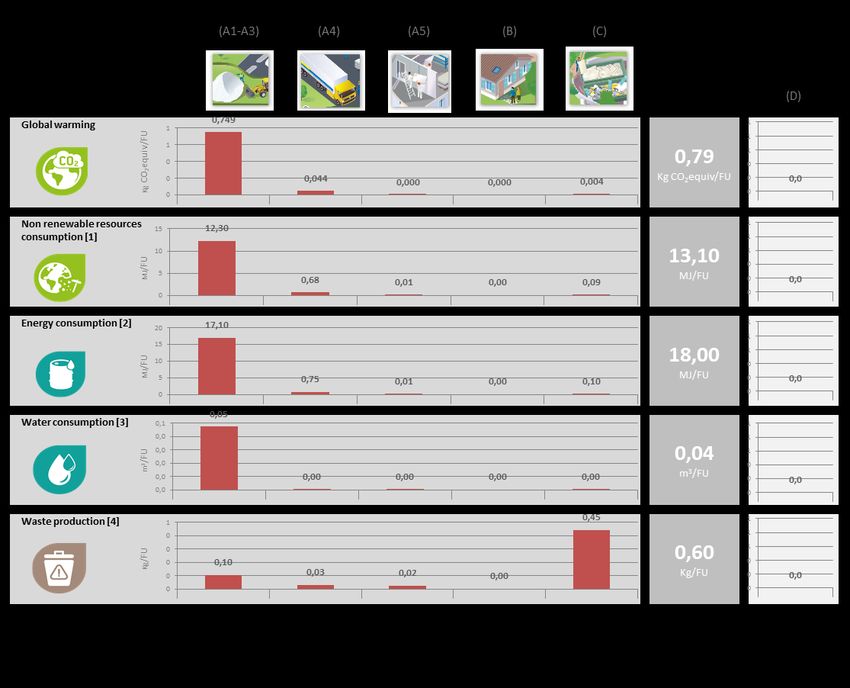
Global Warming Potential (Climate Change) (GWP)
When analyzing the above figure for GWP, it can clearly be seen that the majority of contribution to
this environmental impact is from the production modules (A1 – A3). This is primarily because the
sources of greenhouse gas emissions are predominant in this part of the life cycle. CO 2 is generated
upstream from the production of electricity and is also released on site by the combustion of natural
gas. We can see that other sections of the life cycle also contribute to the GWP; however the
production modules contribute to over 80% of the contribution. Combustion of fuel in transport vehicles
will generate the second highest percentage of greenhouse gas emissions.

Non-renewable resources consumptions
We can see that the consumption of non – renewable resources is once more found to have the
highest value in the production modules. This is because a large quantity of natural gas is consumed
within the factory, and non – renewable fuels such as natural gas and coal are used to generate the
large amount of electricity we use. The contribution to this impact from the other modules is very small
and primarily due to the non – renewable resources consumed during transportation.

Energy Consumptions
As we can see, modules A1 – A3 have the highest contribution to total energy consumption. Energy in
the form of electricity and natural gas is consumed in a vast quantity during the manufacture of glass
mineral wool so we would expect the production modules to contribute the most to this impact
category.

Water Consumption
As we don’t use water in any of the other modules (A4 – A5, B1 – B7, C1 – C4), we can see that there
is no contribution to water consumption. For the production phase, water is used within the
manufacturing facility and therefore we see the highest contribution here. However, we recycle a lot of
the water on site so the contribution is still relatively low.

Waste Production
Waste production does not follow the same trend as the above environmental impacts. The largest
contributor is the end of life module. This is because the entire product is sent to landfill once it
reaches the end of life state. However, there is a still an impact associated with the production module
since we do generate waste on site. The very small impact associated with installation is due to the
loss rate of product during implementation.

Environmental Positive Contribution
Recycled material content
Isover glass wool’s recycled glass content is on the average 75,4%. Recycled glass content
calculation is based on the product weight and calculated according to the ISO 14021:2016 using the
2015 raw material and production data.

Health and safety
Isover glass wool is in accordance with Note Q of the Regulation (EC) n. 1272/2008 of the European
Parliament and of the Council as currently in force and fulfills the Minimal Environmental Criteria as
described in Italian Regulation.

 19
Annex 1: additional information

Influence of particular thicknesses

Products without facing
 ®
This EPD covers - for the glass wool type 4+ without facing – finished
 3
products in the range of density between 9,5 and 85 kg/m and the range of
thicknesses between 15 mm and 200 mm. Therefore for every specific
product (characterized by its density and thickness) a multiplication factor
may be determined in order to obtain its environmental performance starting
from the environmental impacts of the reference product. The reference
product for this family is the product named “IBR N 4+” with a density of 12
 3
kg/m and a thermal conductivity of 0,039 W/mK and the impacts listed in
the following tables (tables 1.1 to 1.4) are determined for the functional unit:
 2
value of R = 1 m .K / W for 39 mm of product with a mass of 0,468 kg.
To determine the impacts associated to a generic product a conversion
factor shall be calculated and the impacts given in this EPD must be
multiplied by the conversion factor.

For a generic product belonging to the family “4+ without facing” the
conversion factor can be determined as follows assuming ρ = density of the
 3
product [kg/m ] under examination and S = product thickness [m].

 CF = 2,136 ∗ ∗
 3
As an example the conversion factor CF for a product with a density = 30 kg/m and a thickness of 40
mm is determined as follows:
CF = 2,136 ∗ 30 ∗ 0,04 = 2,56

To determine for instance the environmental impact “Global Warming Potential (GWP) - kg CO2
equiv/FU” in the stage A5 “installation”, from table 1.1 the value of 3.59 E-04 is taken and multiplied by
2.56 to find the impact of 9.19 E-04 kg CO2 equiv.

Products with facing
 ®
This EPD covers - for the glass wool type 4+ with facing – finished products
 3
in the range of density between 9,5 and 40 kg/m and the range of
thicknesses between 40 mm and 200 mm. Therefore for every specific
product (characterized by its density and thickness) a multiplication factor
may be determined in order to obtain its environmental performance starting
from the environmental impacts of the reference product. The reference
product for this family is the product named “IBR K 4+” with a density of 12
 3
kg/m and a thermal conductivity of 0,039 W/mK and the impacts listed in the
following tables (tables 2.1 to 2.4) are determined for the functional unit:
 2
value of R= 1 m .K / W for 39 mm of product with a mass of 0,468 kg).
To determine the impacts associated to a generic product a conversion factor
shall be calculated and the impacts given in this EPD must be multiplied by
the conversion factor.

For a generic product belonging to the family “4+ with facing” the conversion
factor can be determined as follows assuming ρ = density of the product
 3
[kg/m ] under examination and S = product thickness [m].

 CF = 2,136 ∗ ∗

 20
3 As an example the conversion factor CF for a product with a density = 25 kg/m and a thickness of 100 mm is determined as follows: CF = 2,136 ∗ 25 ∗ 0,1 = 5.34 To determine for instance the environmental impact “Global Warming Potential (GWP) - kg CO2 equiv/FU” in the stage A5 “installation”, from table 2.1 the value of 3.59 E-04 is taken and multiplied by 5.34 to find the impact of 1.91 E-03 kg CO2 equiv. Bibliography ISO 14040:2006: Environmental Management-Life Cycle Assessment-Principles and framework. ISO 14044:2006: Environmental Management-Life Cycle Assessment-Requirements and guidelines. ISO 14025:2006: Environmental labels and declarations-Type III Environmental Declarations- Principles and procedures. PCR Multiple UN CPC codes Insulation materials (2014:13) version 1.2 UNE-EN 15804:2012+A1:2013: Sustainability of construction works - Environmental product declarations - Core rules for the product category of construction products General Programme Instructions for the International EPD® System, version 2.5 Convalida EPD Verificatore: Ing. Vito D’Incognito Accreditato da: Technical Committee of the International EPD System Contatti aziendali: Paola Bonfiglio Supporto tecnico: proff. Giancarlo Paganin e Monica Lavagna (Politecnico di Milano) 21
You can also read