Weather Variability in the Vicinity of Waste Dump-Sites in Benin City
←
→
Page content transcription
If your browser does not render page correctly, please read the page content below
Environmental Management and Sustainable Development
                                                                              ISSN 2164-7682
                                                                           2018, Vol. 7, No. 4

Weather Variability in the Vicinity of Waste Dump-Sites
                                   in Benin City
                                F. Ozabor (Corresponding author)
                      Dept. of Geography and Environmental Management
                    University of Port-Harcourt, P.M.B 5323, Choba, Nigeria
                   Tel: 234-816-931-2952      E-mail: Famphidoz@gmail.com

                                         M. B. T. Kpang
                      Dept. of Geography and Environmental Management
                    University of Port-Harcourt, P.M.B 5323, Choba, Nigeria

Received: July 20, 2018    Accepted: August 10, 2018      Published: September 12, 2018
doi:10.5296/emsd.v7i4.13636          URL: https://doi.org/10.5296/emsd.v7i4.13636

Abstract
This study examines the contribution of dump-sites to weather variability in Benin City. By
utilizing the experimental research design, the researcher collected primary data for waste
volumes, GHGs, and temperature across the study sites for a period of three months. Analysis
of variance (ANOVA) and multiple linear regressions (MLR) were employed for data
analysis. Findings revealed that highly populated areas such as, Iguomo (7.7%), Ekehuan
(7.8%), GRA (6.8%) and New-Benin (9.2%) generated the greater proportion of waste in the
area. The ANOVA analysis showed that temperature is significantly different as distance
increase from dump site at P
Environmental Management and Sustainable Development
                                                                               ISSN 2164-7682
                                                                            2018, Vol. 7, No. 4

because, what is called waste by a group of persons, maybe resource to another (Ozabor &
Obisesan, 2017). Similarly, the ability to manage generated waste is related to the level of
technological advancement, level of orientation of the citizenry and preparedness by both the
government and citizenry to manage waste (Dienye, 2014). Therefore, the developed
countries run parallel to the developing countries when it comes to waste management
(Babayemi & Dauda, 2009; Uwadiegwu & Chukwu, 2013).
In the developed countries waste is easily recycled and converted to other uses, thereby
becoming resources rather than a burden (Ogu, 2000). However in the developing countries
waste management is a huge burden, especially in urban centres. It is a common sight to find
waste along streets and in residential areas. In some cases attempt is made to create
designated waste dumps, however, due to poor dump site management, these waste dumps
rapidly become a menace to the environment where it is located. Some of the implication of
poorly managed waste dumps include, health (Ozabor & Obisesan, 2016; Wokekoro &
Inyang, 2007), city‟s aesthetic depreciation (Atuegbu, 2007; Agbola & Jinadu, 2006), GHGs
emission (Efe et al., 2013).
In Benin City, population was 1.2million in 2006 (NPC, 2006) and with a growth rate of 3.3
the population is projected to reach 1.6milloin by 2017. This population have only seven
designated waste dumps designed to manage generated wastes in the city. These waste dumps
are too few to handle the generated wastes. This assertion quickly manifests in wastes spilling
from the intended land holding to other areas not intended to handle the wastes (O‟Neill,
Landis, Kellar & Lutz, 2001). As a quick fix approach wastes managers‟ incinerate
accumulated waste openly (when weather conditions are favourable) (Sridhar, 2006), and
when weather conditions are not favourable, wastes are left at the dump sites unattended to,
thus the organic materials in the wastes hip ferment openly. Incinerated waste materials in the
wastes hip and fermented organic materials both emit GHGs. These gases therefore create a
greenhouse effect and leading to artificial increase in temperature (Efe, 2002; Aboyade, 2004),
in the vicinities of waste dump-site, thus resulting in a heat island effect (Stewart, 2001).
Some studies have inquired about the health effects of waste dumps (Ozabor & Obaro, 2016;
Yusuf & Oyewunmi, 2008) others have looked at the environmental dangers of poor waste
management (Bogner, Ahmed, Diaz., Faaij, Gas, Hashimoto, Mareckova, Pipatti., & Zhang,
2007; Sánchez-Rodríguez, Seto, Simon, Solecki, Kraas & Laumann, 2005); while Efe et al.,
2013, looked at the GHGs pollution associated with poor waste management in urban centres.
This study is spurred to look at the effects of poor waste management on weather
(Temperature) variability in the vicinity of waste dump sites in Benin City.
2. Materials and Methods
Benin city is located on lat 6°20', 6 60'' N & long 5° 37' 8 „92'' E (see figure 1). The city is
bounded to the north by Uhunmwode LGA, to the south by Ologbo, the east by Orhiomwon
LGA and the west by Ovia south west. It is also the capital city of Edo State and had an
approximate population of 1.2million in 2006 (NPC, 2006), with a growth rate of 3.3 the
population is projected to reach 1.6milloin by 2017. Nevertheless, the area also enjoys the
tropical type of climate with annual temperature of 290C and a rainfall amount that ranges

                                              12                           http://emsd.macrothink.org
Environmental Management and Sustainable Development
ISSN 2164-7682
2018, Vol. 7, No. 4
between 20.4mm to 300mm (Okudibie, 2014). The population rise, poor waste management
practice and the climate have contributed to waste management situation in the city.
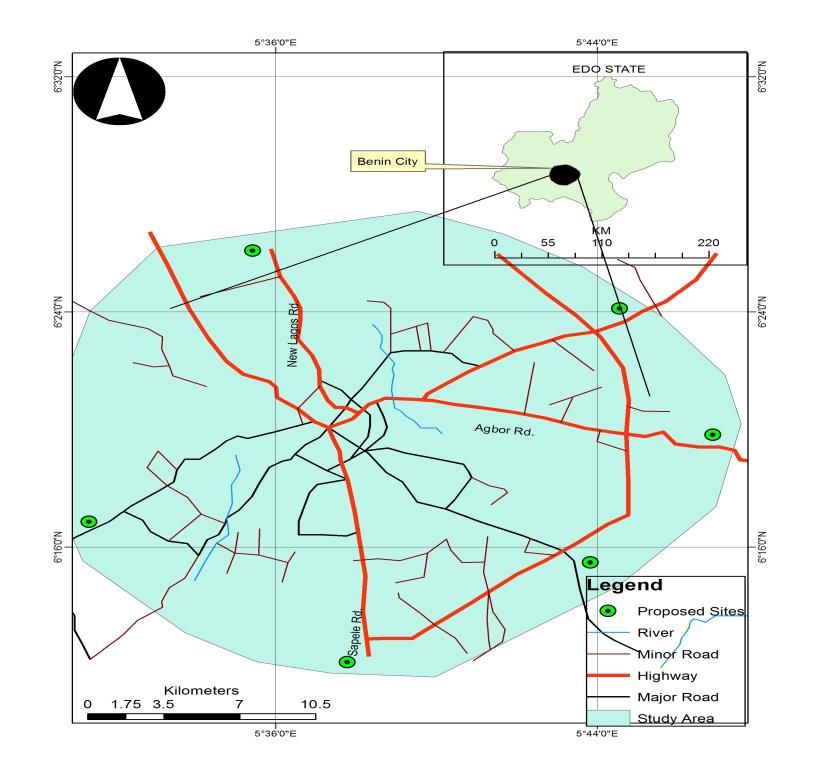
In terms of methods the study adopted the experimental research design. Therefore, the major
waste dumps in the city were identified (see fig 2) and this formed the population for the
study (see table 1).
Table 1. Neighbour hoods in the vicinity of waste dumpsites
Dump site Neighbour hoods
Ugbowo Ekosodi, Uselu, Oluku, Okhoro, Edaiken, Isihor
Sapele-Road Erediawa, Power-Line, Santana-Market, Evbuo-riaria,
PZ-road, Okabere, Evbuo-khun
Iguomo Iguomo, Ikhuen, Depot, Okuahe, By-pass,
Ekehuan Iyaro, Ekehuan, Siloko, Staidium-Road, Oba-Market
Aduwawa/ Aduwawa, Ohovbe, First-Upstairs, Kojo, Urhuora
Ohovbe
Ugbor GRA, First ugbor, Second Ugbor, Ogba, Airport-road
Upper-mission Uteh, Mission road, New Lagos road, Upper-mission,
Ipkoba-slope, new-Benin, MM-way
To be able to measure the waste volume generated at the various dump sites, the quadrant
technique (which involves the separation of dumpsites into quadrants of equal measurements
and in this case 1 by 1 meter) was used (see table 2).
13 http://emsd.macrothink.orgEnvironmental Management and Sustainable Development
ISSN 2164-7682
2018, Vol. 7, No. 4
Figure 2. Benin city Showing waste dump-sites
Table 2. Dump sites, sizes and number of quadrants derived in Benin city
Dump site Length (m) Breadth(M) Area (M2) Derived Quadrants
Ugbowo 54 39 2196 2196
Sapele-Road 66 33.3 2197.8 2197.8
Iguomo 91 66 6006 6006
Ekewhan 45 30 1350 1350
Aduwawa/Ohovbe 78 63 4914 4914
Ugbor 24 27 648 648
Upper-mission 72 57 4104 4104
Thus with the aid of scavengers and a measuring tape, the length and breadth of the
dumpsites were determined. After this, the 1by 1 m quadrants were super-imposed on the
dump sites, hence aiding the scavengers to determine the waste volumes in the dump sites
across the city. It was also paramount to have an idea of waste volume generated at the
neighbourhoods of waste dumpsites for to see if the waste generated were a reflection of the
volume of wastes determined at the waste dumps. This was however determined with the aid
of the waste managers that collected waste at the various residents in the area weekly.
Furthermore multigas detectors were used to generate information about GHGs such as
carbon iv oxide (CO2) Methane gas (CH4), Nitrogen Oxide (NO2), sulphur Oxide (SO2),
Ammonium gas (NH4); at the various dumpsites and at the control point (Upper-sokpan-oba);
both in the morning (6am) and at evening (6pm). This was to help the researcher capture the
daytime and night time variation in GHGs emission at the dumpsite and control.
Furthermore, digital thermometers were used to decipher the mean temperature both at dump
sites and at distances away from the dumpsites using the distance decay technique. As such,
14 http://emsd.macrothink.orgEnvironmental Management and Sustainable Development
ISSN 2164-7682
2018, Vol. 7, No. 4
temperature was measured at dumpsites, 2.5km and 5km from the dumpsite hourly for
3months. In terms of analysis, ANOVA was used to determine the statistical significance in
temperature with distance from the dumpsites, while the MLR was used to determine the
level of dependence of temperature on the GHGs emission in the area.
3. Results and Discussion
Generally in table 3, wastes volume generated are displayed. From the table, upper mission
generated the highest amount of waste in the study period with 43211kg of waste. Iguomo is
the second waste dump with high amount of wastes in the area, with 34105 kg of waste. The
waste dump with the lowest amount of waste in the area is Ugbor (11261.6 kg). Several
factors account for the wastes volumes found at each wastes dump. For example upper
mission dump-site is the closest dump-site to New Benin market, which is arguably the
largest daily market in the city. Secondly, some waste managers prefer to empty their waste
into this dump site for two reasons; a) the community where the waste dump is located is less
hostile and so waste managers can bring in wastes from other areas not intended to empty
their waste in the dump site; b) secondly, the waste dump site is poorly managed as such
individuals can dump their wastes indiscriminately on the dumpsite without any
apprehension.
Table 3. Volumes of waste generated within the study period at identified dump-sites
Waste sites Volume Generated (Kg)
Ugbowo 13175
Sapele-Road 27321
Iguomo 34105
Ekehuan 23664
Aduwawa/Ohovbe 18324
Ugbor 11261.6
Upper-mission 43211
Total 171061.6
Surprisingly, Ugbowo which plays host to the University of Benin and the teaching hospital
(UBTH) and the consequent attraction of high population (residents), generated the lowest
amount of waste (11261.6kg) in the study period. This may be due to the activities of
scavengers who have a camp at the bypass (by oluku). Therefore the scavengers reduce the
waste volumes before they eventually get to the waste dump. This finding is inconsistent with
that of Efe et el., (2013) who emphasized that wastes are usually deposited at the nearest
dumpsites to generation points. It therefore means that the activities of wastes managers and
scavengers may affect the volume of waste in a given waste dump.
Table 4. Waste volume in Neighborhoods within the vicinity of waste-dumps (Kg)
S/N Neigh-Bourhoods Nature of Neigh-bourhood Waste Generated %
1 Ekosodi Residential 1241 1.75
2 Uselu Commercial/residential 2536 3.6
15 http://emsd.macrothink.orgEnvironmental Management and Sustainable Development
ISSN 2164-7682
2018, Vol. 7, No. 4
3 Oluku Residential/commercial 875 1.2
4 Okhoro Residential 653 0.9
5 Edaiken Residential 457.5 0.65
6 Isihor Residential 234 0.3
7 Erediawa Residential 765.5 1.08
8 Power-Line Commercial 234 0.3
9 Santana-Market Commercial 1573 2.2
10 Evbuo-riaria Residential 1265.6 1.79
11 PZ-road Residential 2342 3.3
12 Okabere Residential 743 1.05
13 Evbuo-khun Residential 453 0.6
14 Iguomo Residential 5433 7.7
15 Ikhuen Residential 458 0.7
16 Depot Commercial/residential 1254 1.8
17 Okuahe Residential 235 0.3
18 By-pass Residential 433 0.8
19 Iyaro Commercial/residential 874 1.2
20 Oba-Market Commercial 2875.8 4.1
21 Staidium-Road Residential/commercial 567 0.8
22 Siloko Commercial 753 1.1
23 Ekehuan Residential/commercial 5476.9 7.8
24 Aduwawa Commercial/industrial 3273.5 4.6
25 Ohovbe Residential 2382 3.37
26 First-Upstairs Commercial/residential 2365.4 3.3
27 Kojo Commercial/residential 453.6 0.6
28 Urhuora Residential 1235.5 1.7
29 GRA Residential 4785.7 6.8
30 First ugbor Residential 2336.5 3.3
31 Airport-road Commercial/residential 867.5 1.2
32 Second Ugbor Residential 345.7 0.5
33 Ogba Residential 238.9 0.3
34 Uteh Residential 2365.7 3.4
35 Mission road Commercial 3765.8 5.3
36 New Lagos road Commercial/residential 3455.7 4.9
37 Upper-mission Residential 3211.5 4.6
38 Ikpoba-slope Commercial/residential 785 1.1
39 new-Benin Commercial/residential 6505.1 9.2
40 MM-way Commercial 545.5 0.77
Total 70650.9 100
Nevertheless, in table 4, neighbourhoods located near commercial and high residential areas
generated more volume of waste than the low income earner neighbourhoods. This is evident
in neighbourhoods such as new Benin, with 9.2% of the total waste volume generated in the
16 http://emsd.macrothink.orgEnvironmental Management and Sustainable Development
ISSN 2164-7682
2018, Vol. 7, No. 4
study period. Whereas Ogba which is a low income earner neighbourhood, generated only 0.3%
of the total waste generated. Adducible reasons for this variation include influence of the
markets that scatter around the city, shops located within residential units in the commercial
areas that service population interacting with businesses in the area.
Table 5. Average volume of greenhouse gases (μ/m3) emitted and temperature in the vicinity
of waste-dumps in Benin
Land-use Epoch CO2 CH4 NH4 NO2 SO2 Temp. (0C)
Ekewhuan a.m. 24.19 20.85 19.25 5.85 6.05
p.m. 20.64 18.02 19.06 3.96 4.69 31.5
Ugbowo a.m. 23.69 19.80 19.65 5.62 5.12
p.m. 22.51 18.92 20.01 4.86 4.89 31
Iguomo a.m. 21.69 20.10 17.74 5.70 5.82
p.m. 21.04 19.02 18.05 4.98 5.09 29.5
Medium a.m. 22.19 19.89 19.92 4.57 4.63
Density residential p.m. 21.54 19.12 20.06 4.01 4.01 29.8
Upper a.m. 24.91 20.17 20.94 5.34 6.08 31.5
mission p.m. 23.82 19.31 21.06 5.08 5.89
Aduwawa/ a.m. 21.36 19.05 18.69 4.92 5.22
Ohovbe p.m. 20.94 18.85 19.25 4.58 4.99 30.5
Ugbor Am 21.36 19.05 18.69 4.92 5.22 30.5
Pm 20.94 18.85 19.25 4.58 4.99
Control a.m. 14.02 12.72 11.64 3.03 4.35
p.m. 14.75 13.28 12.08 2.89 3.89 27.8
In table 5, the average amounts of GHGs as well as the temperature reached are shown. In the
table temperature characteristics reflect the volume of GHGs attained. Secondly, GHGs
emissions in the morning are higher than that, emitted in the evening, the reason being that,
waste incineration at dumpsite takes place at nights also; atmospheric conditions are more
stable at nights than in the daytime. Due to the fact that, winds and other anthropogenic
activities displace GHGs from emission sources to other areas (Edokpa, 2017).
Table 6. Ambient temperatures at the waste dumps and distance away from dump-sites in
Benin
Land use Temp. at D-site (0C) Temp. (0C) 2.5km Temp. (0C) 5km
Ekewhuan 31.5 31 30
Ugbowo 31 30.5 30.5
Sapale-road 29.8 29.5 29
Iguomo 29.5 29.5 29
Upper mission 31.5 31 31
Aduwawa/Ohovbe 30.5 30 30
Ugbor 30.5 30.1 29.7
Control 27.8 27.8 27.8
17 http://emsd.macrothink.orgEnvironmental Management and Sustainable Development
ISSN 2164-7682
2018, Vol. 7, No. 4
However, the high concentration of GHGs at dumpsites is attributed to fermentation of
wastes materials, decomposition of organic material within the waste constituents, and waste
incineration at dumpsites. This finding disagrees with the findings of Efe et al.,(2013); Yusuf
&Oyewunmi, (2008) & O‟Neil et al (2001), who attributed volume of GHGs at waste dumps
to anthropogenic activities, population growth and industrial processes. Nevertheless, the
emitted gases have effect on temperature variability in the area. This assertion is glaring in
table 6, where temperature reduces as one moves away from the dumpsites. For example, in
Ekewhuan, at 5km from the dumpsite a temperature gain of 1.50C is recorded. At sapele road
0.80C is recorded at 5km from the dumpsite. The same can be said of other dumpsites in the
area, thereby revealing that, the GHGs are responsible for the temperature variation in the
vicinity of waste dumps as compared with distance away from dumpsites (Sridhar, 2006).
Table 7. Temperature variation with distance from dump site
ANOVA
Temperature
Sum of Squares Df Mean Square F
Between Groups 1396.922 3 798.974 26.307
Within Groups 16005.888 87 43.380
Total 17402.81 90
Table 8. Duncan analysis of temperature variation with distance from dump site
Temperature variation with distance
Duncana
Identifiers N Subset for alpha = 0.05
1 2 3
5km 90 29.0811
2.5km 90 30.2501
Vicinity of D site 90 30.6333
Sig. 1.000 1.000 1.000
Means for groups in homogeneous subsets are displayed.
a. Uses Harmonic Mean Sample Size = 10950.000.
This assertion is found to be statistically, significant at pEnvironmental Management and Sustainable Development
ISSN 2164-7682
2018, Vol. 7, No. 4
The regressions analysis further confirms that temperature behaviour at dumpsite
significantly depends, on GHGs at pEnvironmental Management and Sustainable Development
ISSN 2164-7682
2018, Vol. 7, No. 4
through waste thereby reducing GHGs emissions (Ozabor & Obisesan, 2017). Finally, the
state government should establish a waste management framework; which will include waste
policing, licensing and training abundance of & affordable waste management vendors, and a
periodic orientation of locals on the need to align with the waste management plan of the
state. If these steps are followed practically, wastes effects on weather variability in Benin
City will be minimized.
References
Aboyade, A. (2004). The Potential for Climate Change Mitigation in Nigeria Solid Waste
Disposal Sector: A Case Study of Lagos. An Unpublished MSc Dissertation, Department of
Environmental Strategy, Lund University.
Agbola, T., & Jinadu, A. M. (2006). Community Reactions and Environmental Impact
Assessment of a Landfill Site in an Indigenous African City. In: T. Agbola, Ed.,
Environmental Planning and Management: Concepts and application to Nigeria. Ibadan
Constellation Books, Ibadan, 2006, pp. 114-145.
Ajie, U. E., & Dienye, A. (2014). Spatial Data Analysis of Solid Waste Management System
in Port Harcourt Metropolis after 100 years of its Existence. FIG Congress 2014 Engaging
the Challenges – Enhancing the Relevance. Kuala Lumpur, Malaysia 16-21 June 2014
Babayemi, J. O., & Dauda, K. T. (2009). Evaluation of Solid Waste Generation, Categories
and Disposal Options in Developing Countries: a case Study of Nigeria. Journal of Applied
Science Environmental Management, 13(3), 83-88.
Bogner, J. M., Ahmed, A., Diaz., C., Faaij, A., Gas, O., Hashimoto, S., Mareckova, K.,
Pipatti., R., & Zhang, T. (2007). Waste Management. In: B. Metz, O. R. Davidson, P. R.
Boseh, R. Dave and L. A. Meyer, Eds., Climate Change 2007: Mitigation Contribution of
Working, 2007.
Edokpa, O. D. (2017). Atmospheric stability conditions in the lower troposphere in selected
cities of Nigeria. A PhD thesis submitted to the department of Geography and Environmental
Management, University of Port-Harcourt, Nigeria
Efe, S. I. (2002). Urban Warming in Nigeria Cities: The Case of Warri Metropolis. African
Journal of Environmental Studies, 3(1-2), 160-168.
Efe., S. I., Cheke., L. A., & Ojoh., C. O. (2013). Effects of Solid Waste on Urban Warming in
Warri Metropolis, Nigeria. Journal of Atmospheric and Climate Sciences, 3, 6-12.
https://doi.org/10.4236/acs.2013.34A002
O‟Neill, B., Landis, C. F., Kellar, M., & Lutz, W. (2001). Population and Climate Change.
Cambridge University Press, London.
Ogu, V. I. (2000). Private Sector Participation and Municipal Waste Management in Benin
City, Nigeria. Environment and Urbanization, 12(2), 103-117.
https://doi.org/10.1177/095624780001200209
20 http://emsd.macrothink.orgEnvironmental Management and Sustainable Development
ISSN 2164-7682
2018, Vol. 7, No. 4
Ozabor, F., & Obaro, H. N. (2016). Health effects of poor waste management in Nigeria: a
case study of Abraka in Delta State. Int. J. Environment and Waste Management, 18(3),
195-204. https://doi.org/10.1504/IJEWM.2016.080790
Ozabor & Obisesan (2017). the role of government and private partnership in eradicating
street waste dumps in Port Harcourt. Paper presented at the 58th Association of Nigerian
Geographers Conference, held in Nasarawa State, Nigeria.
Wokekoro, E., & Inyang, M. P. (2007). Waste Disposal in Low-Income Neighbourhoods and
Its Impact on Health: The Case of Port Harcourt, Nigeria. International Conference “Waste
Management, Environmental Geotechnology and Global Sustainable Development
(ICWMEGGSD'07 - GzO'07)” Ljubljana, SLOVENIA, August 28-30.
Sánchez-Rodríguez, R., Seto, K., Simon, D., Solecki, W., Kraas., F., & Laumann, G. (2005).
Science Plan: Urbanization and Global Environmental Change IHDP Report 15 International
Huma Dimensions Programme on Global Environmental Change, Bonn,” 2005.
http://www.ihdp.org http://www.ugec.org
Sridhar, M. K. C. (2006). From Urban Wastes to Sustainable Waste Management in Nigeria:
A Case Study. In: F. A. Matt, A. Ivbijaro, F. Akintola and R. U. Okechukwu, Eds., Sustainable
Environmental Management in Nigeria, Chapter 20, Mattivi Productions, Ibadan, 2006, pp.
337- 353.
Stewart, I. D. (2001). Influence of Meteorological Conditions on the Intensity and Form of
the Urban Heat Island Effect in Regina. Canadian Geographer-Geographe Canadien, 44(3),
71-285. http://dx.doi.org/10.1111/j.15410064.2000.tb00709.x
Yusuf, R. O., & Oyewunmi, M. O. (2008). Qualitative Assessment of Methane Generation
Potential from Municipal Solid Wastes: A Case Study. Environmental Research Journal, 2(4),
138-144.
Copyright Disclaimer
Copyright for this article is retained by the author(s), with first publication rights granted to
the journal.
This is an open-access article distributed under the terms and conditions of the Creative
Commons Attribution license (http://creativecommons.org/licenses/by/3.0/).
21 http://emsd.macrothink.orgYou can also read