Nairobi Metropolitan Area Commercial Office Report - 2020 "Supply-Driven Market"
←
→
Page content transcription
If your browser does not render page correctly, please read the page content below
Nairobi Metropolitan Area Commercial Office Report – 2020
                  “Supply-Driven Market”

                                              Date: April 26th, 2020
Table of Contents
I Overview of Real Estate in Kenya
II NMA Commercial Office Report 2020
A Introduction
B Commercial Office Supply in Nairobi
Commercial Office Market
C
Performance
D Office Space Opportunity
Office Market Conclusion and
E Outlook
www.cytonn.com 2I. Overview of Real Estate in Kenya
Introduction to Real Estate in Kenya
Real estate has consistently outperformed other asset classes in the last 5 years, generating returns of
on average 20.1% p.a
Factor                                                                 Characteristics
                      • In 2019, the real estate sector grew by 4.8% on average from Q1’2019 to Q3’2019, 0.3% points higher than the
                        growth rate recorded over the same period in 2018, according to Kenya National Bureau of Statistics (KNBS)
Macro-economic          Quarterly Gross Domestic Product Report Q3'2019
Contribution          • The growth was attributed to an improving macroeconomic environment in 2018 and 2019, with the country’s
                        GDP growing by 6.3% in 2018, 1.4% points higher than the 4.9% recorded in 2017 and expected to come in at
                        6.0% and 6.1% in 2019 and 2020, respectively as per the World Bank
                      • Real estate has consistently outperformed other asset classes in the last 5 years, generating returns of on
High Returns            average 20.1% p.a., compared to an average of 8.7% p.a. in the traditional asset classes
                      • In Q1’2020, the sector recorded rental yields of 7.8%, 7.7%, 7.6%, 7.3% and 5.2% in commercial office, retail,
                        MUDs, serviced apartments, and residential sectors, respectively
                      • Opening of business offices by multinational corporations: Cigna, a global health service company, MAC
                        Mobile, a FMCG technology solutions company, and Mauritius Commercial Bank (MCB) Group at the UNON
Recent Developments     Complex in Gigiri, 3 Mzima Springs Road in Kileleshwa and Pramukh towers in Westlands, respectively
                      • Other notable buildings completed in 2019 include: The Arch Place in Kilimani (120,000 SQFT), 19 Kabasarian
                        Avenue (76,600 SQFT) in Lavington, The Address (243,000 SQFT) and Laxcon Plaza (100,000 SQFT) in Westlands
                      • Our outlook for the sector is neutral as Coronavirus pandemic takes its toll on sectors such as hospitality and
                        retail and the economic growth in general. Additionally, the sector also continues to be constrained by limited
                        access to financing for both developers and off takers. However, we expect the market to be cushioned by the
Market Outlook          constant housing deficit, infrastructural development, and government efforts to improve processes in the built
                        environment in a bid to improve Kenya’s ease of doing business
                      • The real estate sector has pockets of value especially housing for lower-middle to low-income earners in the
                        residential sector, serviced apartments, and Mixed-Use Developments (MUDs)

                                                         www.cytonn.com                                                         4
Real Estate in Kenya –Contribution to GDP
Real Estate and construction sectors contribution to GDP increased by 0.9% points to 12.2% in Q3’2019
from 11.3% in Q’1 2019
2010 2018 Q1’2019 Q3’2019
24.8 34.2 40.2 36.5
Agriculture
% % % %
11.3 7.7 7.5 7.7
Manufacturing
% % % %
Wholesale & 7.7 7.4 6.3 6.8
Retail Trade % % % %
Hospitality & 1.7 1.3 0.7 0.5
Tourism % % % %
Real Estate & 12.8 12.4 11.3 12.2
Construction % % % %
Source: KNBS
www.cytonn.com 5II. Nairobi Metropolitan Area Commercial
Office ReportA. Introduction
Executive Summary
The Commercial Office sector’s performance softened recording a 0.7% points decline in rental yields
• We carried out a research on the commercial office theme in Nairobi. The report aims to inform on the supply and performance of
  the commercial office sector in Nairobi in 2019

• In 2019, 1.5 mn SQFT of office space was delivered in Nairobi with an average occupancy level of 80.5%

• This resulted in a supply of 6.7 mn SQFT against a demand of 0.3 mn SQFT and thus an oversupply of 6.3 mn SQFT. The
  oversupply was 21.6% higher than in 2018 at 5.2 mn SQFT. Assuming current occupancy levels persist, we expect a 1.9% increase
  in oversupply to 6.5 mn SQFT in 2020

• The sector’s overall performance softened recording a 0.7% points decline in average rental yields to 7.7% in 2019 from 8.3% in
  2018. Occupancy rates declined by 3.3%-points to 80.5% in 2019, from 83.8%, in 2018

• In the submarket analysis, Gigiri, Karen and Westlands were the best performers in 2019 recording rental yields of 9.2%, 8.3%,
  and 8.3%, respectively, while Thika Road and Mombasa Road were the worst performers recording rental yields of 6.3% and 5.5%,
  respectively

• Grade B office spaces recorded the highest rental yields at 7.9% compared to Grade A and Grade C rental yields of 7.4% and 7.2%,
  respectively. Grade B offices were the most common in the market with a market share of 52.1%

• We have a negative outlook for investments in the commercial office market in 2020, due to the oversupply of office space and the
  uncertainty brought about by the novel Coronavirus Investments in the sector should, therefore, be aimed towards long-term gains
  when the market picks up

• Pockets of value in the sector exist in in zones with low supply and high returns such as Gigiri and in differentiated concepts such as
  MUDs and serviced offices recording rental yields of up to 7.9% and 12.3%, respectively, to boost returns

                                                              www.cytonn.com                                                          8
NMA Commercial Office Report – “Spurring Sectoral Growth”
The opportunity lies in differentiated concepts in differentiated concepts such as MUDs and
serviced offices recording rental yields of up to 7.9% and 12.3%, respectively
Value Area Summary Effect on The Office Market
• In 2019, the market had a supply of 6.7 mn SQFT against a • Asking rents declined by 4.3% to an average of Kshs 97 per
demand of 0.3 mn SQFT resulting in an oversupply of 6.3 mn SQFT from Kshs 101 per SQFT in 2018.
Oversupply SQFT. We expect the oversupply to increase by 1.9% to 6.5 mn
SQFT in 2020
• Rental yields and occupancy rates declined by 0.7% points and
3.3% points, respectively to 7.7% and 80.5% in 2019 from 8.3% • The yields were less attractive at 7.7% compared to sector
and 83.8%, respectively in 2018 due to the reduced demand average at 8.9%
attributed to minimal private sector growth • The current oversupply is expected constrain performance
Returns
• The best performing nodes in the office sector were Gigiri, Karen further with yields expected to soften
and Westlands with rental yields of 9.2%, 8.3 and 8.3%,
respectively, with Thika Road and Mombasa Road having the
lowest yields at 6.3% and 5.5%, respectively
• We have a negative outlook for the commercial office theme in• A slowdown in building approvals and construction activities
the Nairobi Metropolitan Area (NMA) given the increased office allowing the existing demand to absorb the current supply
space supply and expected stagnation in performance in 2020
Opportunity & depending on how fast the Coronavirus is contained.
Outlook • Investments should be made in zones with low supply and high
returns such as Gigiri and in differentiated concepts such as
MUDs and serviced offices recording rental yields of up to 7.9%
and 12.3%, respectively
The opportunity lies in in differentiated concepts such as MUDs and serviced offices recording rental yields of up to
7.9% and 12.3%, respectively
www.cytonn.com 9Key Factors Driving Office Market in Kenya
Nairobi as a Regional Hub, Devolution, and growth of SMEs are some of the factors driving the Office
Market
Factor Characteristics
• Kenya’s ranking in the World Bank Ease of doing Business Report, has improved over time, improving by 19
positions to #61 in 2019, from #80 in 2018, and to #56 in 2020. The continued rise in ranking is attributed to
continued strengthening of access to credit, protection of minority investors and ease of paying taxes by
Kenya’s Growing Presence as a merging all permits into a single unified business permit
Regional Hub
• In 2020, Nairobi was ranked #4 in JLL’s City Momentum Index, as world’s most dynamic city economies
attributable to favourable demographics, infrastructure investment, technology, tourism and retail. This was
up 2 positions from #6 in 2019 and is set to attract foreign direct investments
• Demand for office spaces has persistently increased over time due to the entry of multinational
corporations, therefore leading to increased development of commercial office spaces
Increased Entry of Multinational
• Some of the multinational corporations that opened regional offices in 2019 include: Cigna, a global health
Corporations
service company, MAC Mobile, a FMCG technology solutions company, Mauritius Commercial Bank (MCB)
Group and Abbott, a US-based healthcare company at the UNON Complex in Gigiri, 3 Mzima Springs Road in
Kileleshwa, Pramukh towers in Westlands, and Watermark Business Park in Karen, respectively
• SMEs contributed to approximately 45% of Kenya’s GDP, 80% of employment in Kenya and constituted 98%
Growth of Small and Medium Sized
of businesses locally according to a CNBC News Report 2014 and are thus a key driver for the commercial
Enterprises (SMEs)
office sector.
www.cytonn.com 10Challenges Affecting Office Sector
Office space oversupply stood at 6.3 mn SQFT in 2019
Factor Characteristics
Competition
• There was insufficient access to financing with private sector credit growth coming in at 7.1% in
December 2019 compared to a 5-year (2013-2018) average of 14.0%.
Accessibility to Finance
• Lack of proper funding for developments resulted in the use of expensive debts in the funding structure
that affected the supply of office spaces due to its capital intensive nature
Accessibility
• Office space oversupply stood at 6.3 mn SQFT in 2019, which has created a bargaining chip for tenants
to Finance
Oversupply forcing developers to reduce or maintain prices and rents in order to remain competitive and attract
occupants to their office spaces
Delay in the Processing of Construction • Delays in the processing of construction permits by some county governments such as Nairobi and Kiambu,
Infrastructure
Permits affected developers by prolonging project implementation timelines.
• The rate of real estate development and increased commercial activity has by far exceeded the rate of
Insufficient Infrastructure infrastructural improvement causing strains on the trunk infrastructure driving up real estate development
costs as developers resort to financing any infrastructural inadequacies
• Real GDP grew by an estimated 5.9% in 2019, driven by household consumption and investment on the
demand side and services on the supply side (such as public administration, information technology,
Economic Slowdown finance and insurance, and transport and storage)
• GDP was down from 6.5% in 2018, caused mainly by unfavourable weather and reduced government
investment
www.cytonn.com
11 11Highlights in the Commercial Office Sector - 2019
In 2019, I&M Bank relocated their head office from the Nairobi CBD to Parklands
Highlight Details
Competition • The market saw the opening of a number of office buildings including: The Arch Place in Kilimani (120,000
SQFT), 19 Kabasarian Avenue (76,600 SQFT) in Lavington, The Address (243,000 SQFT) and Laxcon Plaza
(100,000 SQFT) both in Westlands; Merchant square (165,000 SQFT), Capital Square (101,000 SQFT) and
Park Medical Centre in Parklands
• Garden City, a mixed-use development on Thika Road opened their office development, dubbed ‘The
New Developments Garden City Business Park’ with a total lettable space of approximately 134,000 SQFT
Accessibility
to Finance • The market also witnessed the construction of more office blocks such as Kenya Institute of Supplies
Management(KISM) Headquarters on Ngong Road which was completed during the review period. The 17-
story development sits on half an acre of land comprises 105,000 SQFT of high quality office space, 148 car
park bays
Infrastructure • I&M Bank relocated their head office from the Nairobi CBD to 1 Park Avenue building located in
Parklands and has a total lettable space of approximately 163,000 SQFT spread across eight floors
Business Relocations • East African Breweries Limited (EABL), a local alcoholic beverages manufacturer, relocated from its
Ruaraka offices to the Garden City business park
www.cytonn.com
12 12B. Commercial Office Supply in Nairobi
Commercial Office Space Supply-Nairobi
Total office stock in Nairobi increased by approximately 1.5 mn SQFT in 2019
                                       Commercial Office Completions ( Mn SQFT)
  9.0
                                               7.8
  8.0
  7.0                                                    6.5
                                      5.9
  6.0
  5.0                                                                     4.3
  4.0                                                            3.5
  3.0                        2.1
  2.0                1.2                                                           1.5      1.4      1.3      1.3
  1.0
   -
          2011      2012    2013     2014      2015     2016     2017    2018     2019     2020F    2021F    2022F
• The total office completions in Nairobi increased by approximately 1.5 mn SQFT in 2019, 65.1% lower than 4.3 mn
  SQFT in 2018, due to delay in issuance of approvals by the Nairobi County Government and a slowdown in
  construction activities

• Office space supply has grown at 7-year CAGR of 24.7% to 36.3 mn SQFT in 2019 from 7.7 mn SQFT in 2012 driven
  by the positioning of Nairobi as a regional hub, thus increased entrance of multinationals as well as the growth of
  Small and Medium Enterprises (SMEs)

• Over the next few years we expect reduced rate of supply to a 2-year CAGR of 6.9% attributed to a market
  correction as the forces of demand and supply come into play
  Source: Nairobi Building Approvals Data from Nairobi City

                                                       www.cytonn.com                                                   14
Commercial Office Space Supply – Nairobi Continued…
Upperhill, CBD and Westlands had the largest supply, with market shares of 18.0%, 17.9% and 17.6%,
respectively
Nairobi Metropolitan Area Office • In 2019, the CBD, Upperhill and Westlands had the
Supply 2019
largest supply of office space in Nairobi with market
Thika
Parklands shares of 18.0%, 17.9% and 17.6%, respectively, while
1% Gigiri
8%
1% Gigiri and Thika Road had the lowest supply with a
Karen Upperhill market share of 1.0% and 0.6%, respectively
7% 18%
• Westlands and Kilimani have grown as business nodes
as firms move away from the CBD and Upperhill due to
traffic congestion and in search of better quality space,
CBD hence the high supply
18%
Source: Cytonn Research
Kilimani
16%
Mombasa Westlands
Rd 17%
14%
www.cytonn.com 15C. Commercial Office Market Performance
Commercial Office Market Performance Summary
The commercial office sector performance softened in 2019 recording 0.7% points and 3.3% points y/y
decline in average rental yields and occupancy rates
Year                   2013          2015         2016          2017        2018*           2019    y/y ∆ 2018      y/y ∆ 2019

Occupancy (%)         90.0%         89.0%        88.0%         82.6%        83.8%          80.5%    1.2% points   (3.3%) points
Asking Rents
(Kshs/SQFT)             95.0         97.0          97.0        101.0         101.4           97.2         0.4%          (4.1%)
Average Prices
(Kshs/SQFT)           12,433       12,776        12,031       12,649       12,407         12,552         (1.9%)           1.2%
Average Rental
Yields (%)             8.3%          8.1%         8.5%          7.9%         8.3%           7.7%    0.4% points   (0.7%) points
*Average rental yields for 2018 restated to include additional 2018 office completions
• The commercial office sector performance softened in 2019 recording a 0.7% points decline in average rental yields to
  7.7% in 2019 from 8.3% in 2018. Occupancy rates declined by 3.3% points to 80.5% in 2019, from 83.8%, in 2018
• Asking rents and prices declined by 4.3% and 1.2%, respectively to an average of Kshs 97.2 and Kshs 12,552 per SQFT in
  2019 from per SQFT from Kshs 103.0 and Kshs 12,719 per SQFT in 2018. The subdued performance was largely driven by:
       • An introduction of 1.5 mn SQFT office space to the market resulting to an oversupply of 6.3 mn SQFT which has
         created a bargaining chip for potential tenants, forcing developers and landlords to reduce or maintain prices and
         rents in order to remain competitive and attract occupants to their office spaces, and,
       • A decline in uptake of office space attributed to minimal growth in private sector credit, leading to downsizing or
         business closures, especially for small and medium-sized enterprises (SMEs)
Source: Cytonn Research 2019

                                                          www.cytonn.com                                                  17
i. Performance by Nodes
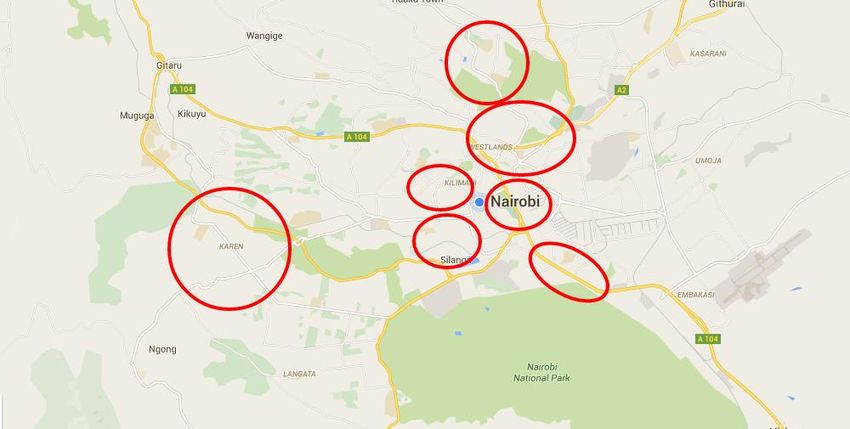
Major Commercial Office Nodes in the Nairobi Metropolitan Area
The key nodes of focus are in Karen, Kilimani, Westlands, Msa Rd, Nairobi CBD, Parklands, Thika Road and
Gigiri

                                                          7                  8

                                                              6
                                                    2         5
                           1                        3
                                                                   4

 Key: 1. Karen 2. Kilimani 3. Upper Hill 4. Mombasa Road 5. CBD 6. Westlands & Parklands 7. Gigiri 8.
 Thika Road

                                             www.cytonn.com                                        19
Nairobi Office Sub-Market Performance
Gigiri, Karen and Westlands were the best performers in 2019 recording rental yields of 9.2%, 8.3%, and
8.3%, respectively,
∆
Price Rent Rental Price Rent Occupan Rental ∆ Rental
Occupan
Kshs/ Kshs/ Occupancy Yield Kshs/ Kshs/S cy Yield ∆ Rent Yields Y
Nodes cy Y/Y
SQFT SQFT 2019(%) (%) SQFT QFT 2018(% (%) Y/Y /Y (%
(%
2019 2019 2019 2018 2018 ) 2018 points)
points)
Gigiri 13,833 117 80.4% 9.2% 13,833 123 85.0% 10.0% (5.1%) (4.6%) (0.8%)
Karen 13,665 111 85.3% 8.3% 13,666 118 88.6% 9.2% (6.5%) (3.2%) (0.9%)
Westlands 12,370 104 80.3% 8.3% 12,050 110 82.1% 9.0% (5.2%) (1.8%) (0.7%)
Parklands 12,369 97 83.1% 8.2% 12,494 102 86.0% 8.4% (4.8%) (2.9%) (0.2%)
UpperHill 12,397 98 80.0% 7.5% 12,560 100 84.0% 8.2% (1.3%) (4.0%) (0.7%)
Kilimani 12,680 91 80.9% 7.1% 13,173 99 88.3% 8.0% (8.5%) (7.4%) (0.9%)
Nairobi CBD 12,425 89 85.6% 7.1% 10,875 82 88.3% 7.6% (7.5%) (2.7%) (0.5%)
Thika Road 12,600 84 80.4% 6.3% 12,517 86 81.5% 6.7% (2.4%) (1.0%) (0.4%)
Msa Road 11,400 73 66.5% 5.5% 11,400 79 65.6% 5.8% (8.2%) 0.9% (0.3%)
Average 12,638 97 80.3% 7.5% 12,507 101 83.3% 8.3% (4.3%) (3.2%) (0.7%)
Source: Cytonn Research
• Gigiri, Karen and Westlands were the best performers in 2019 recording rental yields of 9.2%, 8.3%, and 8.3%,
respectively, due to their superior locations and availability of quality Grade A offices, enabling them to charge a
premium on rentals
• Thika Road and Mombasa Road were the worst performers recording rental yields of 6.3% and 5.5%, respectively,
attributed to poor location as a result of traffic congestions, and lower quality office spaces, that are generally
unattractive to firms
www.cytonn.com 20Nairobi Office Market Performance, Continued…
Gigiri, Karen and Westlands were the best performers recording rental yields of 9.2%, 8.3%, and 8.3%,
respectively
Gigiri
• Gigiri recorded average rental yields of 9.2% in 2019, a 0.8% points decrease from the 10.0% recorded in 2018. The
decline in performance was driven by a 5.1% and 4.6% points decline in rents and occupancy rates, respectively.
Despite the drop in rental yields, the area remain the best-performing node driven by its low supply of office space as
well as its serene environment, security and quality Grade A offices making it attractive to multinational companies
Karen
• Karen recorded a 0.9% decline in performance driven by a 6.5% and 3.3% decline in rents and occupancy rates to Kshs
111 per SQFT and 85.3%, respectively, in 2019 from Kshs 118 per SQFT and 88.6% in 2018, respectively. This was
attributed to reduction of rental rates by property managers in a bid to attract tenants and retain the existing ones
Westlands
• Westlands recorded average rental yields of 8.3% in 2019, a 0.7% points decrease from the 9.0% recoded in 2018.
Rents and occupancy rates declined by 5.2% and 1.8% points to Kshs 104 and 80.3%, respectively, in 2019 from Kshs
109 and 82.1% in 2018 attributable to new supply of office space with the completion of the Address (243,000 SQFT)
and Laxcon (100,000 SQFT). This adds to the existing oversupply in the area which comprises 17.6% of office space in
the Nairobi Metropolitan Area
www.cytonn.com 21Nairobi Office Market Performance, Continued…
In 2019, Parklands, Upperhill and Kilimani recorded average rental yields of 8.2%, 7.5% and 7.1%,
respectively
Parklands
• Parklands recorded an average rental yield of 8.2% in 2019, a 0.2% points decrease from the 8.4% recorded in 2018.
This was driven by a 4.8% and 2.9% decline in rents and occupancy rates attributed to an influx of supply with the
completion of Merchant square, Capital Square and Park Medical Centre. However, the area still remains attractive
attributed to its proximity to the CBD and Westlands, ample infrastructure and favourable zoning regulations facilitating
densification
Upperhill
• Upperhill recorded a 0.7% points decline in performance with rental yields averaging at 7.5% in 2019, from the 8.2%
recorded in 2018. The decline in performance was driven by 1.3% and 4.0% points decline in rents and occupancy rates
to Kshs 98.5 and 80.0% in 2019 from Kshs 99.8 and 84.0% in 2018 attributable to the existing an oversupply of office
space in the market
Kilimani
• Kilimani recorded average rental yields of 7.1% in 2019, a 0.9% points decrease from the 8.0% recoded in 2018. Rents
and occupancy rates also declined by 8.5% and 7.4% points to Kshs 91 and 80.9%, respectively, in 2019 from Kshs 98.9
and 88.3% in 2018 attributed to an oversupply of office space in the area. New buildings completed in 2019 include 19
Kabasarian Avenue (76,600 SQFT) and The Arch Place (120,000 SQFT)
www.cytonn.com 22Nairobi Office Market Performance, Continued…
Mombasa Rd’s rental yield was 2.2% points lower than the market average making it the worst performing
node
Nairobi CBD
• The Nairobi CBD recorded a 0.5% point decline in performance recording average rental yields of 7.1% in 2019 from
7.6% in 2018. This was driven by 2.7% points decline in rental yields to 85.6% in 2019 from 88.3% in 2018 attributable
to relocation by multinational firms to other nodes offering serene environment and quality office spaces
Thika Road
• Over the last three years, Thika Road has established itself as an upcoming office zone offering quality grade B offices.
The node, however, recorded a 0.4% points marginal decline in performance recording rental yields of 6.3% in 2019
from 6.7% in 2018. The decline in performance was driven by a 2.4% and 1.0% points decline in asking rents and
occupancy rates attributed to new supply including the recent completion of the Garden City Business park (134,160
SQFT)
Mombasa Road
• Mombasa Road registered a 0.3% point decline in performance recording average rental yield of 5.5% in 2019 from
5.8% in 2018. It was the worst performer, recording 2.2% points lower than the market average of 7.7% attributed to
its zoning for industrial use and lower quality office space
www.cytonn.com 23ii. Performance by Grades
Classification of Offices in Nairobi
Kenya has various types of offices according to the global classification

GRADE A
• Ideally Grade A buildings should occupy more than 200,000 square feet. Very few buildings in Nairobi meet this threshold.
  Therefore for our research, we have used office buildings with a total area ranging from 100,000-300,000 square feet that are
  pace setters in establishing rents and that generally have ample natural good lighting, good views, prestigious finishing and
  on-site undercover parking
• Grade A buildings provide state of the art technical services such as high quality elevators, fittings and automation systems.
  They provide ample parking at a minimum ratio of 3:1000

GRADE B
• For our research, we have used buildings with a total area ranging from 50,000 to 100,000 square feet. They have good (but
  lower than grade A) technical services and ample parking space

GRADE C
• These are buildings of any size, usually older and in need of renovation, they lack lobbies and may not have on site parking
  space. They charge below average rental rates

                                                         www.cytonn.com                                                     25
Distribution of Various Classes of Offices
Grade B offices are the most common, accounting for 50.2% of commercial offices in Nairobi
Office Space Distribution by Class
100.0% 92.4%
90.0%
80.0% 75.6%
67.7%
70.0%
50.8% 59.9%
60.0% 53.7% 52.1%
49.2% 47.3%
50.0% 43.7% 45.6%
41.5% 42.1% 38.8%
40.0% 35.7% 35.2%
31.4%
28.0% 28.3%
30.0% 24.4%
19.2%
20.0% 11.2%
7.6% 9.1%
10.0% 4.4% 4.3%
0.9%
0.0%
Kilimani Gigiri Karen Msa Road Nairobi CBD Parklands Thika Road UpperHill Westlands Total Market
Share
Grade A Grade B Grade C
• The market has witnessed an increase in Grade A office supply with offices such as The Address (243,000
SQFT), 1 Park Avenue (133,000 SQFT) and The Arch Place (120,000 SQFT) coming into the market and therefore
increasing the market share of Grade A offices from approximately 25.0% to approximately 41.6% of our sample size
• From our sample, Grade B office spaces still account for a majority office spaces in Nairobi with a market of
52.1%
• For the individual nodes, Gigiri has the highest percentage of its offices being Grade A at 75.6%. Nairobi
CBD had the highest percentage of its offices being Grade B at 92.4% and no Grade A office space
www.cytonn.com 26Performance of the Various Offices by Class
Grade B office spaces had the highest rental yields at 7.9%
∆ Rental
∆ Occupancy Yields Y/
Office Price 2019 Rent 2019 Occupancy Yield Price 2018 Rent 2018 Occupancy Yield ∆ Rent Y/Y Y (%
Grade Kshs/ SQFT (Kshs/SQFT) 2019 (%) 2019(%) Kshs/ SQFT (Kshs/SQFT) 2018(%) 2018 (%) Y/Y (% points) points)
Grade A 12,860 105 73.8% 7.4% 13,070 111 74.1% 7.9% (6.3%) (0.4%) (0.6%)
Grade B 12,706 99 82.7% 7.9% 12,388 102 86.1% 8.5% (3.3%) (3.4%) (0.7%)
Grade C 10,920 82 80.4% 7.2% 10,920 85 87.0% 7.9% (3.5%) (6.6%) (0.7%)
Average 12,552 97 80.5% 7.7% 12,407 101 83.8% 8.3% (4.3%) (3.2%) (0.7%)
• The performance of the commercial sector softened with declines recorded across all the grades. This is largely attributed
to oversupply which stood at 6.3 mn SQFT
• Commercial offices recorded an average rental yield of 7.7% at an average occupancy of 80.5%, monthly rental charges
of Kshs 97 per SQFT and price per SQFT of Kshs 12,552
• Grade B office spaces had the highest rental yields at 7.9% as tenants prefer them because of their cheaper rents as
compared to grade A offices while having decent technical services (not as good as those of grade A) and ample security
• Despite declines recorded across all grades, grade A offices recorded the least declines in occupancy and rental yields at
0.4% points and 0.6% points respectively. Their performance was slightly cushioned by the entry of various multinationals
in the country in 2019 who prefer grade A offices due to their quality finishes, ample parking space and high end technical
services
www.cytonn.com 27iii. Performance by Nodes & Grades
Performance by Nodes and Grades
For Grade B spaces, Westlands and Karen offer the highest rental yield of 8.7% and 8.2%, respectively

                                     Commercial Office Performance in 2019 by Nodes and Grades
Typology                  Grade A                                   Grade B                                   Grade C
Location     Rental Yield (%)       Occupancy (%)      Rental Yield (%)       Occupancy (%)      Rental Yield (%)       Occupancy (%)
Gigiri                 10.1%               81.3%                  7.9%                79.0%
Karen                   8.8%               87.0%                  8.2%                84.9%
Parklands               7.3%               75.0%                  8.1%                82.0%                9.0%                91.4%
Westland
s                      7.2%                72.6%                 8.7%                81.2%                 7.9%                86.4%
Upper Hill             6.9%                69.1%                 7.9%                85.1%                 6.6%                82.5%
Kilimani               7.2%                70.0%                 7.2%                81.7%                 6.2%                92.0%
Msa Road               6.0%                79.0%                 6.3%                71.3%                 4.8%                58.6%
Thika
Road                   4.9%                60.0%                 6.5%                84.6%                 6.6%                80.0%
Nairobi
CBD                                                              7.2%                86.7%                 6.8%                79.5%
• For Grade A offices, in 2019, Gigiri and Karen offered the highest returns with average rental yields of 10.1% and 8.8%,
  respectively, as they enjoy a superior location characterized by serene environment and low-rise developments
• For Grade B, Westlands and Karen offer the highest rental yield of 8.7% and 8.2%, respectively, and hence offer an
  investment opportunity in the market
• For Grade C, Parklands and Westlands offer the best investment opportunity with average rental yields of 9.0% and
  7.9%, respectively

                                                          www.cytonn.com                                                        29
iv. Serviced Offices Performance
Serviced Offices Performance
Serviced offices recorded yields of 12.3%, 4.3% points higher than the un-serviced offices' yield of
8.0%

                                  Serviced and Un-serviced Office Performance Comparison 2019

Location               Revenue Per SQFT                           Occupancy (%)                                Yield

                                    Un-serviced                             Un-serviced                                Un-serviced
              Serviced Offices        Offices          Serviced Offices       Offices           Serviced Offices         Offices

Westlands                   248               104                 81.2%             80.3%                  15.9%                8.3%

Upperhill                   199                   98              79.7%             80.0%                  12.2%                7.5%

Karen                       186               111                 70.0%             85.3%                   8.7%                8.3%

Average                     211               104                 77.0%             81.9%                  12.3%                8.0%

• Serviced (or shared) office spaces refer to fully furnished and equipped office spaces that managed by a facility
   management company
• In 2019, serviced offices recorded yields of 12.3%, 4.3% points higher than the un-serviced offices' yield of 8.0%. This is
   attributed to the attractiveness of the office setup to small businesses, start-ups and freelancers due to; (i) flexibility of
   the leases as they could range for short periods, (ii) no set-up costs required, and, (iii) opportunities for collaboration with
   other individuals/businesses in a competitive working environment
• Westlands and Upperhill were the best performing nodes recording rental yields of 15.9% and 12.2%

                                                            www.cytonn.com                                                             31
D. Office Space Opportunity
Office Space Opportunity – Methodology
GAP Analysis used to estimate over/undersupply situation in the market, supply is subtracted from demand
and if a positive figure the market is undersupplied with a negative figure indicating an oversupply

• To gauge the supply situation in Nairobi, we used the Gap Analysis
• Gap analysis is a tool that measures the under or oversupply situation of an office market using demand and supply
  dynamics
• Demand is calculated by adding up net absorption (space taken up in a market in a year) by the space required to
  replenish depreciated office stock
• We used a depreciation rate of 2% p.a for office buildings
• Supply is calculated by summing up the completed office stock in a given year and the vacant stock from the previous
  year
• To get the over/undersupply in the market, the supply is subtracted from the demand
• If it is a positive figure then the market has an under supply that is demand is more than supply and if it is a negative
  figure then the market has an oversupply that is supply is more than demand
• Based on building plan approvals data, in 2019, the market had a supply of 6.7 mn SQFT against a demand
  of 0.3 mn SQFT resulting in an oversupply of 6.3 mn SQFT assuming a 2 year lag between building
  approvals and completion of construction
• Office space supply has grown at 7-year CAGR of 24.7% to 36.3 mn SQFT in 2019 from 7.7 mn SQFT in 2012 driven by
  the positioning of Nairobi as a regional hub, thus increased entrance of multinationals as well as the growth of Small and
  Medium Enterprises (SMEs)

                                                       www.cytonn.com                                                    33
Office Space Opportunity
In 2019, the commercial office sector had an oversupply of 6.3 mn SQFT
Commercial Office Space Supply Analysis
Year 2011 2012 2013 2014 2015 2016 2017 2018 2019 2020F 2021F 2022F
Stock ( Mn Sqft) 6.7 7.7 9.7 15.4 22.9 28.9 31.8 35.5 36.3 36.9 37.5 38.0
Completions ( Mn Sqft) 1.2 2.1 5.9 7.8 6.5 3.5 4.3 1.5 1.4 1.3 1.3
Vacancy Rate ( %) 9.0% 9.0% 10.0% 10.0% 11.0% 12.0% 16.8% 16.7% 19.5% 19.9% 20.2% 20.6%
Vacant Stock ( Mn Sqft) 0.6 0.7 1.0 1.5 2.5 3.5 5.3 5.9 7.1 7.2 7.3 7.4
Occupied Stock (Mn Sqft) 6.1 7.1 8.8 13.9 20.3 25.4 26.5 29.6 29.2 29.7 30.2 30.6
Net Absorption 1.0 1.7 5.1 6.5 5.1 1.0 3.1 (0.4) 0.5 0.5 0.4
Demand (mn SQFT) 1.1 1.9 5.3 6.8 5.6 1.6 3.7 0.3 1.3 1.2 1.2
Available Supply, AS(T) 1.7 2.6 6.5 8.8 8.4 6.3 9.0 6.7 6.7 7.8 7.8
Under(Over)supply (0.5) (0.8) (1.2) (2.1) (2.9) (4.7) (5.2) (6.3) (6.5) (6.6) (6.7)
Demand= Net absorption + space required to replace depreciated stock
Over(Under)supply= Demand - Available supply
Source: KNBS, NCG Completions data, Cytonn Research
www.cytonn.com 34Office Space Opportunity
Opportunity in the sector is in serviced offices, in zones with low supply and in new markets such as county
headquarters with low supply of office space
Concept/Market Niche Characteristics
• Mixed-Use Development (MUD) refers to a real estate development containing more than one real
Location
estate theme
Mixed-Use Developments • They have attractive returns with average rental yields of 7.9% against an average of 7.7% for
single-use offices. Such developments will increase the occupancy rates of the building and hence the
returns to the investor
• This refer to fully furnished and equipped office spaces continued to gain popularity over time. They
Serviced Offices also have attractive returns with average rental yields of 12.3% against an average of 7.7% for
conventional offices
• They will thus not only increase an investor’s returns, but also diversify his portfolio
Quality and • Despite the oversupply in the market, some zones still have relatively low supply and high returns
Convenience such as Gigiri with a market share of 1.0% and a rental yield of 9.2% and are hence a good
Low Supply Zones
investment opportunity
• Relaxation of zoning regulations is also paving way for development of office spaces in previously
New Markets
residential zones such as Thika road, Parklands and Gigiri
Cautious investments can be made in the commercial office theme for long term gains when the market picks up in 3-5
years. Investments should be geared towards zones with low office supply ,differentiated concepts such as mixed-use
developments and serviced offices
www.cytonn.com
35 35E. Office Market Conclusion and Outlook
Office Market Conclusion and Outlook
We have a negative outlook for the commercial office theme in Nairobi and thus investment in the
commercial office theme should be geared to the long-term horizon for gains when the market picks up
Nairobi Commercial Office Outlook
Measure 2018 Sentiment 2019 Sentiment and 2020 Outlook 2019 Review 2020 Outlook
We had an oversupply of 5.2 mn SQFT of office We had an oversupply of 6.3 mn SQFT of office space in
Location space in 2018, and it is expected to grow by 2019, and it is expected to grow by 1.9% to 6.5 mn SQFT in
7.6% to 5.6 mn SQFT in 2019, compared to 2020, due to reduced activity as a result of the COVID-19
Supply 10.8% in 2018, due to decreasing supply with pandemic and delay of approvals by the Nairobi County Negative Negative
completions expected to decrease by 21.4% Government
from 4.3mn SQFT to 3.4mn SQFT in 2019
There was increased demand for office space in There was reduced demand for office space in the Nairobi
Nairobi evidenced by the 0.7% y/y increase in Metropolitan Area (NMA) evidenced by the 3.3% y/y
occupancy mainly attributable to political decline in occupancy mainly attributable to an oversupply
stability that has led to increased economic and minimal growth in private sector credit. However,
activities, positioning of Nairobi as a regional there exists demand in differentiated concepts such as
hub and thus increased entrance of serviced offices from start-ups and multinational firms due
Demand multinationals and Improving macroeconomic to their ability to offer flexible lease agreements and office Neutral Neutral
Quality and environment, with the GDP growing at 6.0% in space
Convenience Q3’2018, higher than the 4.7% recorded in
Q3’2017, and expected to close at 5.8% for the
year 2018
The performance of office market improved Performance softened in 2019 recording 0.7% points and
with yields increasing by 0.2% points to 8.1% in 3.3% points y/y decline in average rental yields and
2018 from 7.9% in 2017, and occupancy rates occupancy rates, to 7.7% and 80.5% in 2019, from 8.3%
Office Market increased by 0.7% points from 82.6% in 2017 to and 83.8%, in 2018, respectively. We expect rental prices
83.3% in 2018 to drop slightly over the short term due to downward Neutral Negative
Performance
pressure arising from the decline in effective demand from
the existing oversupply in the market
www.cytonn.com
37 37You can also read