Housing Statistics for Scotland Quarterly Update: New Housebuilding and Affordable Housing Supply (published 14 September 2021)
←
→
Page content transcription
If your browser does not render page correctly, please read the page content below
Housing Statistics for Scotland Quarterly Update:
New Housebuilding and Affordable Housing
Supply (published 14 September 2021)
This statistical publication provides information on the latest trends in:

   • Quarterly private-led and all-sector new housebuilding starts and completions to end
     September 2020.
   • Quarterly social sector new housebuilding starts and completions to end December
     2020.
   • UK House Price Index Official Statistics on new build sales transactions, as a
     measure of private-led new housebuilding activity in Scotland to end April 2021.
   • Quarterly Affordable Housing Supply Programme approvals, starts and completions,
     by type, to end June 2021.
The publication also presents annual rates of new housebuilding and affordable housing
supply per head of population, including comparisons to other UK countries.

Note that the latest private-led and all-sector new housebuilding figures contain some
estimates for a small number of authorities. Further details are provided in Section 2.

Chart 1: Annual all-sector new housebuilding starts and completions both decreased in the
latest year to end September 2020, with activity levels being affected by the introduction of
COVID-19 lockdown measures from mid-March to late June 2020

                                               1
Background information including Excel tables and explanatory notes on data sources and
quality are available in the Housing Statistics webpages.

Contents
Housing Statistics for Scotland Quarterly Update: New Housebuilding and
Affordable Housing Supply (published 14 September 2021) .............................. 1
  Contents ................................................................................................................ 2
  1. Main points ........................................................................................................ 2
  2. Delays to new housebuilding statistics due to COVID-19, and estimates made
  for a small number of authorities ........................................................................... 3
  3. All-sector new housebuilding ............................................................................. 4
  4. Private-led new housebuilding ......................................................................... 12
  5. UK House Price Index (HPI) new build sales transactions, as a measure of
  private-led housebuilding activity to end April 2021 ............................................ 17
  6. Social sector new housebuilding ..................................................................... 20
  7. Affordable housing supply ............................................................................... 27
  8. Notes ............................................................................................................... 36

1. Main points
Note that the latest private-led and all-sector new housebuilding figures contain some
estimates for a small number of authorities. Further details are provided in Section 2.

   • There were 15,852 new build homes completed across all sectors in Scotland in the
     year to end September 2020, a decrease of 28% (6,132 homes) on the previous
     year, with activity levels being affected by the introduction of COVID-19 lockdown
     measures from mid-March to late June 2020. Decreases were seen across private-
     led completions (31% or 5,133 homes), housing association completions (15% or
     591 homes) and local authority completions (27% or 408 homes).
   • The number of new build homes started across all sectors also decreased in the
     year to end September 2020, with a total of 18,973 starts, a decrease of 24% (5,986
     homes) on the previous year. Private-led starts dropped by 33% (6,055 homes) and
     local authority starts dropped by 29% (580 homes), whilst housing association
     approvals increased by 13% (649 homes).
   • More up-to-date figures published as part of the UK House Price Index show a total
     of 2,680 private new build sales transactions in Scotland in the quarter January to
     March 2021. This is a decrease of 405 transactions (13%) on the 3,085 transactions
     recorded in the previous quarter October to December 2020, but an increase of
     1,963 on the 717 transactions seen in April to June 2020, when construction and
     housing market lockdown measures were in place from mid-March to late June
     2020.

                                                            2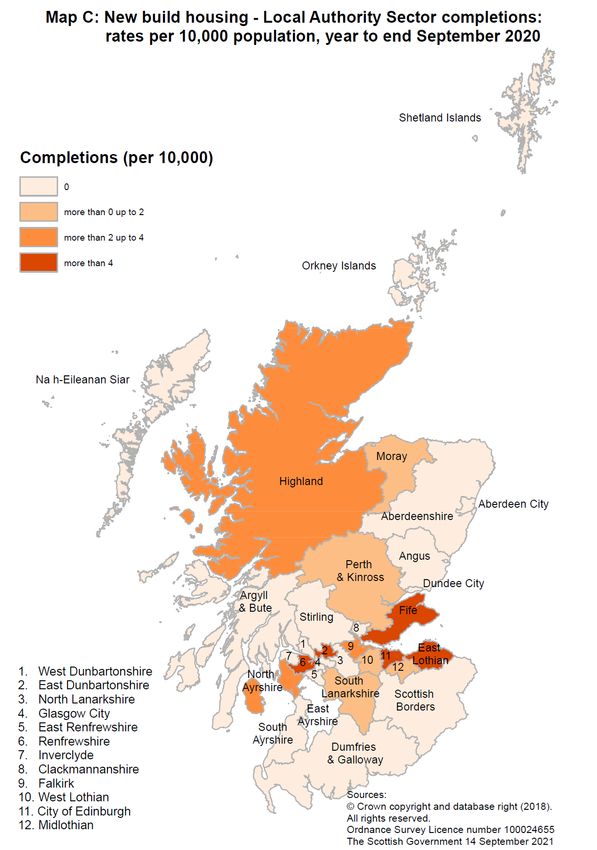
• This brings the total number of private new build sales transactions in the year to
    end March 2021 to 8,904, a decrease of 27% (3,340 transactions) on the 12,244
    transactions recorded in the year to end March 2020.
  • Latest social sector new housebuilding figures to end December 2020 show that
    1,256 social sector homes were completed in the quarter October to December
    2020. This is an increase of 29% (285 homes) on the previous quarter July to
    September 2020, and an increase of 1,222 homes on the 34 homes completed in
    April to June 2020 (during which housebuilding activity was largely paused due to
    lockdown measures), but a decrease of 14% (213 homes) on the 1,469 social sector
    completions in October to December 2020. This brings the total completions for the
    12 months to end December 2020 to 4,189, a decrease of 29% (1,720 homes) on
    the 5,909 social sector homes completed in the previous year.
  • Affordable Housing Supply Programme statistics reflect the broader supply of
    affordable homes for social rent, affordable rent and affordable home ownership,
    and include off the shelf purchases and rehabilitations as well as new builds. A total
    of 1,595 affordable homes were completed in the latest quarter April to June 2021,
    bringing the total number of affordable homes completed in the 12 months to end
    June 2021 to 7,864. This is a decrease of 5% (374 homes) on the 8,238 affordable
    homes completed in the previous year, with decreases in the number of completions
    for social rent (by 11% or 701 homes) and affordable home ownership (by 5% or 63
    homes), but an increase in the number of completions for affordable rent (by 48% or
    390 homes).
  • A total of 1,063 affordable homes were approved in April to June 2021, bringing the
    total number of homes approved in the 12 months to end June 2021 to 7,972, a
    decrease of 36% (4,404 homes) on the 12,376 homes approved in the previous
    year, with decreases in the number of approvals for social rent (by 38% or 3,692
    homes), affordable rent (by 30% or 420 homes) and affordable home ownership (by
    23% or 292 homes).
  • Over the same period, a total of 1,854 affordable homes were started in April to June
    2021, bringing the total number of homes started in the 12 months to end June 2021
    to 11,097. This is an increase of 3% (282 homes) on the 10,815 homes started in
    the previous year, with increases in the number of starts for social rent (by 5% or
    405 homes) and affordable home ownership (by 3% or 34 homes), but a decrease in
    the number of starts for affordable rent (by 9% or 157 homes).

2. Delays to new housebuilding statistics due to COVID-19, and
estimates made for a small number of authorities
The Housing Statistics for Scotland Quarterly Update as at September would usually
include an update on private-led and all-sector new house building starts and completions
to end March, with more recent figures on social sector new builds to end June. However
due to COVID-19 related delays in new build data provision over the last year, this
publication includes figures on private-led and all-sector new house building starts and
completions only up to end September 2020, with more recent figures on social sector new
builds only up to end December 2020.

                                            3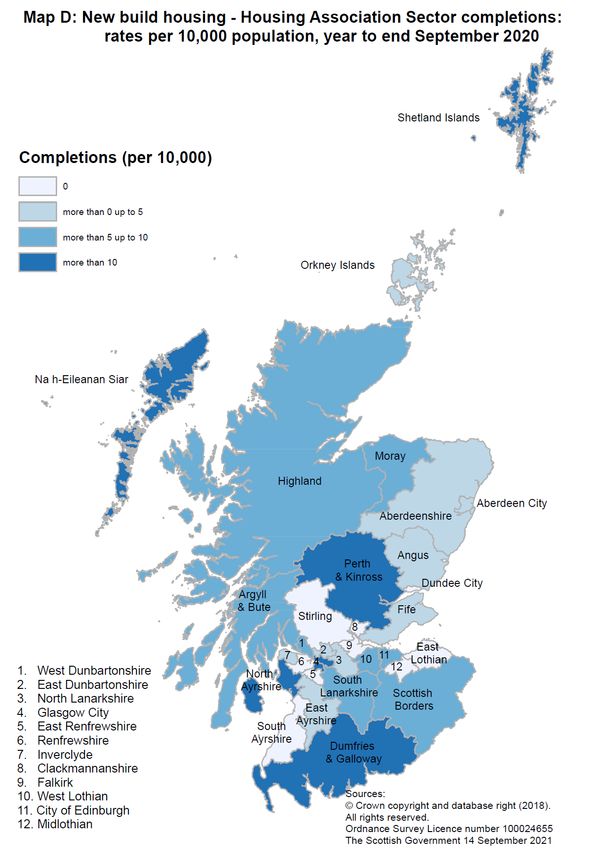
Given these delays in the reporting of new housebuilding trends, separate figures from the
UK House Price Index on new build sales transactions are provided in Section 5 as an
alternative measure of private-led new housebuilding activity in Scotland over the more
recent period to end April 2021.

In addition to these delays in provision of data, East Dunbartonshire Council have been
unable so far to provide private-led new build data for the three quarters 2020 Q1 to 2020
Q3, and so these figures have been estimated, although previously estimated starts and
completions figures for 2019 Q4 have now been replaced with returned figures. Glasgow
City Council have been unable so far to provide private-led new build starts data for the
four quarters from 2019 Q4 to 2020 Q3 and so these figures have also been estimated.
However we are working with Glasgow to obtain these figures and aim to replace these
estimates with actual figures in future publications. In addition, estimates have been made
for private-led new build starts and completions figures for Angus Council for the most
recent two quarters 2020 Q2 and 2020 Q3, as well as South Lanarkshire Council for the
most recent quarter 2020 Q3, due to a delay in provision of this data.

As with previous publications, the estimates of private-led new build activity are each
based on an average of the preceding four quarters, with an adjustment made to account
for the lower levels of construction activity seen in particular quarters due to the impact of
COVID-19, which is based on the aggregate trends from the local authorities who have
provided data across the COVID-19 period.

An additional estimate has been made for local authority new housebuilding starts and
completions for Highland for 2020 Q4, due to a delay in the return. As with previous
estimates for local authority new housebuilding figures, this estimate is based on separate
starts and completions figures taken from the Scottish Government Housing and
Regeneration Programme (HARP) system.

A number of additional historic corrections provided by local authorities have also been
made, with further details available in the Excel tables.

3. All-sector new housebuilding
The new-housebuilding section of this document provides figures on the number of homes
started, based on when the foundations are begun, and completed, which is based on
when a building inspector deems the property complete.

Figures are presented for homes built on privately led sites (referred to throughout as
private sector), local authority led sites (referred to as local authority sector) and housing
association led sites (referred to as housing association sector). Social sector
housebuilding is the combined total of local authority and housing association builds.

For the private sector the latest information available is for the quarter ending September
2020. Therefore headline findings for new housebuilding across all sectors are presented
up to end September 2020, with other figures on social sector housebuilding presented up
to end December 2020 where more recent data allows.

The figures have not been seasonally adjusted and so commentary tends to compare the
latest 12 month period with the previous 12 month period, or the latest quarter with the
                                               4
same quarter in the previous year. Also note that some of the peaks in the number of
starts in Quarter 1 (January to March) each year are generally due to greater numbers of
housing association approvals being granted near the end of the financial year.

It should be noted that the amount of all-sector new housebuilding activity recorded in the
quarters January to March 2020 and April to June 2020 will have been impacted by the
introduction of measures to reduce the spread of the coronavirus (COVID-19) from mid-
March to late June, in which non-essential construction activity stopped and home buyers
were advised to delay moving to a new home where possible, after which there has been
a phased re-start of supply activity.

Chart 1 (see page 1) shows that annual all-sector new build starts and completions (years
to end September) have both shown a broadly decreasing direction of trend following the
financial crisis in 2008, with starts falling up to 2011 and completions falling up to 2013,
after which there have been increases over most years up to 2019. In the latest year to
September 2020, starts and completions have decreased by 24% and 28% respectively,
with activity levels being affected by the construction and housing market COVID-19
lockdown measures in place between mid March and late June 2020.

Figures for the year to end September 2020
Levels of activity in the two quarters January to March and April to June 2020 were
affected by the COVID-19 construction lockdown measures in place between mid-March
and late June, with all sectors showing marked decreases in the total number of
completions recorded for April to June 2020. Levels of activity recorded in the most recent
quarter July to September 2020 show increases across all sectors following the decreases
seen in the previous quarter, although overall levels of completions are lower than both the
last full quarter before lockdown (October to December 2019) as well as the same quarter
in the previous year (July to September 2019).

There were 3,977 all-sector completions in July to September 2020, 3,253 homes more
than the 724 completions in the previous quarter April to June 2020, but 26% (1,374
homes) fewer than the 5,351 homes completed in the same quarter in 2019.

The 3,006 private sector led completions in July to September 2020 is an increase of
2,316 homes on the previous quarter, but 26% (1,045 homes) fewer than the 4,051
completions recorded in the same quarter in 2019. The 424 local authority homes
completed in July to September 2020 is an increase of 390 homes compared with the
previous quarter April to June 2020, and 8% (32 homes) higher than the 393 completions
seen in July to September 2019. There were 547 housing association completions in the
latest quarter July to September 2020, compared with no completions being recorded in
the previous quarter April to June 2020, however this is 40% (361 homes) fewer homes
than the 908 completions recorded in July to September 2019. (See Chart 2 below).

                                             5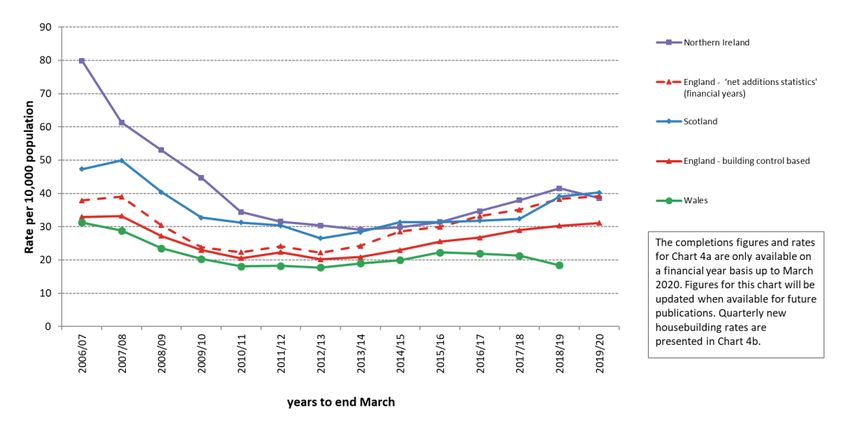
Chart 2: Levels of quarterly new housebuilding completions in the latest quarter July to
September 2020 have increased in all sectors compared to the previous quarter April to
June 2020 (during which housebuilding activity was largely paused due to lockdown
measures), however overall levels of completions are lower than in the same quarter in the
previous year, July to September 2019

Chart 3 shows quarterly trends in all-sector starts, in which there were 4,124 all-sector
homes started in July to September 2020, an increase of 2,859 homes compared to the
1,265 homes started in the previous quarter April to June 2020, but a decrease of 31%
(1,820) homes compared with July to September 2019.

The 3,394 private sector led starts is an increase of 2,546 homes compared with the
previous quarter, but a decrease of 27% (1,251 homes) compared with the same quarter
in 2019. The 246 local authority homes started in July to September 2020 is an increase of
233 homes compared with April to June 2020, but a decrease of 56% (307 homes) on the
same quarter in 2019. The 484 housing association approvals in July to September 2020
is an increase of 20% (80 homes) on the 404 approvals seen in the previous quarter, but
is a decrease of 35% (262 homes) compared with July to September 2019.

                                             6
Chart 3: Levels of quarterly new housebuilding starts in July to September 2020 have also
increased in all sectors compared to the previous quarter April to June 2020 (during which
housebuilding activity was largely paused due to lockdown measures), however overall
levels of starts are lower than in the same quarter in the previous year, July to September
2019
Over the 12 months to end September 2020, there were 15,852 all-sector new build
homes completed, a drop of 28% (6,132) on the previous year. There were 18,973 homes
started, a drop of 24% (5,986) on the previous year.
Table 1 – All sector new housebuilding to end September 2020
All sector homes Starts Completions
Quarter Jul to Sep 2017 3,942 4,265
Quarter Jul to Sep 2018 4,527 4,937
Quarter Jul to Sep 2019 5,944 5,351
Quarter Jul to Sep 2020 4,124 3,977
Change from Q3 2019 to Q3 2020 -1,820 -1,374
Change from 2019 to 2020 (%) -31% -26%
Year to Sep 2017 19,262 17,975
Year to Sep 2018 20,215 18,781
Year to Sep 2019 24,959 21,984
Year to Sep 2020 18,973 15,852
Change from 2019 to 2020 -5,986 -6,132
Change from 2019 to 2020 (%) -24% -28%
7Sub-national local authority figures for the year to end September 2020
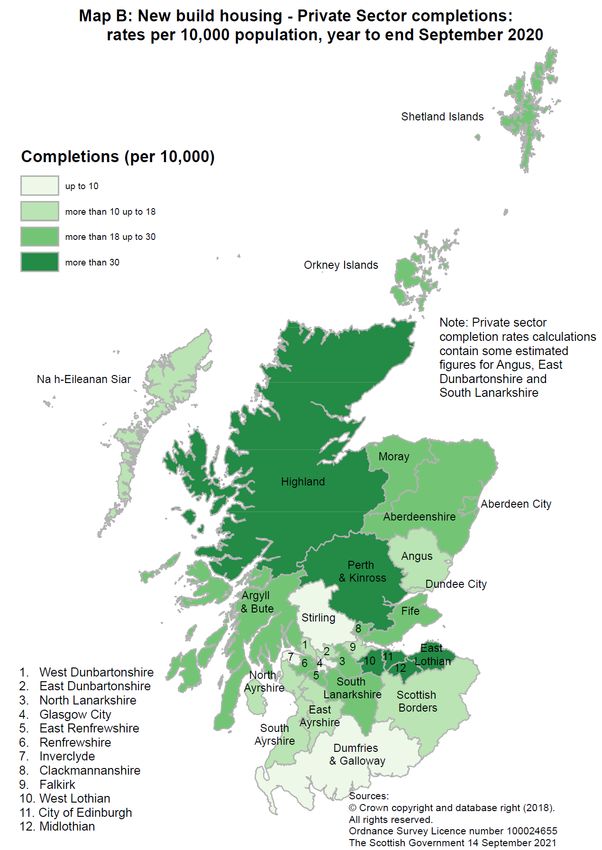
The information on new build housing in Scotland is collected and published at local
authority level. Map A, below, shows new housebuilding in the year to end September
2020, as a rate per 10,000 population based on the latest mid-2020 population estimates.
It should be noted that the rates of all-sector new housebuilding activity recorded will have
been impacted by the introduction measures to reduce the spread of the coronavirus
(COVID-19) from mid-March to late June 2020.
In the year to end September 2020, the highest new build rates were observed in East
Lothian, Midlothian, Perth & Kinross, West Lothian Highland and Edinburgh. The lowest
rates were observed in Stirling, South Ayrshire, Dundee City, Inverclyde, Glasgow, Angus
and Dumfries & Galloway.
Note that the all sector completion rates calculations contain some estimated figures.
Estimated figures have been used for private sector completions for East Dunbartonshire
Council for the period January to September 2020, Angus Council for the period April to
September 2020, and South Lanarkshire Council for the quarter July to September 2020.
89
Comparison with the rest of the UK from 2007 to 2021
Each of the countries of the UK produces their own statistics on quarterly new build
housing starts and completions by tenure, and all use broadly consistent definitions. The
quarterly new build statistics for each of the countries of the UK are brought together in the
UK House building update section of the ONS website.

In addition to this, the Ministry of Housing, Communities and Local Government (MHCLG)
also produces an additional annual set of statistics for England on new build homes, as a
component part of the ‘Housing supply; net additional dwellings, England’ set of statistics 1.
These statistics are collected on a different basis to the quarterly UK country statistics as
local authorities can use a range of data sources to collate these figures, rather than solely
using building control information. Latest figures on this for 2019/20 were published in
November 2020, and the publication advised that the ‘net additional dwellings' should be
considered the primary and most comprehensive measure of housing supply in England.

MHCLG have advised that the quarterly new build statistical collection for England, whilst
being a useful leading indicator of activity throughout the year, is not currently capturing all
new build activity. This is largely due to difficulties in collecting accurate starts and
completions data from independent building inspectors or where building control has been
sourced out to strategic partnerships or the private sector. These data issues do not exist
in the Scotland quarterly housing statistics, given that all of the 32 local authorities in
Scotland directly manage building control and the associated provision of data to the
Scottish Government on starts and completions.

As a result of this advice from MHCLG, the new build component figures of the ‘net
additional dwellings' statistics for England are included in the UK comparisons as an
additional set of figures to consider when comparing between countries on a financial year
basis.

Chart 4a presents trends in the rates of new house building per 10,000 population across
each of the UK countries on a financial year basis (years to end March) to allow for
comparisons with both the England financial year ‘net additional dwelling’ statistics and
financial year rates derived from each of the quarterly UK series. This shows that whilst
Scotland had a higher rate of completions per 10,000 head of population than England
over the period 2006/07 to 2013/14, that Scotland and England have seen broadly similar
rates of housebuilding each year across the period 2014/15 to 2019/20, when comparing
the Scotland figures to the England net addition figures.

In the financial year 2019/20, the 40 homes built per 10,000 population in Scotland was
similar to the rates seen in England (net additional dwellings figures) and Northern Ireland
(both 39 homes per 10,000). The new housebuilding figures for Wales are yet to be
published but will be added to Chart 4a in future publications when available.

1
    Housing supply: net additional dwellings for England
                                                      10
Chart 4a: New housebuilding completions as a rate per 10,000 population (years to end
March) - Scotland had a rate of 40 in the year to end March 2020, similar to the rates in
Northern Ireland (39) and England (‘net additional dwellings’ figures) (39)
Chart 4b presents more recent trends in the rates of new housebuilding per 10,000
population across each of the UK countries on a quarterly basis, based on the latest
published information available for each country 2. The England ‘net additional dwelling’
figure for the financial year 2019/20 is also included as an average across each of the
quarters within this year, to help demonstrate the difference in the relative level between
this figure and the separate quarterly England building control based figures.
The chart shows the clear impact of COVID-19 lockdown restrictions on construction
activity in the quarter April to June 2020, with the rates of new housebuilding per 10,000
population dropping compared to the same in quarter in the previous year by 87% in
Scotland, 65% in England (building control based figures), and 63% in Northern Ireland,
which may reflect stricter lockdown restrictions for Scottish housing building compared to
England and Northern Ireland. Following which the rates of new housebuilding in each of
these countries have subsequently increased back up to higher levels in the July to
September 2020 quarter.
2
The most recent quarterly figures for Northern Ireland and England have been sourced from Land and
Property Services (LPS) in Northern Ireland and the MHCLG Live tables on housing supply.
11Chart 4b: Quarterly new housebuilding rates per 10,000 population for Scotland, Northern
Ireland and England (building control figures) dropped in the quarter April to June 2020,
with completion rates likely to have been affected by COVID lockdown measures in place
4. Private-led new housebuilding
The private sector is the biggest contributor to overall house building, accounting for
almost three quarters (72%) of all homes completed in the 12 months to end September
2020.
Chart 5 shows the annual number of private sector led starts and completions from 2007
to 2020 (years to end September). This shows the impact of the recession in the second
half of the last decade, with private sector led completions falling throughout 2008 due to
the financial crisis. Following this, private led completions decreased more gradually until
2012, and have been broadly increasing in more recent years until dropping by 31% in the
year to end September 2020 due to the impact of COVID-19 construction lockdown
measures in place between mid-March and late June 2020.
Chart 5: Annual private sector led new build starts and completions both decreased in the
latest year to end September 2020, with activity levels being affected by the introduction of
COVID-19 lockdown measures from mid-March to late June 2020
12Figures for the year to end September 2020
Chart 6 below shows that between July and September 2020, 3,006 private sector led
homes were completed, an increase of 2,316 homes on the previous quarter April to June
2020 (during which housebuilding activity was largely paused due to lockdown measures),
but 26% (1,045 homes) fewer than in the same quarter in the previous year, July to
September 2019. This brings the total for the year to end September 2020 to 11,450
completions, a decrease of 31% (5,133 homes) on the 16,583 completions in the previous
year.
There were 3,394 private sector led starts between July and September 2020, an increase
of 2,546 homes on the previous quarter April to June 2020, but 27% (1,251 homes) fewer
than in the same quarter in 2019. This brings the total for the year ending September 2020
to 12,024, a decrease of 33% (6,055 homes) on the 18,079 starts in the previous year.
Chart 6: Private sector led new housebuilding starts and completions in the quarter Jul-Sep
2020 have both increased compared to the previous quarter April to June 2020 (during
which housebuilding activity was largely paused due to lockdown measures), however
levels are lower than in the same quarter in the previous year, July to September 2019
13Table 2 – Private-led new housebuilding to end September 2020
Private sector homes Starts Completions
Quarter Jul to Sep 2017 3,080 3,217
Quarter Jul to Sep 2018 3,701 3,593
Quarter Jul to Sep 2019 4,645 4,051
Quarter Jul to Sep 2020 3,394 3,006
Change from Q3 2019 2019 to Q3 2020 -1,251 -1,045
Change from 2019 to 2020 (%) -27% -26%
Year to end Sep 2017 13,606 14,127
Year to end Sep 2018 13,719 13,811
Year to end Sep 2019 18,079 16,583
Year to end Sep 2020 12,024 11,450
Change from 2019 to 2020 -6,055 -5,133
Change from 2019 to 2020 (%) -33% -31%
In September 2013 the Scottish Government introduced the Help to Buy (Scotland)
scheme which has aimed to support buyers purchasing a new build home and to stimulate
the house building industry. Following this, the Help to Buy (Scotland) Affordable New
Build and Help to Buy (Scotland) Smaller Developers schemes were launched on 21
January 2016. Since 5 February 2021, the Scottish Government has no longer been
accepting applications to the main Help to Buy (Scotland) scheme, although applications
received prior to this date are still being processed. Applications however continue to be
accepted for the Help to Buy (Scotland) Smaller Developer scheme. Further information on
the Help to Buy schemes, along with monitoring information setting out numbers of sales
and the characteristics of buyers, is available on the Help to Buy web pages.
In 2020, the Scottish Government also introduced the First Home Fund. This is a shared
equity pilot scheme to provide first-time buyers with up to £25,000 to help them buy a
property that meets their needs and is located in the area where they want to live, and
which includes the purchase of new build properties as well as existing properties. The
FHF scheme closed to new applications on 8th April 2021. Further information on the First
Home Fund is available on the First Home Fund web pages as well as a Quantitative
Analysis of the First Home Fund Evaluation, a Qualitative Evaluation of the Scottish
Government First Home Fund Shared Equity Scheme and a Summary of findings from the
quantitative and qualitative evaluations of the First Home Fund.
14Sub-national local authority figures for the year to end September 2020
Map B shows the rates per 10,000 head of population (based on the latest mid-2020
population estimates) of private sector led new build completions in each local authority for
the year to end September 2020. It should be noted that the rate of private sector new
housebuilding activity recorded will have been impacted by the introduction measures to
reduce the spread of the coronavirus (COVID-19) from mid-March to late June 2020.
The highest completion rates in the year to end September 2020 have been in East
Lothian, Midlothian, West Lothian and Perth & Kinross, Highland and Edinburgh. The
lowest rates meanwhile, have been in Stirling, Glasgow City, Dumfries & Galloway,
Inverclyde and South Ayrshire.
Note that the private sector completion rates calculations contain some estimated figures.
Estimated figures have been used for private sector completions for East Dunbartonshire
Council for the period January to September 2020, Angus Council for the period April to
September 2020, and South Lanarkshire Council for the quarter July to September 2020.
1516
5. UK House Price Index (HPI) new build sales transactions, as a
measure of private-led housebuilding activity to end April 2021
This section sets out the latest quarterly and monthly trends in the number of new build
sales transactions in Scotland to end April 2021, based on residential property transaction
figures published as part of the UK House Price Index (HPI) 3.

These figures may be helpful in providing an indication of recent levels of private led new
housebuilding activity, particularly given the current delay in the publication of the Scottish
Government new housebuilding private-led starts and completions figures.4

It should be noted that the HPI-based figures are not directly comparable to the Scottish
Government time series on private-led new build starts and completion, due to some
differences in how the two sets of figures are constructed. For example, the UK HPI new
build sales transaction figures are based on the date of the completed sales transaction
rather than the date of completion, and will also not include self-build dwellings or homes
built privately for tenures other than private sales.

Further information on the quality of the HPI data for Scotland, which is sourced from
Registers of Scotland, is available in the UK HPI Quality Assurance section of the UK
House Price Index web page.

Table 3 and Chart 7a below illustrate how the UK HPI figures compare to previously
published Scottish Government Private sector-led completion figures in each quarter from
January to March 2019 onwards, and also provide the latest trends seen in the UK HPI
new build sales transactions figures across the two more recent quarters to January to
March 2021.

It can be seen across the period January to March 2019 to July to September 2020 (the
latest available quarterly figures for Scottish Government Private led completions) that
both data series follow broadly similar trends in respect of increases or decreases
compared to the previous quarter. The Scottish Government figures are higher in most
quarters, but this is likely to be explained by differences in how the figures are constructed,
given that some self-build dwellings or dwellings built privately for tenures other than
private sales will be included, whereas the HPI figures are based on private sale
transactions only.

3
    The most recent figures are accessed through the UK House Price Index: data downloads June 2021.
4
  The Housing Statistics for Scotland Quarterly Update as at September would usually include an update on
all-sector new house building starts and completions to end March in the same year, with more recent
figures on social sector new builds to end June. However due to the impact of COVID-19 on the provision of
new housebuilding data by some local authorities to the usual timescales, this has slowed the timing of the
data collection process over this period.
                                                    17
Table 3 – Scotland-level HPI New Build Sales Transactions Volume for Scotland and
Scottish Government Private Sector-led new build completions
Quarter or year HPI New Scottish
Build Sales Government
Transactions Private-led
Volume completions
Jan – Mar 2019 2,407 3,458
Apr – Jun 2019 3,293 4,532
Jul – Sep 2019 2,759 4,051
Oct – Dec 2019 3,807 4,716
Jan – Mar 2020 2,385 3,038
Apr – Jun 2020 717 690
Jul – Sep 2020 2,422 3,006
Oct – Dec 2020 3,085 Not available
Jan – Mar 2021 2,680 Not available
Change from previous quarter -405
Change (%) from previous quarter -13%
Change from same quarter in previous year +295
Change (%) from same quarter in previous year +12%
Apr 2019 - Mar 2020 12,244 16,337
Apr 2020 - Mar 2021 8,904 Not available
Change from previous year -3,340
Change (%) from previous year -27%
Sources: UK House Price Index: reports - GOV.UK (www.gov.uk) (June 2021 data
downloads) and Scottish Government Private Sector-led new build completions
18Chart 7a: Scottish Government Private Sector led new housebuilding completions and HPI
new build sales transactions. Scotland: Jan - Mar 2019 to Jan – Mar 2021
The latest quarterly HPI figures show that there were 2,680 new build sales transactions in
Scotland in the quarter January to March 2021, a decrease of 405 (13%) on the 3,085
transactions seen in October to December 2020, but an increase of 258 (11%) on the
2,422 transactions seen in July to September 2020. This follows only 717 transactions
being recorded in April to June 2020, a quarter in which housebuilding activity was largely
paused due to lockdown measures.
This brings the total transactions in the year to end March 2021 to 8,904, a decrease of
27% (3,340 transactions) on the 12,244 transactions recorded in the year to end March
2020.
More recent HPI figures for the month of April 2021 show a total of 789 transactions for
this month (see Chart 7b).
19Chart 7b: The number of private new build sales transactions in Scotland in the latest four
months Jan to Apr 2021 have been broadly in line with the number of transactions seen in
these months in the year 2019
6. Social sector new housebuilding
Note in this section that housing association new build approvals are used as a proxy for
housing association new build starts due to data quality considerations, which is an
approach consistent with that taken in previous publications.
Social sector housing consists of local authority and housing association housing, and has
accounted for 28% of all new build homes completed over the 12 months to the end of
September 2020.
Social sector figures are collected a quarter ahead of those for the private sector, meaning
that figures are available up to the end of December 2020. However to enable easier
understanding of how each sector contributes to the all sector totals described previously,
some figures are also presented to end September 2020.
Chart 8a shows the number of local authority and housing association homes started and
completed each year up to end September 2020, whilst Chart 8b shows the same
information but up to end December 2020 (the most recent information available). Charts 9
and 10 show quarterly figures for housing associations and local authorities, respectively.
Between 2008 and 2009 (years to end September) the number of housing association
completions increased from 3,800 to just over 5,700, after which the number of homes
completed dropped in each year until reaching just over 2,500 in 2014. After fluctuating
around this level for the three years after this, housing association completions increased
to just over 3,900 in 2019, before decreasing to just over 3,300 in 2020 due to the
introduction of measures to reduce the spread of the coronavirus (COVID-19) from mid-
March to late June 2020.
20The number of local authority homes built gradually increased from just 97 homes in 2008
up to just over 1,200 in 2012 (years to end September). Completions were then broadly
flat until 2017 where they reached nearly 1,350 homes. Similar levels were seen in 2018,
after which the number of local authority homes completed increased to nearly 1,500
before decreasing in the latest year to end September 2020 to 1,088 completions.
Chart 8a: Latest annual social sector starts and completions figures to end September 2020
show a drop compared to the previous year in the number of local authority starts and
completions, and a drop in the number of housing association completions, but an increase
in housing association approvals
Chart 8b: Latest annual social sector starts and completions figures to end December 2020
show a drop compared to the previous year in the number of starts and completions for
housing associations as well as local authorities
21Chart 9: Housing association new housebuilding approvals and completions in the latest
quarter Oct-Dec 2020 have increased compared to Apr-Jun 2020 and Jul-Sept 2020
following the easing of lockdown restrictions in June 2020, but are lower than the levels
seen in Oct-Dec 2019
Chart 10: Local authority new housebuilding starts and completions in the latest quarter
Oct-Dec 2020 have increased compared to Apr-Jun 2020 and Jul-Sept 2020, following the
easing of lockdown restrictions in June 2020, with completions also being higher than in
Oct-Dec 2019, however with starts being lower than in Oct-Dec 2019
22Figures for the year to end September 2020
There were 971 social sector completions between July and September; a decrease of
25% (329 homes) on the same quarter in 2019. This brings the total for the year to end
September 2020 to 4,402, a decrease of 18% (999 homes) on the 5,401 social sector
completions in the previous year.
Meanwhile, 730 social sector homes were started between July and September 2020; a
decrease of 44% (569 homes) on the same quarter in 2019. This brings the total for the
year to end September 2020 to 6,949, which is a 1% increase (69 homes) on the 6,880
social sector starts in the previous year.
Table 4 – Social sector new housebuilding to end September 2020
Social sector Total Total Social Local Local Housing Housing
homes Social completions authority authority association association
starts starts completions approvals completions
Jul to Sep 2017 862 1,048 382 363 480 685
Jul to Sep 2018 826 1,344 358 326 468 1,018
Jul to Sep 2019 1,299 1,300 553 392 746 908
Jul to Sep 2020 730 971 246 424 484 547
Change -569 -329 -307 +32 -262 -361
Change (%) -44% -25% -56% +8% -35% -40%
Year to Sep-17 5,656 3,848 952 1,322 4,704 2,526
Year to Sep-18 6,496 4,970 1,682 1,384 4,814 3,586
Year to Sep-19 6,880 5,401 2,018 1,496 4,862 3,905
Year to Sep-20 6,949 4,402 1,438 1,088 5,511 3,314
Change +69 -999 -580 -408 +649 -591
Change (%) +1% -18% -29% -27% +13% -15%
Sub-national local authority figures for the year to end September 2020
Maps C and D show the rates of housing association and local authority new build
completions in each local authority for the year to end September 2020 per 10,000 of the
population (based on the latest mid-2020 population estimates). The housing stock of 6
local authorities (Argyll & Bute, Dumfries & Galloway, Glasgow, Inverclyde, Na h-Eileanan
Siar and Scottish Borders) has been transferred to housing associations and so these
areas do not build new local authority houses.
It should be noted that the rates of social sector new housebuilding activity recorded will
have been impacted by the introduction measures to reduce the spread of the coronavirus
23(COVID-19) from mid-March to late June, which will have impacted on the year to end
September totals and new housebuilding rates.
In the year to end September 2020 local authority new build rates were highest in East
Ayrshire, Renfrewshire, East Lothian, Fife, Edinburgh and East Dunbartonshire. As well as
the 6 stock transfer authorities mentioned above, Aberdeen City, Aberdeenshire, Angus,
Clackmannanshire, Dundee City, East Renfrewshire, North Lanarkshire, Orkney Islands,
Shetland Islands, South Ayrshire, Stirling and West Dunbartonshire built no new local
authority homes in the year ending September 2020.
Meanwhile rates of housing association new build completions were highest in Na h-
Eileanan Siar, Glasgow, North Ayrshire, Shetland Islands and Dumfries & Galloway whilst
the lowest rates of housing association new build completions were in Clackmannanshire,
Dundee City, Falkirk, Midlothian and South Ayrshire.
2425
26
Latest figures to end December 2020
A total of 1,256 social sector homes were completed between October and December
2020, a decrease of 14% (213 homes) on the 1,469 completions in the same quarter in
2019. This brings the total completions for the 12 months to end December 2020 to 4,189,
a decrease of 29% (1,720 homes) on the 5,909 social sector homes completed in the
previous year.

Meanwhile, 841 social sector homes were started between October and December 2020.
This is a decrease of 55% (1,012 homes) compared to the same quarter in the previous
year. This brings the total for the 12 months to end December 2020 to 5,937, a decrease
of 16% (1,129 homes) on the 7,066 social sector homes started in the same period in
2019.

Table 5 – Social sector new housebuilding to end December 2020
  Social sector    Total    Total Social    Local         Local         Housing       Housing
  homes            Social   completions    authority    authority     association   association
                   starts                   starts     completions     approvals    completions

  Oct to Dec-17     1,213           932          503           388            710          544

  Oct to Dec-18     1,667           961          434           233          1,233          728

  Oct to Dec-19     1,853          1,469         528           341          1,325         1,128

  Oct to Dec-20      841           1,256         297           537            544          719

  Change           -1,012           -213        -231          +196           -781          -409

  Change (%)        -55%           -14%         -44%         +57%           -59%          -36%

  Year to Dec-17    5,845          3,880       1,291          1,393         4,554         2,487

  Year to Dec-18    6,950          4,999       1,613          1,229         5,337         3,770

  Year to Dec-19    7,066          5,909       2,112          1,604         4,954         4,305

  Year to Dec-20    5,937          4,189       1,207          1,284         4,730         2,905

  Change           -1,129         -1,720        -905           -320          -224        -1,400

  Change (%)        -16%           -29%         -43%          -20%           -5%          -33%

7. Affordable housing supply
Affordable Housing Supply Programme statistics reflect the broader supply of affordable
homes (i.e. for social rent, affordable rent and affordable home ownership) and include off
the shelf purchases and rehabilitations as well as new builds. Statistics are available up to
the end of June 2021.

Quarterly affordable housing supply statistics are used to inform progress against Scottish
Government affordable housing delivery targets, including to deliver the remaining 50,000
target homes as quickly as it is safe to do so over the year 2021/22, along with the longer

                                              27
term ambition, set out in Housing to 2040, of delivering a further 100,000 affordable homes
by 2032 with 70% of these being for social rent. This ambition has now been enhanced by
the SNP/Scottish Green Party Co-operation Agreement which commits to delivering
110,000 affordable homes by 2032, of which at least 70% will be for social rent and 10%
will be in remote, rural and island communities. The statistics reflect the number of
affordable homes delivered that have received some form of government support through
loans, grant or guarantees.
Approvals, starts and completions are all measured for the Affordable Housing Supply
Programme. Approval is the point at which funding is granted. Starts are recorded when
an on-site presence is established to progress site work. Completion measures when the
units are delivered and ready for occupation.
Social Rent includes Housing Association Rent, Council House Rent as well as Home
Owner Support Fund Rent.
Affordable Rent includes Mid-Market Rent (MMR), National Housing Trust (NHT) Rent as
well as other programmes such as the Empty Homes Loan Fund (EHLF) and Rural Homes
for Rent (RHfR).
Affordable Home Ownership includes Open Market Shared Equity (OMSE), New Supply
Shared Equity (NSSE), Shared Ownership (LCHO) as well as other programmes such as
Home Owner Support Fund Shared Equity.
Latest figures to end June 2021:
COVID-19 lockdown restrictions on construction and housing market activity from mid-
March 2020 to late June 2020 have lowered the total amount of activity recorded for the
two quarters from January to March 2020 and April to June 2020 compared to what would
otherwise have been the case.
Following this, there was a phased re-start of supply activity, in which the construction
sector moved into Phase 4 of the Restart Plan in mid July 2020. This allowed for sites to
work up to a steady state operation using physical distancing, barriers, or controlled close
working with PPE, but in some cases may result in fewer workforce staff on site to ensure
safe working and physical distancing. In addition to this, some work on new approvals may
have been affected over this period by the furloughing of some social landlord and
construction sector staff.
Table 6 below shows that in the latest quarter April to June 2021, 1,063 homes were
approved, 1,854 homes were started, and 1,595 homes were completed. The levels of
approvals, starts and completions are all higher than in the same period in the previous
year, during which housebuilding activity was largely paused due to lockdown measures,
with approvals being 9% (90 homes) higher, starts being over double (105%, or by 949
homes) and completions being over eight times higher than in April to June 2020 (710%,
or by 1,398 homes).
Over the latest year to end June 2021, the number of homes approved and completed in
the year to June 2021 fell by 36% (4,404 homes) to 7,972 approvals and 5% (374 homes)
to 7,864 completions, compared with the year to end June 2020. Starts have increased by
283% (288 homes) in the year to end June 2021 compared to the previous year. Annual
figures have been affected by the lockdown measures in place between mid-March and
late June 2020 , in which non-essential construction activity stopped and home buyers
were advised to delay moving to a new home where possible, after which there has been
a phased re-start of supply activity.
Table 6 – Affordable Housing Supply to June 2021
Affordable housing Approvals Starts Completions
supply homes
Quarter Apr to Jun 2015 924 1,318 1,194
Quarter Apr to Jun 2016 1,205 1,899 1,782
Quarter Apr to Jun 2017 1.518 2,445 1,659
Quarter Apr to Jun 2018 1,773 2,492 1,541
Quarter Apr to Jun 2019 1,483 2,135 1,255
Quarter Apr to Jun 2020 973 905 197
Quarter Apr to Jun 2021 1,063 1,854 1,595
Change over latest year +90 +949 +1,398
Change (%) over latest year +9% +105% +710%
Year to Jun 2015 6,378 6,473 6,796
Year to Jun 2016 8,226 8,263 7,100
Year to Jun 2017 10,674 9,939 7,321
Year to Jun 2018 11,932 10,616 8,460
Year to Jun 2019 10,840 10,515 9,283
Year to Jun 2020 12,376 10,815 8,238
Year to Jun 2021 7,972 11,097 7,864
Change over latest year -4,404 +282 -374
Change (%) over latest year -36% +3% -5%
Charts 11a to 11c below present quarterly trends in the number of approvals, starts and
completions from January 2018 up to end June 2021.
29Chart 11a: 1,063 affordable homes were approved in Apr-Jun 2021, 90 (9%) more than the
same quarter in the previous year, during which activity was largely paused due to
lockdown measures, but below equivalent Apr-Jun levels in 2018 and 2019
Chart 11b: The 1,854 affordable homes started in Apr-Jun 2021 is over double the amount
seen in the same quarter in the previous year, during which activity was largely paused due
to lockdown measures, but below equivalent Apr-Jun levels in 2018 and 2019
30Chart 11c: There were 1,595 affordable homes completed in Apr-Jun 2021 compared the 197
homes completed in the same quarter in the previous year, during which activity was
largely paused due to lockdown measures, and also higher than in equivalent quarters in
2018 and 2019
Chart 12 below shows that the numbers of affordable homes approved and completed
have decreased on an annual basis over the latest year to end March 2021 but the
number of starts has increased in the same time period. In the year to end June 2021,
7,972 affordable homes were approved, a decrease of 4,004 homes (36%) on the
previous year, and 7,864 homes were completed, a decrease of 374 homes (5%), whilst
11,097 homes were started, an increase of 282 homes (3%).
31Chart 12: Levels of affordable homes approved and completed in the year to end June 2021
have both decreased whereas the level of affordable homes started has increased
compared to the same period in 2020
Charts 13 to 15 below present information on trends in affordable housing supply by type.
Chart 13 shows that total affordable housing supply programme approvals decreased by
36% between 2020 and 2021 (years to end June). In the latest year 2021, social rent
approvals accounted for 76% of all approvals, with affordable rent and affordable home
ownership each making up 12% of the remaining total.
In the year to end June 2021, there were 6,023 homes approved for social rent, a
decrease of 38% (3,692 homes) on the same period in 2020. There were 991 approvals
for affordable rent, a decrease of 30% (420 homes), and 958 homes were approved for
affordable home ownership, a drop of 23% (292 homes).
Chart 13: In the latest year to end June 2021, there have been decreases in the number of
Affordable Housing Supply approvals for social rent (by 38% or 3,692 homes), affordable
rent (by 30% or 420 homes) and affordable home ownership (by 23% or 292 homes),
compared to the same period in 2020
32Chart 14 illustrates that total affordable housing supply programme starts increased by 3%
between 2020 and 2021 (years to end June). In the latest year, social rent starts
accounted for 75% of all starts, with affordable rent and affordable home ownership
making up 15% and 10% of the total, respectively.
In the year to end June 2021, there were 8,356 starts for social rent, an increase of 5%
(405 homes) on the previous year. There were 1,621 homes started for affordable rent, a
drop of 9% (157 homes), and 1,120 homes were started for affordable home ownership,
an increase of 3% (34 homes).
Chart 14: In the latest year to end June 2021, there have been increases in the number of
Affordable Housing Supply starts for social rent (by 5% or 405 homes) and affordable home
ownership (by 3% or 34 homes), but a decrease in the number of starts for affordable rent
(by 9% or 157 homes), compared to the same period in 2020
Chart 15 shows that total affordable housing supply programme completions decreased by
5% between 2020 and 2021 (years to end June). In the latest year, social rent completions
accounted for 71% of all completions, with affordable rent and affordable home ownership
making up 15% and 14% of the total, respectively.
In the year to end June 2021, there were 5,574 homes completed for social rent, a
decrease of 11% (701 homes) on the previous year. There were 1,205 affordable rent
homes completed, an increase of 48% (390 homes), and 1,085 homes completed for
affordable home ownership, a decrease of 5% (63 homes).
33Chart 15: In the latest year to end June 2021, there have been decreases in the number of
Affordable Housing Supply completions for social rent (by 11% or 701 homes) and
affordable home ownership (by 5% or 63 homes), but an increase in the number of
completions for affordable rent (by 48% or 390 homes), compared to the same period in
2020
Comparison with the rest of the UK from 2007/08 to 2020/21
This section compares how the level of affordable housing supply per head of population
varies between Scotland and other UK countries, to help meet user demand for cross
country analysis.
Each of the countries of the UK produces their own statistics on affordable housing
supply5. Whilst there are some differences in the detail of affordable housing definitions
and products used by each country, some comparisons can be made on how affordable
housing supply varies per head of population.
Chart 16 below illustrates how the figures per 10,000 population have varied across the
2007/08 to 2020/21 period for Scotland, England, Wales and Northern Ireland.
Between 2007/08 and 2019/20, the latest year in which there are figures available across
all UK countries, the annual average supply of affordable housing per head of population
in Scotland has been 13.8 homes per 10,000 population, higher than England (9.7 homes
per 10,000 population), Wales (7.7 homes per 10,000 population), and Northern Ireland
(13.0 homes per 10,000 population – average across the years 2010/11 to 2019/20).
Scotland has had annual rates above all other UK countries in most years since 2007/08,
except for during 2012/13 to 2014/15, in which the rates for Northern Ireland were higher.
5
Affordable Housing Supply figures for England, Affordable Housing Supply figures for Wales, Affordable
Housing Supply figures for Northern Ireland
34The 9,296 affordable homes completed in Scotland in the financial year 2019/20 equates
to a rate of 17.0 homes delivered per 10,000 population. This is above the rate of 10.2 in
England and the rate of 9.3 in Wales and 14.4 in Northern Ireland6.
The 6,466 affordable homes completed in in Scotland in the latest financial year 2020/21
equates to a rate of 11.8 homes delivered per 10,000 population, the lowest rate of homes
delivered in Scotland since 2012/13, athough this figure will have been impacted by the
lockdown measures in place from mid-March to late June 2020, along with the subsequent
phased restart of supply activity.
Chart 16: Total Affordable Housing Supply Completions as a rate per 10,000 population -
Scotland has had annual rates above all other UK countries in each year since 2007/08,
except during 2012/13 to 2014/15
Affordable housing supply figures for 2020/21 for England, Wales and Northern Ireland are
not yet available, however these will be added to Chart 16 in future publications when the
figures are published
Note that the statistics for England and Wales both include developer-funded Section 106
supply, although for England it is thought that some will be missed as local authorities are
not aware of it all. Northern Ireland does not currently have an equivalent mechanism.
Data for Scotland include Section 75 units receiving some form of government funding.
Data are not available to estimate the number of affordable homes delivered without
central government funding in Scotland, but it is thought that the numbers of these homes
may be relatively low based on current estimates of the number of funded Affordable and
Section 75 homes being delivered.
In addition to the differences in total affordable supply between each country, there are
also some differences in the use of different affordable housing products within the mix of
6
Note that the way in which we calculate total affordable housing supply figures for Northern Ireland was
revised in the Housing Statistics Quarterly Update for December 2020 compared to previous publications.
This has increased the level of the Northern Ireland total affordable housing supply figures compared to the
figures previously published by an average of 25% across the period 2010/11 to 2018/19.
35overall affordable housing in each country. For example, in England in recent years there
has been a greater use of affordable / intermediate rent compared to social rent. Therefore
when looking over the four years to 2019/20, in England there have been on average 5.0
affordable / intermediate rent homes completed per 10,000 head of population and 1.1
social rented homes completed 10,000 per-head of population. This compares to a rate of
1.9 for affordable rent homes and a rate of 10.8 for social rented homes in Scotland.
8. Notes
This document should be read along with the explanatory notes on data sources and
quality can be found in the Housing Statistics webpages.
Starts and completions
The statistics break down new build construction activity into private-led and social sector
starts and completions, with the social sector further broken down between local authority
and housing association activity.
The figures are sourced from local authority administrative systems and the Scottish
Government Housing and Regeneration Programme (HARP) system. Private sector
construction activity includes not only homes built for private sale but also some homes
which are used in the affordable housing sector and self-build activity by local builders.
New build information is provided for starts (when the foundations are begun) and
completions (when a building inspector deems the property complete).
In general, the number of starts will be a strong indicator of the likely trend in completions
over the longer term, but there may well be differences over the short and medium term
depending on factors such as the housing market, economic climate, access to finance,
and speed of construction.
A wide range of factors can influence the length of time it takes for a new private dwelling
to be constructed, including the type of property (house, flat etc.), and the overall size of
the site. Depending on the size of the site, the average time from start to completion of the
entire site can range from anywhere between around 1.5 years to 2.75 years. Individual
homes, or blocks of homes, might be completed in shorter timescales if parts of the site
are completed in advance of the rest.
Comparing over time
This document generally compares the latest quarter’s figures with those for the equivalent
quarter in previous years, or it compares the latest 12 month period with the previous one.
Housing Statistics across the UK
Information on housing statistics developments across the UK is available on the
Government Statistical Service (GSS) webpages.
This includes material such as:
• The Cross-Government Housing, Homelessness and Planning Statistics Steering
Group helps set the strategic direction for UK collaboration to improve the overall
36picture of housing statistics, including representatives from the devolved
administrations.
• A GSS housing and planning statistics interactive tool, which contain a searchable
database of all housing and planning statistics produced by UK public bodies and
devolved administrations, along with a summary of the UK housing topic landscape.
• Topic reports on cross-UK areas such as on Affordable Housing Statistics.
• A report on the definitions, terminology and feasibility of harmonisation of affordable
housing statistics across the UK.
37A National Statistics publication for Scotland
The United Kingdom Statistics Authority has designated these statistics as National
Statistics, in accordance with the Statistics and Registration Service Act 2007 and
signifying compliance with the Code of Practice for Official Statistics.
Some presentational changes have been made to this publication, such as the
shortening of main findings, the addition of detailed summary tables at the start of
each section and amending the commentary to emphasise trends. We would
welcome feedback on these changes via the contact details below.
Designation can be interpreted to mean that the statistics: meet identified user
needs; are produced, managed and disseminated to high standards; and are
explained well.
Correspondence and enquiries
For enquiries about this publication please contact:
Lyndsey Middleton,
Communities Analysis Division,
Telephone: 0131 244 7229,
e-mail: housingstatistics@gov.scot
For general enquiries about Scottish Government statistics please contact:
Office of the Chief Statistician, Telephone: 0131 244 0442,
e-mail: statistics.enquiries@scotland.gsi.gov.uk
How to access background or source data
The data collected for this statistical bulletin may be made available on request,
subject to consideration of legal and ethical factors. Please contact
housingstatistics@gov.scot for further information.
Complaints and suggestions
If you are not satisfied with our service or have any comments or suggestions,
please write to the Chief Statistician, 3WR, St Andrews House, Edinburgh, EH1
3DG, Telephone: (0131) 244 0302, e-mail statistics.enquiries@gov.scot.
If you would like to be consulted about statistical collections or receive notification
of publications, please register your interest through the ScotStat register.
Details of forthcoming publications can be found on the Scottish Government
statistics and research pages.
ISBN 978-1-80201-309-2
Crown Copyright
You may use or re-use this information (not including logos) free of charge in any
format or medium, under the terms of the Open Government Licence.
Produced for The Scottish Government by APS Group Scotland, 21 Tennant Street, Edinburgh EH6 5NA
PPDAS928566 (09/21)
38You can also read