Solar Flares and the Chromosphere
←
→
Page content transcription
If your browser does not render page correctly, please read the page content below
Solar Flares and the Chromosphere
A white paper for the Decadal Survey

H. S. Hudson, L. Fletcher, R. Turkmani, S. L. Hawley, A. F. Kowalski, A. Berlicki, P.
Heinzel

Background:
The solar chromosphere is at the center of many of the debates in solar physics.
Highly complex, even in the quietest zones, the chromosphere is not an area that is
easy to grasp. Across its few-Mm height it jumps from high plasma beta to low
plasma beta, from neutral to ionized, from collisional to collisionless, becomes opti-
cally thin in the UV and mm-waves, and increases in temperature by almost three
decades. It is no wonder that numerous instabilities occur. As observations improve,
for example with the Hinode mission, these complexities become more apparent.
Magnetic reconnection also occurs freely in this domain.

The chromosphere deserves attention
                                                       Basic Characteristics
in our attempts to find answers to the
riddles of the corona, including flares.
                                             • The chromosphere and transition re-
Understanding its magnetic complexity
                                             gion anchor all coronal phenomena.
is a key to coronal modeling –
particularly measurements of the
                                             • Current systems that stress the coronal
vector field in the upper chromosphere
                                             field must penetrate the chromosphere.
are     needed       for   a    reliable
reconstruction of coronal magnetic
                                             • A complex system of flows, shocks,
fields (e.g. DeRosa et al. 2009). The
                                             jets, and waves originates in the chro-
main provider of coronal heating may
                                             mosphere
be in the transition region and upper
chromosphere (Aschwanden et al
                                             • Chromospheric radiation contains most
2007), and new evidence suggests
                                             of the flare luminosity
that the chromosphere is the root of
solar wind acceleration (De Pontieu et
al. 2007).

The need for chromospheric observations of flares:
The solar flare spectrum peaks in the optical and ultraviolet, making the solar chro-
mosphere the dominant source of radiation in a solar flare (Canfield et al 1986,
Neidig 1989, Woods et al. 2004). In other words, solar flares radiate most of their lu-
minous energy in the chromosphere. The chromosphere is where electrons acceler-
ated in flares lose their energy, and may also play a role in their acceleration
(Fletcher & Hudson 2008, Brown et al. 2009). Yet despite its evident importance, ob-
servational knowledge of this region is relatively sparse. From spectroscopic obser-
vations of much more powerful stellar flares, in which the optical flare output domi-
nates that of the whole star, we know the powerful diagnostic potential of chromos-
pheric flare radiation, and existing observations already point to the utility of spatially-
resolved optical/UV radiation in decoding the evolving flare magnetic field. There is a
pressing need to return to the chromosphere to progress on understanding solar
flares.
Current Observations:
Current ground-based efforts utilize small custom instruments on mid-sized tele-
copes and concentrate on (1) patrol images (Hα, He 10830A, white light) and (2)
some high resolution narrow-band spectroscopy of a few spectral lines (e.g. Hα, Ca
8542). There is little effort to conduct studies of chromospheric flares from space,
though there has been notable success in targeted programs using TRACE, and
serendipitous observations with Hinode, which have firmly established the relation-
ship between the optical (‘white light’) footpoint, and the sites of strong non-thermal
bremsstrahlung emission. It is to be expected that the Solar Dynamics Observatory
will also reveal the detailed morphological evolution of ribbons, and possibly give
some insight also into the vertical structure of the bright ribbon sources.
Information from imaging:
It is well established that solar flare footpoints are very compact and evolve rapidly in
position and intensity, reflecting in some detail the progression of flare energy re-
lease. Flare chromospheric ribbons are much more extended. Interpreted as the
chromospheric intersections of evolving
magnetic (quasi-) separatrix surfaces,
flare ribbons allow the progression of field
restructuring to be followed (Masson et al.
2009). Chromospheric flares have of
course long been beautifully observed in H
alpha, but also now in other lines such as
the 304nm image from Hinode SDO (Fig-
ure 1). These show abundant fine detail
from 3D structures. Flare ribbons give in-
sight into both energetics and magnetic
restructuring, in the impulsive and the
gradual phase.
Figure 1 – chromospheric flare ribbons
observed with the Hinode AIA in the
304nm channel (He II)
Compared to chromospheric flare ribbons, the optical
flare footpoints are very little studied in the recent
era. However, it is known that a very precise timing
and spatial relationship to the hard X-rays (Fig 2) and
thus the flare electrons – the major energy-carrying
component (Metcalf et al. 2003, Hudson et al 2006,
Fletcher et al. 2007, Watanabe et al 2009). Relatively
easily observed compared to hard X-rays, they pro-
vide a view of the total energy of a flare complemen-
tary to that provided by HXR radiation. White-light
emission had previously been thought to be a ‘big
flare’ phenomenon, but has now been seen even in
small C-class events (Hudson et al 2006, Jess et al.
2009).
Figure 2: RHESSI 25-50 keV contours of a flare (orange) and regions of strongest WL contrast
(blue). There is an excellent spatial and temporal correlation, but the WL readily shows detail at
the arcsecond level which remains difficult to obtain with HXRs. Image from Fletcher et al. 2007Information from spectroscopy:
During a flare, the chromosphere brightens in lines and continuum. At its most basic,
continuum spectroscopic information is required for a proper assessment of the total
radiative intensity in flares, which has so far been obtained only in a small number of
events. Of particular interest is the identification (Neidig, 1989) of a Paschen jump
(indicating the presence of the Paschen continuum from free-bound emission in the
optical part of the spectrum) and flare-related changes to the Balmer and Paschen
jumps in the flare spectrum, indicating variations in ionization fraction). Enhanced
continuum shortwards of the Paschen jump may additional suggest increased Hα
opacity, and photospheric excitation. This basic measurement has been made in
very few flares (see e.g. Neidig 1983, Mauas 1990), and usually not for the strongest
impulsive-phase optical flare kernels, but has major implications for the energy
transport model (Canfield 1986, Neidig 1989, Fletcher et al 2007).
The chromospheric lines are potentially rich in diagnostic information. For example,
Metcalf et al (1990a,b) have used Mg I lines to probe the temperature and density
structure of the temperature minimum region. The Ca 8542 infrared triplet has been
frequently used in stellar studies to diagnose the chromospheric temperature gradi-
ent, and the Balmer lines provide information on electron density (e.g. Svestka,
1976), and potentially also diagnostics of non-thermal electron distributions (Zhark-
ova & Kobylinskii 1993, Kasparova & Heinzel 2002.) It has also been suggested that
Lyα can also be used to detect flare proton fluxes in the 10-1000 keV energy range,
with charge exchange on ambient neutrals resulting in shifted emission lines (Orrall &
Zirker 1976). Never detected on the Sun, but known analogously in the terrestrial
aurora, this would be a unique diagnostic of a major flare energy component as yet
entirely invisible to us. The Balmer series line widths diagnose the electron density
(via Stark broadening, e.g. Suemoto & Hiei 1959, Johns-Krull et al. 1997), and analy-
sis implies lines imply that these flare lines are formed at electron densities in excess
of 1013 cm-3 (e.g. Johns-Krull et al 1997), meaning within a transient condensation.
From spectroscopy we can also image plasma flows, extended to 3D with modeling.
The poverty of solar flare chromospheric spectra:
It is an embarrassment that there is still no imaging spectroscopy of solar flares from
space, although the IRIS instrument will soon be available. There is also precious
little in the way of ground-based spectra – regular measurements have not been
made since the 1980s and early 90s. HMI on SDO is now providing imaging spec-
troscopy of a single photospheric line, Fe I 6173 A, and the EVE instrument provides
full EUV spectra but of the Sun as a
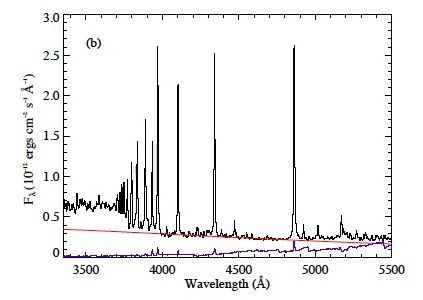
star. In the meanwhile, Figure 3 sug-
gests the power of what may emerge
from better spectroscopy: this is a stel-
lar flare spectrum dominated by the
Balmer series, but with white-light con-
tinuum (and photospheric lines) in the
background (Kowalski et al. 2010).
Fig. 3 The blue spectrum of the flare star
YZ CMi (Kowalski et al. 2010). The red line
indicates a hot blackbody component; most
of the rest of the flare excess emission is
the Balmer series plus the Balmer and
Paschen continuum. The blue line is the
quiescent star.
We do not have anywhere near compara-comparable spectra for solar flares. Optical spectroscopic observations of a flare on the dM4.5e star YZ CMi have shown that two components consisting of a Balmer continuum and a hot (T~10,000 K) blackbody contribute to the total white light con- tinuum in M dwarf flares (Kowalski et al 2010, Figure 3). These components may have similar solar counterparts, but unfortunately, very few broad-coverage spectra of the Sun during flares are available to compare with stellar spectra. The few that exist date back to 1970-80’s (Machado & Rust 1974, Neidig 1983, Donati-Falchi et al 1984). None of these data can currently be used to determine what emission type(s) makes up white light on the Sun. In lieu of taking broad wavelength-coverage solar flare spectra due to a lack of in- strumentation, a common set of narrow-band continuum filters have been developed to directly compare solar and stellar white light. These filters are centered at 3500A and 4170A, thereby isolating continuum from line emission on both sides of the Balmer jump. The same set of filters is employed on the stellar instrument, ULTRA- CAM on the New Technology Telescope at La Silla, and on a solar instrument, ROSA at the Dunn Solar Telescope. The characteristics of the flare emission in these filters can be used to compare the spectral components in the white light con- tinuum. A critical comparison of the flare continuum in the optical and near-UV are needed to determine if the same disagreement exists between solar flare chromos- pheric models (e.g., Allred et al 2005) and observations. Implications for flare transport and acceleration: Line spectra give information about the physical conditions at the location where the line is excited, and can thus be used to understand how energy propagates through the chromosphere. At present, our understanding of solar flare particle acceleration rests on the collisional thick-target interpretation of a particle beam accelerated in the corona and propagating to the chromosphere where it loses energy monotonically with depth, due to Coulomb collisions. This makes firm predictions about the location of beam stopping, and chromospheric heating, ionization and line excitation. Sys- tematic optical observations can confront this, and other, models. Line and contin- uum observations so far imply significant energy deposited in dense layers of the chromosphere, and while the total energy requirements can be met by the collisional thick target inferences (e.g. Watanabe et al 2010), in some cases the implication that the energy is concentrated at electron energies which cannot penetrate sufficiently deep in the chromosphere (Fletcher et al. 2007). Plasma physics: The physics of the chromosphere differs from that of the corona and photosphere because of its low level of ionization and the dominance of ion-neutral coupling at lower altitudes. The Earth’s ionosphere has some points of analogy. The current sys- tems that support coronal energy storage as non-potential structures must flow through the chromosphere, resulting in a much more complicated pattern of electrical conductivity than common modeling approaches (e.g. “line-tying”) can comprehend. It would be a fair criticism that most flare modeling at present simply ignores this es- sential physics, as well as other factors likely to be important in chromospheric and transition-region dynamics. Seismic waves and Moreton waves: Large-scale wave structures originate in the lower solar atmosphere during flares. These include the global coronal waves responsible for radio type II bursts and More- ton waves. The seismic waves in the solar interior (Kosovichev and Zharkova 1998) now have been shown to be relatively commonplace (e.g. Donea & Lindsey 2005). Each of the global wave types offers powerful diagnostic information regarding the early development of the flare/CME process.
New observations needed:
Flare research in the fundamental domain of the chromosphere and transition region
has only begun to advance beyond the classical Hα stage. The text box summarizes
the key observational goals for a new era in flare research. As Hinode and SDO
demonstrate, space-based observations offer tremendous advantages in image sta-
bility, image dynamic range, and seeing. For the chromosphere and transition region,
space also offers access to the key flare radiations at short wavelengths: spectra
such as those of Figure 1 suggest temperatures above 104 K for the recombination-
radiation component, the dominant flare luminosity.
        We also recognize that ground-based facilities such as ATST will exist and
produce key observations, and that ALMA (Karlicky et al. 2010) will bring an entirely
new perspective of potentially great power.

                              Technical Requirements

 • Imaging at high spatial (0.1’’) and temporal (1 s) resolution in key optical and UV
 lines and continua, and with sufficient image dynamic range for flares.

 • Lyα wing observations of charge-exchange signatures.

 • Imaging spectroscopy of the chromosphere and transition region with full spec-
 tral coverage in optical-UV

 • Modeling outside the “hydro-magnetic box”: e.g., two-fluid, kinetic non-
 equilibrium, 3D radiation hydrodynamics etc.

References:
Aschwanden, M.J., Winebarger, A., Tsiklauri, D., and Peter, H. 2007, ApJ 659, 1673
Allred, J.C. et al 2006, ApJ 644, 484
Allred, J.C. et al 2005 ApJ 630, 573
Brown, J. C., Turkmani, R., Kontar, E. P., MacKinnon, A. L, Vlahos, L., 2009 A&A
    508, 993
Berlicki, A. et al., 2008 A&A, 490, 315
Canfield, R. C., Bely-Dubau, F., Brown, J. C. et al., 1986, NASA Conf. Publ., NASA
    CP-2439, Ch 2.
De Pontieu et al. 2007, Science 318, 1574
De Rosa, M.L et al. 2009, ApJ 696, 1780
Donati-Falchi, A. et al 1984 A&A 131, 256
Donea, A. and Lindsey, C. 2005, ApJ 630, 1168
Eason, E.L.E. et al 1992, AJ 104, 1161
Fletcher, L., Hannah, I. G., Hudson, H. S., Metcalf, T. R., 2007, ApJ 656, 1187.
Fletcher, L., Hudson, H. S., 2008, ApJ 675, 1645
Fuhrmeister, B. et al 2008, A&A 487, 293
Hawley, S.L. & Pettersen, B.R. 1991, ApJ 378, 725
Hawley, S.L. et al 2003, ApJ 597, 535
Hudson, H. S., Wolfson, C. J., Metcalf, T. R. 2006, Sol. Phys. 234, 79
Jess, D. B., Mathioudakis, M., Crockett, P. J., Keenan, F.P. 2008, AoJ 688, L119
Johns-Krull, C. M., Hawley, S. L., Basri, G., Valenti, J. A., 1997, ApJS 112,221
Karlicky, M., Dabrowski, B., Barta, M., and Heinzel, P. 2010, Solar Phys. (in press)
Kasparova, J., Varady, M., Heinzel, P., Karlicky, M., Moravec, F. 2009, A& 499, 923
Kosovichev, A., and Zharkova, V. 1998, Nature 393, 317
Kowalski, A.F., Hawley, S.L., Holtzman, J.A., Wisniewski, J.P., and Hilton, E.J.,
2010, ApJL 714, 98.
Machado, M.E. & Rust, D.M. 1974 Sol. Phys. 38, 499
Masson, S., Pariat, E., Aulanier, G., Schrijver, C. J. 2009, ApJ 700, 559
Mauas, P.,1990. ApJS 74, 609
Metcalf, T. R., Canfield, R. C., Avrett, E. H., Metcalf, F. T., 1990a, ApJ 350, 463
Metcalf, T. R., Canfield, R. C., Saba, J. R., 1990b, ApJ 365, 391
Metcalf, T. R., Alexander, D., Hudson, H. S., Longcope, D. W. 2003, ApJ 595, 483
Neidig, D. F., 1983, Sol. Phys. 85, 285
Neidig, D. F., 1989, Sol. Phys. 121, 261
Orrall. F. Q., Zirker, J. B.,1976 ApJ 208, 618.
Suemoto, Z. Hiei, E.,1959 PASJ 11, 185
Svestka, Z. F., 1976, Solar Flares
Watanabe, K., Krucker, S., Hudson, H. et al, 2010 ApJ 715,651
Woods, T. N., Eparvier, F. G., Fontenla, J., 2004, GRL 3110802
Zharkova, V.V., Kobylnskii, V. A., 1993, Sol Phys 143, 259.
Zirin, H., and Tanaka, K. 1973, Sol Phys 32, 173You can also read