Water Quality Index (WQI) classification of rivers in agriculture and aquaculture catchments
←
→
Page content transcription
If your browser does not render page correctly, please read the page content below
IOP Conference Series: Earth and Environmental Science

PAPER • OPEN ACCESS

Water Quality Index (WQI) classification of rivers in agriculture and
aquaculture catchments
To cite this article: Fauzi Baharudin et al 2021 IOP Conf. Ser.: Earth Environ. Sci. 646 012023

View the article online for updates and enhancements.

 This content was downloaded from IP address 46.4.80.155 on 19/09/2021 at 02:08

International Conference on Civil and Environmental Engineering IOP Publishing
IOP Conf. Series: Earth and Environmental Science 646 (2021) 012023 doi:10.1088/1755-1315/646/1/012023

Water Quality Index (WQI) classification of rivers in
agriculture and aquaculture catchments

 Fauzi Baharudin1, Jalina Kassim1, Siti Nurulhuda Mohd Imran1 and Mahyun Ab
 Wahab2
 1
 Faculty of Civil Engineering, Universiti Teknologi MARA, 40450 Shah Alam, Selangor,
 Malaysia
 2
 Faculty of Civil Engineering Technology, Universiti Malaysia Perlis, Perlis, Malaysia

 fauzi1956@uitm.edu.my

 Abstract. Water quality is always affected by a wide range of human and natural factors which
 is commonly a result of mismanagement of land, dumping of rubbish and unintentional
 introduction of chemical material into the river. The rivers in Kuala Selangor and Sabak Bernam
 districts which lie in active agriculture and aquaculture activities are also not spared from
 pollution. This study focused on water quality investigation and source of pollution identification
 in seven rivers in Kuala Selangor and Sabak Bernam. The water quality parameters investigated
 were Dissolved Oxygen (DO), Biochemical Oxygen Demand (BOD), Chemical Oxygen
 Demand (COD), Suspended Solids (SS), pH and Ammoniacal Nitrogen (AN). Water Quality
 Index (WQI) was then calculated based on Department of Environmental guidelines. Based on
 the WQI results, Sungai Selangor and Sungai Tengi were classified as Class III showing slightly
 polluted, while Sungai Buloh, Sungai Nibong, Sungai Haji Dorani, Sungai Besar (Bagan Cina),
 Sungai Besar (Parit Timur) and Sungai Bernam were classified as Class IV or polluted. The
 industrial, residential, agricultural activities in the surrounding area of the rivers that were
 suspected of being sources of river pollution were also identified.

1. Introduction
Water is an essential element in nature which moves all walk of life. Through the evolution and
developments of various human activities, the quality of water has become a pivotal attention from time
to time. When the quantities of pollutants in the water are abundance, the treatment process will take a
longer time and can be difficult. Water quality is always affected by a wide range of natural and human
factors. Throughout the ages, nature has been able to balance the ecology such that river pollution,
caused by natural factors such as landslides and annual flooding, has been kept to a manageable level.
However, when mankind is brought into the equation, the equilibrium can be shattered.
 River pollution may increase steadily due to various factors. One of the causes of pollution is the
discharge of untreated domestic sewage into rivers. Discharging wastewater into rivers without prior
treatment process will cause the water quality of the river to drop [1]. This will then affect the aquatic
ecosystems and if contaminated water is consumed by humans, it will lead to numbers of health risks,
particularly in human diseases [2]. Agricultural activity is also one of the sources identified as a source
of river pollution, through the excessive use of fertilizer and pesticide which eventually became source
of nutrients abundance in river system [3, 4]. Focus of this study is on the investigation of the quality of
the water in the river and identification of the sources that affect the quality of water in the river for

 Content from this work may be used under the terms of the Creative Commons Attribution 3.0 licence. Any further distribution
 of this work must maintain attribution to the author(s) and the title of the work, journal citation and DOI.
Published under licence by IOP Publishing Ltd 1
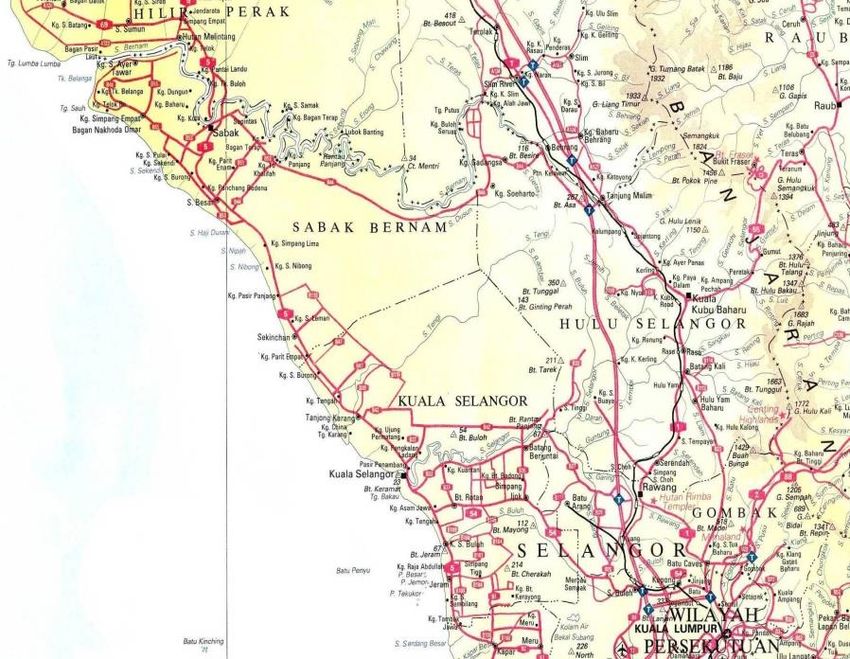
International Conference on Civil and Environmental Engineering IOP Publishing
IOP Conf. Series: Earth and Environmental Science 646 (2021) 012023 doi:10.1088/1755-1315/646/1/012023

Sabak Bernam and Kuala Selangor area, where the quality of water in the river will be measured in
specified parameters.
 There are several criteria and characteristics need to be addressed in classifying water quality. Tyagi
studied numbers of water quality equations and highlighted the development of a new and globally
accepted Water Quality Index in a simplified format, which may be used at large and could represent
the reliable picture of water quality [5]. Another study which is related to development of a water quality
index was carried out by [6]. The study analyzed 28 parameters related to water quality and then reduced
to 9 parameters based on Principal Component Analysis (PCA). The final shortlisted 9 parameters were
Dissolved Oxygen (DO), pH, Conductivity, Biochemical Oxygen Demand (BOD), Total Coliform (TC),
Chlorides, Magnesium, Sulphate, Total Dissolved Solids (TDS). PCA utilizes the variance in the entire
data set and projects it in new dimensions, thereby reducing the number of parameters but retaining
maximum variance. The use of statistical techniques in WQI development makes it less biased and more
objective in nature and forms the basis of development of a reliable Water Quality Index (WQI) in future.
 Bao conducted an experimental investigation to determine the value of BOD, COD, Suspended
Solids (SS), Ammoniacal Nitrogen (AN), pH and Dissolved Oxygen (DO) during high tide and low tide
[7]. The results indicated that the impact of activities such as residential, industrial, and commercial and
agriculture have caused environmental degradation to Kuantan River and its adjacent areas. [8]Hussain
& Ismail (2001) experimentally investigated the river pollution that contributed to the deterioration of
water quality at Sungai Pasir, Sungai Petani, Kedah. The results achieved indicated this river categorised
as slightly polluted and polluted which requires efficient operation before being supply as source of
drinking water. Therefore, the objectives of this study are (1) to investigate the water quality of river,
(2) to establish the water quality index (WQI) based on Malaysian DOE Standard and (3) to establish
possible sources of pollution in Kuala Selangor and Sabak Bernam area.

2. Methodology
The process consisted of a preliminary investigation and detailed site investigation of the study area to
get an overview so that more detailed planning could be done to ensure smooth operations. The best
point for sampling was also determined, including checking for all parameters required for this study.
 The location of this study was in Kuala Selangor and Sabak Bernam. Both districts are well known
for its active agriculture and aquaculture activities. In Kuala Selangor there were three (3) rivers selected
for this study. The first river was Sungai Buloh which is close to the border of Gombak district. It is
located 33km from Shah Alam City, and is under the Shah Alam City Council. The second river was
Sungai Selangor which runs from the east where the town of Kuala Kubu Bharu is located, and emptying
into the Straits of Malacca located in the west, besides the town of Kuala Selangor. This river runs
through several residential areas and it was observed that there were major constructions of buildings
such as supermarkets along its banks and small wharves for small ships to berth. The last river chosen
for Kuala Selangor was Sungai Tengi. This river runs through residential and commercial areas such as
the FELDA Sungai Tengi and is adjacent to the border of Perak State.
 Four (4) rivers were selected for this study in Sabak Bernam. The first river was Batu 23 Sungai
Nibong which is 125 kilometers from Kuala Lumpur; villagers’ houses were located along the river. The
second river selected was Sungai Haji Dorani which runs beside a small holiday village with chalets and
seafood restaurants within the Sabak Bernam District. The third river chosen was Sungai Besar in the
district of Sabak Bernam and it is 120km north-west of Kuala Lumpur. The majority of villagers in this
district are fisherman and farmers who reside in the vicinity of the banks of the river where it is
convenient to land their catch of fish and tend to their paddy fields respectively. The last river selected
was Sungai Bernam, bordering the states of Selangor and Perak; it is the largest river in Sabak Bernam.
Figure 1 shows the seven (7) rivers that were selected for this study.

 2
International Conference on Civil and Environmental Engineering IOP Publishing
IOP Conf. Series: Earth and Environmental Science 646 (2021) 012023 doi:10.1088/1755-1315/646/1/012023

 Sungai Besar Sungai Bernam

 Sungai Tengi

 Sungai Haji
 Dorani
 Sungai Selangor

 Sungai
 Nibong Sungai
 Buluh

 Figure1. Location of selected rivers in this study.

 Sampling was done by way of grab sampling technique and brought back to the laboratory for testing.
In ensuring accuracy of results when analyzing the samples, a cardinal rule was adhered to: the sample
must be in the original condition as when it was first taken. Therefore the samples were kept in boxes
that contained ice whilst being transported to the laboratory for testing. The water samples were analyzed
in the Environmental Laboratory of the Faculty of Civil Engineering, Universiti Teknologi Mara
(UiTM).
 Samples were analyzed for Dissolved Oxygen (DO), Biochemical Oxygen Demand (BOD),
Chemical Oxygen Demand (COD), Suspended Solid (SS), Ammoniacal Nitrogen (AN) and pH. DO was
determined by using DO meter through in-situ measurement. The Biochemical Oxygen Demand (BOD)
was determined by following the procedure in Standard Method APHA 5210-B [8]. Chemical Oxygen
Demand (COD) were analyzed by Reactor and Spectrophotometer with the addition of Digestion
Reagent as a reagent. Suspended Solid (SS) and Ammoniacal Nitrogen (AN) was determined by using
spectrophotometer and also Nessler ammonia reagent which consisted undertaken using the
spectrophotometer. The Nessler Reagent, Mineral Stabilizer and Polyvinyl Alcohol Dispersing Agent.
PH determination was carried out using pH meter. Each of the parameters was analyzed for all selected
rivers and classification the quality of water for the river were calculated according to the Malaysian
National Water Quality Standards as in Equation 1 [9] which will give an idea about the water quality
of the selected river and this will facilitate any particular party to take appropriate actions to control the
water pollution of the river.

 = (0.22 × ) + (0.19 × ) + (0.16 × ) + (0.15 × )
 +(0.16 × ) + (0.12 × ) (1)

3. Results and discussion
Overall, the content of dissolved oxygen (DO) in all water samples was more than 7 mg/l. Changes in
value of DO usually depend on organic materials and organisms such as bacteria in the water. Figure 2
shows that Sungai Bernam had the highest value of DO which is 8.11 mg/l while the lowest DO value
was 7.83 mg/l at Sungai Buloh. The DO for Sungai Bernam was high because of its distance from
agricultural, industrial and residential areas and its surrounding area is abundant with many plants. On
the other hand, Sungai Buloh is located near the industrial and residential areas leading to low content

 3
International Conference on Civil and Environmental Engineering IOP Publishing
IOP Conf. Series: Earth and Environmental Science 646 (2021) 012023 doi:10.1088/1755-1315/646/1/012023

of DO. Possible causes are the leaked oil from the fishermen’s boats as well as the flow of untreated
water from the drains of the surrounding residential and industrial areas. Both of these causes might
carry dirt and organic matter which lower the DO values. The results show that all the rivers are classified
in Class I denoting that they still have high DO content.

 Figure 2. Dissolved Oxygen (DO) result.

 BOD values are influenced by the contents of the DO in the river. BOD increase is inversely
proportional with DO. Figure 3 shows the BOD results for all rivers that have been selected for this
study. The lowest value of BOD was 2.63 mg/l from Sungai Besar (Bagan Cina) while the Sungai
Nibong recorded the highest value of BOD at 7.49 mg/l. The increase in BOD indicated low
concentrations of DO. Sungai Nibong had a higher value of BOD due to its close proximity to an oil
palm plantation. The use of fertilizers and pesticides from the plantation produces a lot of organic
chemicals. In addition this area is also near a village whereby waste organic material from the houses in
the village flowed into the river. Sungai Besar (Bagan Cina) showed the lowest value of BOD because
it is far from any agricultural area. Thus this river is classified as class II whereby its water can be used
as a water supply for humans whilst Sungai Nibong is classified as class IV, indicating that it is not
suitable for human consumption because can cause irritations.

 4
International Conference on Civil and Environmental Engineering IOP Publishing
IOP Conf. Series: Earth and Environmental Science 646 (2021) 012023 doi:10.1088/1755-1315/646/1/012023

 Figure 3. Biochemical Oxygen Demand (BOD) result.

 Figure 4 shows the results of the COD taken from all rivers. The highest value of 123.75 mg/l was
recorded at Sungai Besar (Parit Timur) area which indicated that the river is contaminated and classified
into class V. The high value might be contributed by the use of pesticides and fertilizers in the
surrounding agriculture area particularly paddy plantation. The lowest COD was recorded at Sungai
Selangor with the value of 39.25 mg/l and classified under class III. Although this river is considered as
a main river in Selangor, it has less pollution sources from agriculture and industrial area.

 Figure 4. Chemical Oxygen Demand (COD) result.

 Figure 5 shows the Ammoniacal Nitrogen (AN) results for all selected rivers. Sungai Besar (Parit
Timur) recorded the highest value of AN which was 3.25 mg/l and regarded as class V. The value of
AN could be high when the river is near to large agricultural areas as the extensive use of fertilizers can
increase the AN content in a river. On the other hand, Sungai Selangor had the lowest value of AN which
was 1.09 mg/l and fell under class III. Sungai Selangor contained the lowest value of ammonia because

 5
International Conference on Civil and Environmental Engineering IOP Publishing
IOP Conf. Series: Earth and Environmental Science 646 (2021) 012023 doi:10.1088/1755-1315/646/1/012023

it was far from agricultural areas while the other rivers were in the vicinity of an agricultural area where
there is much use of fertilizers and pesticides.

 Figure 5. Ammoniacal Nitrogen (AN) result.

 Figure 6 shows the results of SS for rivers selected for this study. Sungai Bernam had the highest
value of SS which is 326.25 mg/l and classified as class V while Sungai Tengi had the lowest value of
SS which is 24.25 mg/l indicating a modest condition region under class II. The high SS value of Sungai
Bernam was due to it runs through a forested area, resulting in a high value of SS. High SS values might
indicate certain degree of contamination in the surrounding area and eventually can affect the overall
value of the WQI.

 Figure 6. Suspended Solid (SS) result.

 6
International Conference on Civil and Environmental Engineering IOP Publishing
IOP Conf. Series: Earth and Environmental Science 646 (2021) 012023 doi:10.1088/1755-1315/646/1/012023

 The pH value is used to show whether a river is in acidic, alkaline or neutral condition. The pH value
of water which is in the range of 6.5 to 8.5 shows better water quality, cleaner and suitable for domestic
consumption. Figure 7 shows the pH results for rivers in Kuala Selangor and Sabak Bernam. Sungai
Selangor showed the highest pH value of 7.20 due to this river being located far from any industrial
areas and it is also contains a lot of plants which helps in getting rid of heavy metals in turn helps in
increasing its pH. Sungai Nibong had the lowest pH value of 4.92 since it runs beside an oil palm
plantation and the use of chemical fertilizers and pesticides in the plantation caused an increase in the
acidity of the water in the river. The pH testing needed to be done in order to ascertain whether the rivers
were in acidic or alkaline condition. The results also showed that generally, all the rivers were in class
I, class II and class III. Sungai Selangor and Sungai Tengi had the best pH value because their pH was
close to 7 and were in almost neutral condition.

 Figure 7. pH result.

 The way WQI works is that the higher the index of a particular river, the cleaner it is. As for the final
classification, Sungai Selangor recorded the highest index at 56.67 whilst Sungai Bernam recorded the
lowest WQI at 32.91. Nevertheless, Sungai Selangor is still classified as a polluted river because the
minimum range of clean river starts from an index of 76.50. The WQI is important for river classification
in accordance with Department of Environmental (DOE) guidelines. Low WQI readings showed that
river pollution has occurred.

 7
International Conference on Civil and Environmental Engineering IOP Publishing
IOP Conf. Series: Earth and Environmental Science 646 (2021) 012023 doi:10.1088/1755-1315/646/1/012023

 Figure 8. Water Quality Index (WQI) classification for rivers in Kuala Selangor and Sabak
 Bernam.

Based on the results shown in figure 8, it can be determined that all the rivers in Kuala Selangor and
Sabak Bernam lies within class III and IV. It also shows that water from Sungai Selangor and Sungai
Tengi can still be used for domestic consumption whilst water from other rivers are not recommended
because they might cause irritation to people. The WQI assessment is depended on the six parameters
that had been tested which are pH, SS, DO, BOD, COD, and AN. Any changes in one of the parameter
values may affect the classification of the rivers.
 In general, river pollution will occur when there is no proper control of land use activities along the
river. This pollution will result in a reduction of the river water quality index. Causes of water pollution
of the river can be divided into two which is point sources and non-point sources. The point source
pollutant is waste that comes from a known source such as domestic waste, industrial, and municipalities.
The non-point source pollutant is waste that comes from some unknown source and usually it happens
when rainy day such as waste from livestock and agricultural areas.
 Pollutants from domestic sewage are a major factor affecting the water quality index. They especially
affect the ammoniacal nitrogen (AN) and chemical oxygen demand (COD) parameters and introduce
bacteria from human faeces. Untreated domestic sewage when deposited into rivers will reduce the level
of dissolved oxygen (DO) in the water and cause rivers to be black and foul-smelling. Domestic sewage
can also be a source of various types of diseases caused by organisms and bacteria. Residential urban
areas and located near rivers is the main cause of domestic sewage. This situation almost always happens
because of the lack of a proper sewerage system.
 Agricultural activities such as paddy, oil palm and rubber plantations, as well as the cultivation of
many other crops are important agricultural activities for the Kuala Selangor and Sabak Bernam districts.
They contribute to the economic growth of these areas and indirectly increase the economy of the
Selangor State. Unfortunately, these agricultural activities have a direct effect on river water pollution.
This happens due to the indiscriminate use of fertilizers, pesticides and other chemicals used to help
plants to grow better and prevent pest attack [10]. Excessive use of fertilizers will flow into the river
when rain occurs and cause pollution to rivers. It will affect the pH parameter whereby the value of pH
will decrease and make the water river became acidic.
 Fishing is another economic activity that brings income for the residents of Kuala Selangor and Sabak
Bernam. Unfortunately, the use of boats by fishermen contributes to river pollution due to leaked and
spilled oil from the boats. In addition, the fishermen use the river water to wash their boats and nets and
which in turn will cause river water to become turbid. Increased turbidity of the river will indirectly
increase the suspended solid.

 8
International Conference on Civil and Environmental Engineering IOP Publishing
IOP Conf. Series: Earth and Environmental Science 646 (2021) 012023 doi:10.1088/1755-1315/646/1/012023

4. Conclusion
The water quality assessment of the rivers in this study has indicated that all the rivers are generally
polluted. The results has shown that all the rivers were classified into class III for Sungai Selangor and
Sungai Tengi while other rivers were in class IV. Contamination in these areas might occur due to
various land use activities such as agriculture and industries in the rivers’ catchments. As an example,
any agricultural area will cause pollution due to the overflow of fertilizers and pesticides during rainy
seasons into the river. The residential activities could also contribute to river pollution in the form of
domestic waste or rubbish thrown indiscriminately into the rivers. Industrial waste is also one of the
contributing factor to pollution of the river through the release of effluent that do not follow required
standards. It can be concluded that systematic regulations and constant monitoring on economic
developments in these area can help to decrease causes of river pollution in these catchments.

Acknowledgement
The authors would like to express special thanks to the Faculty of Civil Engineering, UiTM and School
of Environmental Engineering, UNIMAP for all support rendered and valuable comments from all
parties involved in this study are very much appreciated.

References
[1] Devane ML, Moriarty EM, Robson B, Lin S, Wood D, Webster-Brown J and Gilpin BJ 2019
 Relationships between chemical and microbial faecal source tracking markers in urban river
 water and sediments during and post-discharge of human sewage Sci. Total Environ. 651 1588-
 604
[2] Sánchez-Mateos S, Pérez LV, Córdova Suárez MA and Cabrera-Riofrio DA 2020 Heavy metal
 contamination in the Cotopaxi and Tungurahua rivers: a health risk Environ. Earth Sci. 79 144
[3] Aktar W, Sengupta D and Chowdhury A 2009 Impact of pesticides use in agriculture: Their benefits
 and hazards Interdiscip. Toxicol. 2 1-12
[4] Kyllmar K, Carlsson C, Gustafson A, Ulén B and Johnsson H 2006 Nutrient discharge from small
 agricultural catchments in Sweden. Characterisation and trends Agric. Ecosyst. Environ. 115 15-
 26
[5] Tyagi S, Sharma B, Singh P and Dobhal, R 2013 Water quality assessment in terms of Water
 Quality Index J. Am. Water Resour. Assoc. 1 34-8
[6] Tripathi M and Singal SK 2019 Use of Principal Component Analysis for parameter selection for
 development of a novel Water Quality Index: A case study of river Ganga India Ecol. Indic. 96
 (1) 430-6
[7] Bao JLK 2010 Water Quality Study and Its Relationship with High Tide and Low Tide at Kuantan
 River. Thesis for Universiti Malaysia Pahang
[8] APHA (American Public Health Association) 2005 Standard methods for the examination of water
 and wastewater 21st edn. (Washington DC: American Public Health Association)
[9] DOE 2008 Malaysia Environmental Quality Report 2008 (Kuala Lumpur: Department of
 Environment, Ministry of Natural Resources and Environment)
[10] Fulazzaky MA, Seong TW and Masirin MIM 2010 Assessment of water quality status for the
 selangor river in Malaysia Water Air. Soil Pollut. 205 63

 9
You can also read