High-Tech Business Survivorship: An Analysis by Organization Type
←
→
Page content transcription
If your browser does not render page correctly, please read the page content below
High-Tech Business Survivorship: An Analysis by Organization
                             Type
                                  Tian Luo, Amar Mann

           Previous studies have shown that organizational and environmental
           factors such as start-up size, number of establishments, start-up year,
           geographic location, and industry are all significant determinants of a
           business’s survival rate. However, the link between survival rates and the
           legal structure of businesses has not been established. This analysis of
           new and existing high-tech businesses between the years of 1998 and
           2009 reveals that given the same organizational characteristics and
           environmental factors, businesses legally structured as sole
           proprietorships and partnerships had significantly lower survival rates
           than did businesses structured as corporations or other organization types.
           Corporations had the lowest mortality rate among all groups. In
           comparison, partnerships exited at a 50 percent higher rate than did
           corporations, while sole proprietorships exited at twice the rate of
           corporations. This paper models hazard rates over the lifetime of a
           business and shows that businesses tend to have the highest mortality
           rates in their second and third years of business, after which exit rates
           decrease at a logarithmic rate. Sole proprietorships, however, do not
           follow this trend as their mortality rate was highest in their first year of
           business. In addition, impacts on survivorship of high-tech businesses due
           to start-up size, number of establishments, industry, and location are
           measured and compared with findings from previous studies.
Keywords: business survival; organization type; high-tech

Tian Luo, Economist, U.S. Bureau of Labor Statistics, luo.tian@bls.gov, 415-625-2286
Amar Mann, Regional Economist, U.S. Bureau of Labor Statistics, mann.amar@bls.gov, 415-
625-2285
Contents
I. Introduction ............................................................................................................................ 3
II. Literature Review................................................................................................................... 3
III. Description of Data ................................................................................................................ 4
IV. Methodology .......................................................................................................................... 5
V. Mortality Rates and Age of Business..................................................................................... 6
VI. Organizational and Environmental Factors............................................................................ 8
VII. Survival Analysis by Business Organization Type .............................................................. 10
VIII. Conclusion............................................................................................................................ 14
IX. Appendix A- Data notes....................................................................................................... 15
X. Appendix B- Tabulated Results ........................................................................................... 16
XI. Acknowledgements .............................................................................................................. 18
XII. References ............................................................................................................................ 19
2I. Introduction
Understanding the factors which affect survival rates for businesses is crucially important
to entrepreneurs, business owners, lenders, and investors. Previous studies have analyzed how
the survivorship of businesses is related to size class, the number of establishments, the industry,
and other firm level characteristics. Yet none of these studies have examined how the
organization type, or legal structure, of a business affects its survivorship. The existing literature
shows that larger start-up firms and firms that operate in multiple locations have better chances
of survival. In addition, corporations which have larger start-up sizes and multiple offices tend to
outlive sole-proprietorships, which have smaller start-up sizes and operate in only a single
location. What remains unclear is whether corporations survive longer due to start-up size or
other characteristics. In addition, none of these studies has focused on the high-tech sector,
which is renowned for not only harsher competition and lower survival rates but also for its great
importance to the overall U.S. economy in terms of jobs, wages, and the products and services it
produces.1
Using micro-data from the Bureau of Labor Statistics (BLS) for eight Western States of
the United States and for the years of 1998 to 2009, this paper addresses gaps in the existing
literature by evaluating how organization type affects the survivorship rate of high-tech industry
firms. A variant of the Kaplan-Meier (Kaplan & Meier, 1958) nonparametric maximum
likelihood estimator for incomplete observations is used to derive the survivorship rate function
for high-tech firms. The analysis also uses a semi-parametric proportional hazard model (Cox,
1972) to estimate the effect of organization type on firm survival rates while controlling for firm
and environmental characteristics. In addition, impacts on survivorship from start-up size,
number of establishments, industry, and location are measured and compared with findings from
previous studies.
This paper is organized as follows: Section II briefly summarizes previous studies on the
effects of various characteristics on business survival rates. Sections III and IV describe the
dataset and estimation techniques used for the survival analysis. Sections V and VI explore how
hazard rates vary with the age of a firm and across different organizational and environmental
characteristics. Finally, section VII investigates how hazard rates differ by organization type
while controlling for organizational and environmental covariates. Section VIII summarizes and
concludes the results of this study.
II. Literature Review
Previous studies have found, in general, that survival rates over a finite period tend to
increase with the age of a firm (Evans, 1987), (Evans, 1987), (Popkin, 2001). Furthermore, a vast
pool of literature shows that survival rates are sensitive to a variety of firm and environmental
characteristics. Many have found that larger start-up size tends to increase the survival rates of
firms (Mahmood, 1991), (Popkin, 2001), (Audretsch & Manmood, 1994), (Audretsch &
Mahmood, 1995). However, Agarwal and Audretsch show that this relationship deteriorates for
technologically intensive industries (Agarwal & Audretsch, 2001). Popkin also finds that multi-
establishment firms had higher survival rates than single-establishment firms. Others also find
3that the survival rates vary across industries (Shane, 2008), (Audretsch & Mahmood, 1995). In
particular, firms in manufacturing industries have relatively higher rates of survival.
Survival rates of business vary from study to study, depending on the cohort and
observed years. Some estimate that about half of businesses survive past four to five years
(Phillips & Kirchhoff, 1989), (Shane, 2008), (SBA report- Office of Economic Research, 2009).
While another study found that that about half of business survive about three years (Knaup,
2005).
III. Description of Data
The analysis in this paper uses an extract of BLS Quarterly Census of Employment and
Wages (QCEW) longitudinal database from the first quarter of 1990 to the second quarter of
2009 for eight western states in the US. These monthly data are compiled on a quarterly basis for
State unemployment insurance tax purposes and are edited and submitted to the Bureau of Labor
Statistics. The QCEW program is a Federal-State cooperative venture between the Bureau and
the State Workforce Agencies. The program collects information from approximately 98 percent
of nonfarm payroll businesses in the United States.
The original data extract contains 4.4 million observations and 77 variables over eight
western states between 1990 and 2009. Each observation is an individual business establishment
in a certain year and quarter. This extract contains over 169,000 businesses in both private and
public sectors. Only private sector firms are used in this paper. Unique identifiers for each
business allow one to track each business across time, observing time-varying and time-
invarying firm-level characteristics. The dataset includes firm and time specific variables such as
entry and exit dates, number of employees, industry, and geographic location. The length of a
firm’s survival is derived from the initial and end dates of liability and initial and end dates that a
particular firm shows up in this database. Firms that were born and died before 1990 are not
captured in this database, however firms that started before 1990 but survived until or past 1990
are captured in this database with the length of survival identified.
The analysis provided in this paper uses a subset of the original data extract. Due to the
unavailability of organization type data before the second quarter of 1998 and the unavailability
of organization type for some observations, about half of the number of firms in the original
database remains usable for the analysis. Of these usable observations, new businesses (as of the
second quarter of 1998) consist of 38 percent. Moreover, firms that have merger and acquisition
activity were dropped from the analysis, accounting for roughly 1.5 percent of all observed
firms. Survival rates derived using the Kaplan-Meier estimator take advantage of the full usable
dataset, including both existing and new businesses (as of the second quarter of 1998).
Proportional hazard models presented in this paper are restricted to new businesses only.
Observations in this dataset can be categorized into four groups: (1) firms that started
before 1998 Q2 and died before 2009 Q2, (2) firms that started before 1998 Q2 and are still
surviving in 2009 Q2, (3) firms that started after 1998 Q2 and died before 2009 Q2, and (4) firms
that started after 1998 Q2 and are still surviving in 2009 Q2. Type (3) and (4) firms are
considered “new” firms. Firms in groups (2) and (4) are “right-censored”, while those in (1) and
(2) are “left-truncated”, although for left-truncated observations, the start-date is observed.
32,074 firms are in the first group, 18,702 in second, 16,483 in third, and 15,233 in the fourth.
(see Figure 1). See Appendix A for data details.
4Figure 1. Types of observations
(1)
(2)
(3)
(4)
1998 Q2 2009 Q2
IV. Methodology
Due to incomplete observations, techniques for survival analysis of censored/truncated
data are used. The analysis provided in this paper uses a nonparametric maximum likelihood
estimator and a semi-parametric proportional hazard model to derive, estimate, and compare
survival (or hazard) rates.
Survival function
The cumulative survival function for businesses is derived using a variation of the
Kaplan-Meier estimator. The product-limit (PL) estimate, a nonparametric maximum likelihood
estimator, is used to estimate the cumulative survival function of high-tech businesses. The
cumulative survival function or the probability that a business survives past time t is given by:
.
The PL estimate, is given by:
where ni is the number of firms that are “at risk” at time t, and δI is the number of deaths at time
t.
The number “at risk”, ni is defined as:
where si is the number of firms that survived the previous period. βi is the number of firms that
became available to be considered “at risk”, such as in cases (1) and (2). A firm whose birth is
before 1998 Q2 becomes “at risk” when t is greater than the length from its birthday to 1998 Q2.
γi is the number of losses or censored cases, such as in cases (2) and (4). This occurs when a firm
is censored at 2009 Q2 and t is equal to or greater than the age of a firm.
The estimated survival rate, over a finite period, at a given time is simply:
5The mean estimated lifetime, , is defined as the mean of the PL estimate of the distribution:
is not determined everywhere, but for cases where the probability of an indeterminate result
is small, and are practically unbiased.
For discrete and equal time-intervals, , is approximated by:
Where T is the last period observed.
The variance of is estimated by
Proportional Hazard Model
To investigate how survival rates of firms vary as a function of organization type, firm
characteristics, and environmental conditions, the Cox proportional hazards model is used. This
model assumes an unknown (but to be estimated) constant hazard rate. The hazard function is
modeled by
where β is a vector of unknown parameters and λ0 is an unknown function (having an underlying
exponential distribution), giving the hazard function for the standard set of conditions x=0, i.e., a
reference point that depends on time. This assumes an underlying exponential distribution.
The hazard function that estimates the effect of organization type while controlling for covariates
is given by:
Three models for the hazard function are specified: (1) hazard rate as a function of as
organization’s legal structure (no covariates), (2) adding organizational characteristics as
covariates, (3) adding both organizational characteristics and environmental conditions as
covariates. Organizational characteristics include both start-up size and type of establishment.
Environmental conditions include geographic area, industry, and birth year.
V. Mortality Rates and Age of Business
According to conventional wisdom and much of the previous literature, businesses face
high mortality rates (low survival rates) in their first year and have lower mortality rates as they
age. The analysis will now test these beliefs and show how mortality rates change over the
lifetime of high-tech businesses. In addition, the results of this analysis will be compared with
those from previous studies to better understand the nature of a firm’s lifecycle.
6Mortality rate decreases with the age of a firm after three years. Using the Kaplan-Meier
estimator described in the previous section, the mortality rate that a high-tech business faces
generally decreases with the age of a firm. (See Chart 1) Businesses generally face a lower
mortality rate in the first year. The estimator also shows that a high-tech business has the highest
chance of exiting in its second and third years. After the first three years have passed though, the
estimated mortality rate decreases rapidly. In the following years, the mortality rate continues to
decline, but at a slower rate. Hazard rates after age three can be effectively estimated by a
logarithmic function. After applying a logarithmic transformation to the survival time, the yearly
hazard rate function is estimated by ordinary least squares:
where t is the age of the firm in years.
The above parameter estimate for the model is statistically significant, indicating that a
constant mortality rate would not sufficiently capture the nature of the mortality rate function.
Furthermore, the R-squared coefficient is .98. This indicates that the estimated function is an
excellent model for mortality rates of high-tech businesses. The R-squared coefficient means that
98 percent of the variation in the observed mortality rates (as derived using the Kaplan-Meier
estimator) is explained by the model and only 2 percent cannot be explained.
The results of the model are similar to those found by Evans and Popkin, who also found
that mortality rates generally decrease with the age of a firm. One notable difference, however, is
that the data used in this analysis show an increase in mortality rates in the second and third year
of business. One explanation for the lower mortality rate in the first year is that businesses are
able to survive on initial resources (Brüderl, Preisendörfer, & Ziegler, 1992). Firms have little
risk of failure because they can draw on their initial stock of assets which they typically acquire
at founding. Furthermore, the liability of adolescence argument cited in earlier studies predicts
firm mortality rates to have an inverted, U-shaped relationship with age (Bruderl & Schussler,
1990) (Fichman & Levinthal, 1991), an argument which is also supported by the results of this
model. Finally, the results found here for high-tech businesses run contrary to the liability of
obsolescence argument, which predicts higher mortality rates with age as aged firms tend to
become highly inertial and unable to adapt to changing business environments (Baum, 1989)
(Barron, 1994).
Chart 1. Yearly Mortality Rate
7VI. Organizational and Environmental Factors
As previously mentioned, other studies have examined how certain organizational and
environmental characteristics such as start-up size, establishment type, location, industry, and
birth year are correlated with mortality rates. This section examines these factors and compares
our findings with those from other studies. In the next section, these organizational and
environmental factors will be used as covariates for estimating the effect of organization type on
mortality rates.
Mortality rates decrease with start-up size. Our analysis shows that mortality rates
decrease with larger start-up size. This result is consistent with previous findings, Mahmood
(1991) and Popkin (2001). The mortality rates for medium and large start-up firms are much
lower than for small start-up firms. Our findings for high-tech industry firms dispute those of
Agarwal and Audretsch’s (2001) who concluded that the relationship deteriorates for
technologically intensive industries. The difference in mortality rates of different start-up size
firms comes primarily during the first fifteen years of operation. Across all start-up sizes,
businesses generally face the highest mortality rates in their third year of business. Among all
size classes, small start-up high-tech businesses have the highest mortality rates at 16 percent
during the third year of operation. Unlike medium or small startups, large startup firms actually
have their lowest mortality rate, at 6 percent, in the first two years of their existence. By the sixth
or seventh year, the mortality rate for small and medium high-tech businesses drops below the
rate seen during the first year of existence. The rate for small and medium-sized businesses then
continues to decrease until it converges at around 8 percent mortality per year. In general, large
startup businesses converge to the 8 percent per year rate by the fifth year, medium ones by the
eighth year, and small businesses by the fourteenth year. Convergence of hazard rates across all
size classes suggests that start-up size affects survival rates for up to 15 years, and then becomes
a non-significant determinant of differences in survival rates. (See Chart 2)
Chart 2. Yearly mortality rates by start-up size
Note: Hazard rates limited to 19 years due to unavailability of data
Multi-establishment firms have greater survival rates. Similar to Popkin’s findings,
multi-establishment businesses, or businesses that operate in multiple locations, tend to survive
longer than did single establishment businesses. Multi-establishment firms tend to have very low
initial hazard rates and maintain low rates over their lifetimes. Single-establishment firms tend to
have much higher initial hazard rates, which decrease with age. Cox regression results show that
8over a lifetime, a multi-establishment firm is less than half as likely to exit in a given period as a
single-establishment firm. (See Chart 3)
Chart 3. Yearly mortality rates by establishment type
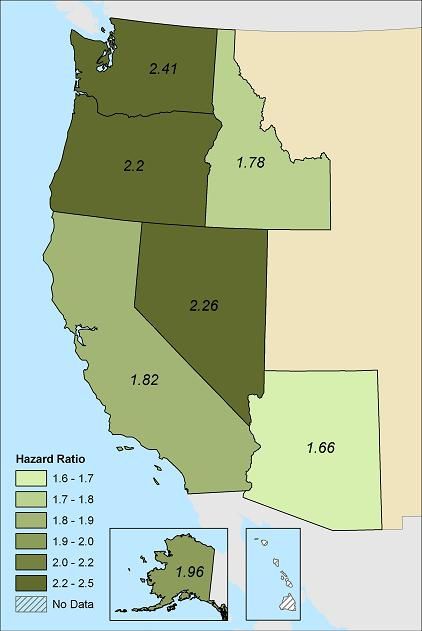
Survival rates vary by location. The geographic location of high-tech businesses has a
significant impact on survival rates, as some states tend to have firms with significantly lower or
higher survival rates than other states, for examples, businesses in Washington tend to have
relatively lower survival rates while those which are located in multiple states tend to have
relatively higher survival rates. Note that other factors such as differences in industry
composition may partially explain the observed differences in survival rates across various states
– that is, states with higher concentrations of industries which have lower survival rates would
lead to lower survival rates in the state as a whole. (See Figure 2)
Figure 2. Hazard ratio by State*
* relative to hazard rates of business that operate in multiple states
Goods producing firms have lower rates of mortality. Previous studies have shown that
manufacturing businesses tend to have lower mortality rates than do firms in other industries.
9Kaplan-Meier estimates for this dataset also show that goods producing businesses have lower
mortality rates than service providing businesses. A plot of hazard rates shows that the primary
difference in exit rates comes during the first 10 years, when service-providing firms have
mortality rates which are up to 4 percent above those of goods-producing firms. After the first 10
years, rates for both goods-producing and service-providing high-tech businesses converge. Cox
regression results also show that over a lifetime, the mortality rate for service-producing firms is
roughly 30 percent higher than for goods-producing businesses. (See Chart 4)
Chart 4. Yearly mortality rates by industry type
Mortality rates are sensitive to birth year. Birth year also has a significant impact on
mortality rates. Compared to 2008 and 2009, business born in between 1999 and 2001 tend to
have lower survival rates (higher hazard ratio), as expected due to the 2001 recession.
Meanwhile, businesses born after the 2001 recession tend to have relatively higher survival rates.
(See Chart 5)
Chart 5. Hazard Ratio by birth year*
* relative to 2008-2009 birth year
VII. Survival Analysis by Business Organization Type
In general, compared to other organization types, sole proprietorships tend to have the
lowest survival rates, followed by partnerships among high-tech businesses. Corporations tend to
have the highest survival rates. (See Chart 6). Cox regression results (without covariates) show
10that sole proprietorships and partnerships tend to have significantly higher hazard rates (hazard
ratio of 1.79 and 1.41 respectively) than other2 organization types, while corporations tend to
have similar hazard rates as other organization types. (See Table 1). However, other firm level
and environmental factors may be correlated with both organization type and survival rates and
may bias these estimates. This section addresses these potential issues.
Chart 6. Cumulative survival rates by organization type (without covariates)
The specifications in this paper use covariates to reduce the bias in estimating the effect
of organization type on survival rates. Businesses with a larger start-up size tend to have higher
survival rates; at the same time, corporations tend to have larger start-up sizes than sole
proprietorships or partnerships, hence it is not that surprising that they would also have relatively
higher survival rates. Corporations also tend to have multiple establishments, a characteristic
which is also associated with greater survivability. Furthermore, some states may have higher
concentrations of certain organization types and other systematic effects due to economic
policies which can also bias the survivorship estimates for businesses in an area. Moreover, some
industries such as manufacturing tend to have more corporations than sole proprietorships or
partnerships, and since survivorship varies greatly by industry, taking industry effect into the
analysis reduces the potential bias. These confounding effects may bias the estimation of
organization type on survival rates. Specifications (2) and (3) as given in the methodology
section control for all of the above-mentioned time-invariant covariates in estimating the effect
of organization type on survival rates.
Cox Proportional Hazards Model Results
After controlling for organizational characteristics and environmental conditions,
corporations have the highest survival rates. The next highest survival rates are found in
organizations classified as other, followed by partnerships, and finally, sole proprietorships,
which have the lowest survival rates. Ceteris paribus, partnerships and sole proprietorships have
hazard rates of 2.0 and 1.5 times that of corporations, respectively. Sole proprietorships have a
hazard rate of 1.3 times that of partnerships. Without controlling for covariates, the hazard ratio
11is larger for sole proprietorships, partnerships, and corporations, relative to the other organization
category. (See Chart 7 and Table 2)
Chart 7. Hazard ratios by organization type under specification (3)
In specifications (1) and (2), the hazard rate of corporations is not significantly different
from that of other organization type. However, including environmental fixed effects to the
model as in specification (3), corporations are found to have a significantly lower hazard rate
than businesses in the other organization category. This suggests that differences in
environmental conditions between corporations and businesses in the other category attenuate
the effect of organization type on hazard rates. In this case, the environmental conditions
assumed by corporations are correlated with higher hazard rates, while the conditions assumed
by the other organization type are correlated with lower hazard rates. Correcting for these effects
reveals that independent of organizational and environmental conditions, corporations have
lower hazard rates than other organization type. (See Table 1)
The parameter estimates (or the hazard ratios) and the significance of these estimates do
not vary significantly across the three specifications for sole proprietorships and partnerships.
These results indicate that the covariates are not strongly correlated with organization type and
survival rates for these two types of organizations.
Table 1. Model results
Specification (3): with
Specification (2): with
Specification (1): no organizational
organizational
covariates characteristics and
characteristics
environmental conditions
Parameter Hazard Parameter Hazard Parameter Hazard
Signif. Signif. Signif.
estimate ratio estimate ratio estimate ratio
Sole prop. .58 1.79 *** .55 1.73 *** .59 1.81 ***
Partnership .34 1.41 *** .34 1.40 *** .31 1.37 ***
Corporation .00 1.00 -.01 0.99 -.09 0.91 ***
Note: . significant at the 10% α level, * significant at the 5% α level, ** significant at the 1% α level, *** significant at the 0.1%
α level
The relationship between hazard ratio and parameter estimate is given by the following:
12Table 2. Hazard ratios by organization type under specification (3)
Sole prop. Partnership Corporation Other
Baseline: Sole prop. - 0.75*** 0.50*** 0.55***
Baseline: Partnership 1.33*** - 0.67*** 0.73***
Baseline: Corporation 1.99*** 1.50*** - 1.10***
Baseline: Other 1.81*** 1.37*** 0.91*** -
Note: * significant at the 5% α level, ** significant at the 1% α level, *** significant at the 0.1% α level
Using results from specification (3) (see Appendix B), the hazard rates of businesses with
different characteristics can be compared. For example, consider two firms: Firm A is a sole
proprietorship start-up which is small, located in Washington, and in the internet,
telecommunications, and data processing industry; and Firm B is a multi-establishment
corporation start-up which is large, located in California, and in the architecture and engineering
services industry. Using the parameter estimates (or hazard ratios) from specification (3), we
calculate the hazard ratio of firm A to firm B:
This indicates that Firm A is 11 times more likely to exit in a given period than Firm B.
Survival rate differences over time
Proportional hazard models show that corporations tend to have the best survival rates of
all organization types while sole proprietorships tend to have the worst survival rates. However,
a closer examination of exit rates for each organization type over time reveals that time effects
vary across organization type. In the first few years of business, corporations and other
organization types have the lowest mortality rates. After around age 6, however, mortality rates
of all organization types converge. This result is similar to the one found earlier on the effect of
start-up size on mortality rates. Not until after about age 20, do rates diverge again with
corporations again having the lowest mortality rate while sole proprietorships have the highest.
For all organization types except sole proprietorships, hazard rates are highest in the
second or third year of operation. A unique feature of sole proprietorships is that its worst year is
its first year. One explanation for this is sole proprietorships tend to have lower initial resources,
a characteristic which suppresses their chances of survival. The exit rate of sole proprietorships
in the first year is twice that of corporations. Between ages 6 and 20, hazard rates are not
significantly different among all organization types. In other words, once a business has made it
beyond the fifth year, organization type has little effect on its survival; however, after 20 years,
corporations emerge again as leaders in survival due to their organizational nature. Sole
proprietorships are linked to individuals, whereas corporations are their own entity, hence the
lifespan of a person may become the limiting factor in the survival of a sole proprietorship,
whereas corporations may survive indefinitely. (See Chart 8)
13Chart 8. Yearly mortality rates by organization type (without covariates)
VIII. Conclusion
This results of this paper confirm that high-tech businesses which have larger sizes when
they start up and which have multiple establishments generally have higher survival rates than
smaller start-ups and single-establishment businesses. These findings are similar to those found
in previous studies. In addition, survival rates tend to vary based on location, industry, and year
of birth.
The analysis presented in this paper also shows that survival rates of businesses differ
significantly based on how a business is organized. Over the lifetime of a business, sole
proprietorships have the highest mortality rates, followed by partnerships. Corporations tend to
have the lowest mortality rates and have the longest lifespan. Ceteris paribus, sole
proprietorships generally have exit rates which are double those of corporations, while
partnerships have exit rates which are 50 percent higher than those of corporations. The primary
difference in exit rates comes during the first 5 years and after 20 years of operation.
Corporations, and to a lesser extent, partnerships, tend to have lower mortality rates initially, a
finding which is explained by relatively higher levels of initial investment. Having fewer initial
resources, sole proprietorships have the highest mortality rate in their first year. During the
period examined for the Western U.S., 1 in 5 high-tech sole proprietorships exited in the first
year, while only 1 in 10 high-tech corporations exited during their first year. By age 5, over half
of corporations and more than 60 percent of sole proprietorships and partnerships had failed.
While the empirical evidence presented in this paper provides new insights as to the role
of varying business characteristics on survivorship, more detailed longitudinal data sets would
enable one to better link other business characteristics to organization type or legal structure and
survival rates. The findings in this paper do provide a foundation for future research into
additional factors which affect the life-cycle of businesses and, in particular, those in high-tech.
14IX. Appendix A- Data notes
Number of observations
Variable All New Description
Businesses Businesses
Duration of business - - Duration for which a business is open;
derived from the initial and end (if
applicable) dates of a business
Right-censored - - Indicator of whether a business is still in
business in 2009 Q2
Organization type Legal/tax structure of business
Sole proprietorship 7,654 1,663 Individual owner
Partnership General partnership, limited partnership,
2,810 1,349 and limited liability partnership
Corporation 45,395 23,874 Corporation
Other Co-ownership, bankruptcy, association,
limited liability company, liquidation,
estate administration, trusteeship, joint
26,635 4,830 venture, receivership, and other
Start-up size Employment size in the first month of
business
Small 58,074 28,846 1-4 employees
Medium 6,516 2,269 5-19 employees
Large 2,513 601 20 or more employees
Establishment Number of locations that a firm operates
Single 81,979 31,572 1
Multiple 515 144 2 or more
State
Alaska 353 319
Arizona 8,979 5,693
California1 34,498 429
Hawaii 0 0
Idaho 3,090 2,091
Nevada 5,397 4,063
Oregon 9,764 6,071
Washington 19,893 12,862
Multiple States 520 188
Industry2 High-tech industry, NAICS3 CODE:
Pharmaceutical and
medicine mfg 550 112 325400
Computer and peripheral 765 78 334100
15equipment mfg
Communications
equipment mfg 746 78 334200
Semiconductor and
electronic component mfg 2,441 239 334400
Electronic instrument mfg 1,869 218 334500
Aerospace product and
parts mfg 1,139 169 336400
Software publishers 3,933 1,810 511200
Architecture and
engineering services 26,295 8,505 541300
Computer systems design
and related services 29,062 13,914 541500
Scientific research and
development services 5,079 1,726 541700
Internet,
telecommunications, and 517100, 517900, 518000, 516000,
data processing 8,554 4,273 517300, 517500, 519130
Multiple industries 2,061 594
Start-up year Year in which a firm is born
1998 4,404 2,506
1999 3,181 3,181
2000 3,750 3,750
2001 2,889 2,889
2002 2,497 2,497
2003 2,440 2,440
2004 2,590 2,590
2005 2,919 2,919
2006 2,961 2,961
2007 2,841 2,841
2008 and 2009 3,142 3,142
TOTAL NUMBER OF
OBSERVATIONS 82,494 31,716
1
In California, the identification of organization type was virtually eliminated after 1998, hence the significant drop
in the number of usable observations.
2
11 industries have been identified as high-tech using the 2007 North American Industry Classification System
(NAICS) codes. An industry is considered high-tech if “technology-oriented workers” within an industry, as
identified by occupational staffing patterns, account for approximately 25 percent or more of total jobs within the
selected industry (Hecker, 2005).
3
NAICS or the North American Industry Classification System groups establishments into industries based on the
activities in which they are primarily engaged.
X. Appendix B- Tabulated Results
Cox regression results from specification (3)
16Parameter Hazard
Variable SE P-value
Estimate Ratio
Organization type: Sole 0.59 0.04XI. Acknowledgements
The author thanks economist Richard Cerri and others of the Division of Federal/State
Cooperative Programs for help in obtaining and understanding the dataset; and Richard Holden,
Regional Commissioner, both with the Bureau of Labor Statistics San Francisco Regional Office.
18XII. References
Agarwal, J., & Audretsch, D. B. (2001). Does Entry Size Matter? The Impact of the Life Cycle
and Technology on Firm Survival. The Journal of Industrial Economics , 49 (1), 21-43.
Audretsch, D. B. (1994). Business Survival and the Decision to Exit. International Journal of the
Economics of Business , I (1), 125 – 137.
Audretsch, D. B., & Mahmood, T. (1995). New Firm Survival: New Results Using a Hazard
Function. The Review of Economics and Statistics , 77 (1), 97-103.
Audretsch, D. B., & Manmood, T. (1994). The Rate of Hazard Confronting New Firms and
Plants in U.S. Manufacturing. Review of Industrial Organization , 9, 41-56.
Barron, D. N. (1994). A Time to Grow and a Time to Die: Growth and Mortality of Credit
Unions in New York City, 1914-1990. The American Journal of Sociology , 100 (2), 381-421.
Baum, J. A. (1989). Liabilities of newness, adolescence, and obsolescence: Exploring age
dependence in the dissolution of organizational relationships and organizations. Administrative
Science Association of Canada , 10 (5), 1-10.
Bruderl, J., & Schussler, R. (1990). Organizational Mortality: The Liabilities of Newness and
Adolescence. Administrative Science Quarterly , 35, 530-547.
Brüderl, J., Preisendörfer, P., & Ziegler, R. (1992). Survival Chances of Newly Founded
Business Organizations. American Sociological Review , 57 (2), 227-242.
Cox, D. R. (1972). Regression Models and Life-Tables. Journal of the Royal Statistical Society.
Series B (Methodological) , 34 (2), 187-220.
Evans, D. S. (1987). Tests of Alternative Theories of Firm Growth. The Journal of Political
Economy , 95 (4), 657-674.
Evans, D. S. (1987). The Relationship Between Firm Growth, Size, and Age: Estimates for 100
Manufacturing. The Journal of Industrial Economics , 35 (4), 567-581.
Fichman, M., & Levinthal, D. A. (1991). Honeymoons and the Liability of Adolescence: A New
Perspective on Duration Dependence in Social and Organizational Relationship. Academy of
Management Review , 16, 442-468.
Hecker, D. (2005, July). High-tech Employment: A NAICS-Based Update. Monthly Labor
Review , 57–72.
Henderson, A. D. (1999). Firm Strategy and Age Dependence: A Contingent View of the
Liabilities of Newness, Adolescence, and Obsolescence. Administrative Science Quarterly , 44
(2), 281-314.
19Kaplan, E. L., & Meier, P. (1958). Nonparametric Estimation from Incomplete Observations.
Journal of the American Statistical Association , 53 (282), 457-481.
Knaup, A. (2005, May). Survival and longevity in the Business Employment Dynamics data.
Monthly Labor Review , 50-56.
Mahmood, T. (1991). Does the Hazard Rate for New Plants Vary Between Low- and High-Tech
Industries? Small Business Economics (4), 201-209.
Phillips, B. D., & Kirchhoff, B. A. (1989). Formation, Growth and Survival; Small Firm
Dynamics in the U.S. Economy. Small Business Economics , 65--74.
Popkin, J. (2001). Business Survival Rates by Age Cohort of Business. United States Small
Business Administration , U.S. Department of Commerce .
SBA report- Office of Economic Research. (2009). Retrieved December 2009, from United States
Small Business Administration- Office of Advocacy: http://www.sba.gov/advo/stats/sbfaq.pdf
Shane, S. (2008, April 28). Startup Failure Rates — The REAL Numbers. Small Business Trends
.
Shane, S. (2008, May 28). Start-up Failure Rates Vary — Choosing the Right Industry Matters.
Small Business Trends .
201
In 2008, 7.0 million jobs were in the U.S. high-tech sector, which paid out 584 billion dollars in wages.
2
“Other” includes Co-ownership, bankruptcy, association, limited liability company, liquidation, estate
administration, trusteeship, joint venture, receivership, and other
21You can also read