Low Temperature Decomposition of Polystyrene
←
→
Page content transcription
If your browser does not render page correctly, please read the page content below
applied
           sciences
Article
Low Temperature Decomposition of Polystyrene
Hideki Kimukai 1 , Yoichi Kodera 2 , Koushirou Koizumi 3 , Masaki Okada 4 ,
Kazunori Yamada 4 , Toshihiko Hiaki 4 and Katsuhiko Saido 1,4, *
 1    Albatross Alliance, 2234-1 Minamiboso, Shirahama, Chiba 2950102, Japan; hkimukai@hotmail.com
 2    National Institute of Advanced Industrial Science and Technology (AIST), Tsukuba, Ibaraki 3058569, Japan;
      y-kodera@aist.go.jp
 3    College of Science & Technology, Nihon University, Funabashi, Chiba 2748501, Japan;
      Koizumi.koushirou@nihon-u.ac.jp
 4    College of Industrial Technology, Nihon University, Narashino, Chiba 2758575, Japan;
      okada.masaki@nihon-u.ac.jp (M.O.); yamada.kazunori@nihon-u.ac.jp (K.Y.);
      hiaki.toshihiko@nihon-u.ac.jp (T.H.)
 *    Correspondence: katsu.saido@gmail.com

 Received: 20 June 2020; Accepted: 23 July 2020; Published: 24 July 2020

 Abstract: Styrene oligomers (SOs), of styrene (styrene monomer, SM), 1,3-diphenylpropane (styrene
 dimer, SD1 ), 2,4-diphenyl-1-butene (styrene dimer, SD2 ) and 2,4,6-triphenyl-1-hexene (styrene trimer,
 ST), had been detected in the natural environments far from industrial area. To confirm SOs formation
 through thermal decomposition of polystyrene (PS) wastes in the nature, purified polystyrene
 (SO-free PS) has been shown to decompose at 30 to 150 ◦ C. The SO ratio of SM:SD:ST was about
 1:1:5 with ST as the main product. Mass spectrometry with selected ion monitoring was used for
 the
   quantitative
                  analysis of the trace amounts of SOs. The rate of PS decomposition was obtained as
 k year−1 = 5.177 exp(−5029/T (K)) based on the amount of ST. Decomposition kinetics indicated
 that not only does drifting lump PS break up into micro/nano pieces in the ocean, but that it also
 subsequently undergoes degradation into basic structure units SO. According to the simulation at
 30 ◦ C, the amounts of SOs in the ocean will be over 400 MT in 2050.

 Keywords: low-temperature decomposition; polystyrene; styrene oligomer; plastic debris;
 chemical contamination

1. Introduction
     Total plastic production in the 1950s has been shown to be around several million metric tons
(million MT), but at present, cumulative production has been estimated as 6.98 × 10⁹ -MT during the
period 1950 to 2015 [1,2]. Waste plastic from land sources is continually flowing into world oceans via
rivers due to accidents or carelessness. In 1972, Carpenter and Smith pointed out marine contamination
from plastics drifting on the surfaces of the Sargasso Sea [3]. In 2001, Moore et al. [4] reported debris
plastics to form garbage patches in the Pacific Ocean and to increase by 17-fold (by weight) or 95 times
(by pieces) as much the amounts of contaminants in the past 30 years. Thompson et al. [5], Takada [6],
Lavender [7] and Isobe et al. [8] have shown this drifting plastic to break up into a great many small
pieces by the action of waves and effects of light to form micro/nanoplastics which in turn lead to
massive plastic contamination in bulk. All drifting plastic quite likely break up into small pieces in this
manner [9]. By 2050, debris plastics will have attained a weight exceeding that of all fish throughout
the oceans of the world [10].
     The authors have been engaged in the collection of coastal waters and beach sands from around
the world for the past 20 years so as to determine what chemicals are generated from plastics in oceans
worldwide [11–15]. However, the manner in which various chemicals are derived from plastics has

Appl. Sci. 2020, 10, 5100; doi:10.3390/app10155100                                www.mdpi.com/journal/applsci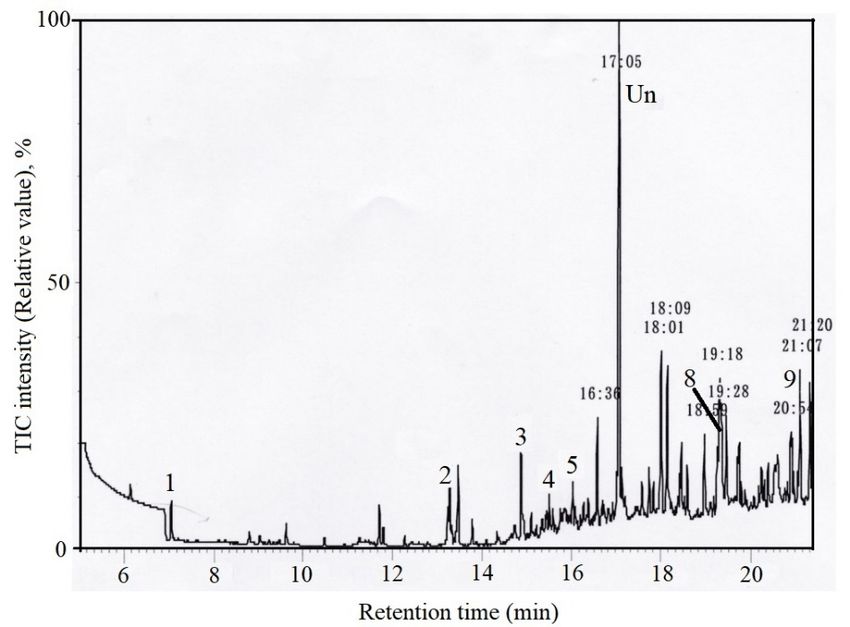
Appl. Sci. 2020, 10, 5100                                                                          2 of 10

yet to be fully clarified. Plastics decomposition has long been a topic of intensive research [16–22] at
temperatures of 250 ◦ C or higher.
      In order to estimate the amounts of SOs from drifting PS in the ocean, the rate of PS decomposition
needed to be determined at a living temperature range in the nature. However, to date, no kinetic
research on PS decomposition has been conducted at the lower temperature range in the natural
environment. Plastic debris undergoes degradation called as weathering in the ocean and on a
beach, being exposed to salt water or to the sun light in the presence of the air. Temperature is an
essential factor among various potential factors to govern plastic degradation. PS decomposition at
low temperature was thus examined in the present study using polyethylene glycol (PEG1540) as a
heating medium.
      In this study, kinetic parameters of PS decomposition at a lower temperature range, 30–150 ◦ C,
was determined to obtain the rate of SOs formation from PS. The amounts of SOs and PS in the ocean
with time were simulated based on the kinetic parameters obtained although there are various factors
other than reaction temperature.
      Using purified PS without contamination of SOs, low-temperature decomposition was carried
at 30 to 150 ◦ C. The products obtained were styrene oligomer (SOs), of styrene (styrene monomer,
SM), 1,3-diphenylpropane (styrene dimer, SD1 ), 2,4-diphenyl-1-butene (styrene dimer, SD2 ) and
2,4,6-triphenyl-1-hexene (styrene trimer, ST). The composition ratio of SM:SD:ST was 1:1:5 and the main
product was ST. The rate of ST formation by PS decomposition was measured at 30 to 150 ◦ C. Kinetic
parameters of the PS decomposition were determined and the activation energy of the conversion of
PS into ST was given as 45.0 kJ mol−1 . One MT of PS was found to decompose at a rate of 0.3 g per
year at 30 ◦ C.
      Simulation results indicated that the total amount of degraded PS in the ocean has been as much
as 430-MT during the period, 1950 to 2050. The results indicated PS to have little stability toward
heat, kinetically. Drifting macro PS not only breaks up into micro/nanosized pieces, but subsequently
degrades into basic structure units of SOs in the ocean.

2. Experimental

2.1. Preparation of Reaction Samples
     Commercial pellets of PS (Number–average molecular weight: 500,000, Teijin Chemicals, Ltd.,
Tokyo, Japan) were found to contain 90 mg kg−1 of unreacted SOs along with various additives. For the
removal of these chemicals, 50 g PS were dissolved in 2000 mL benzene and reprecipitated with 4000
mL methanol at room temperature. This operation was conducted three times and SO remained at less
than 0.1 mg kg−1 . Purified PS was used in this operation. Figure 1a shows the procedure for purifying
PS and Figure 1b shows the subsequent treatment.

2.2. Reagent
      Polyethylene glycol (PEG1540, Average molecular weight 1350–1650, Wako Pure Chemical Co.,
Osaka, Japan) was used as the heat medium due to high solubility for PS, thermal stability and low
volatility. Benzene and methanol for dissolving PS or reprecipitation and tetrahydrofuran (THF) as
the GPC eluent all these were of reagent grades and manufactured by Wako Pure Chemical Co. SD2
and ST were prepared by the decomposition of PS and purified by distillation under reduced pressure
by boiling point fractionation [23]. The purity of SD2 , ST was determined by gas chromatography
(GC) with a flame ionization detector (FID) as 99.8% or more before use. The internal standard,
phenanthrene, and diphenyl were used after being purified using a special grade of Kanto Chemical
Co., Inc. (Tokyo, Japan) following sublimation treatment. SM and SD1 (Wako Pure Chemical Co.Osaka,
Japan) were used after the distillation of reagents prior to use.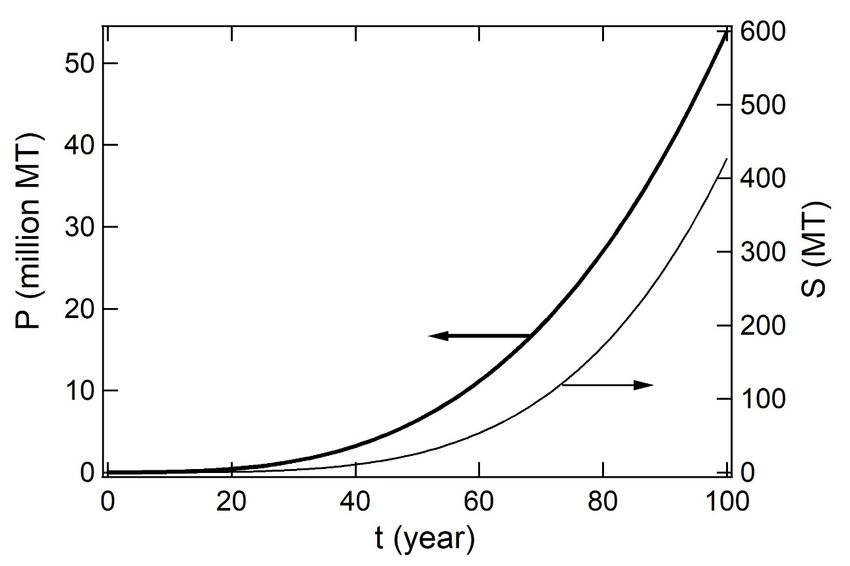
Appl.
Appl. Sci. 2020, 10,
      Sci. 2020, 10, 5100
                     x FOR PEER REVIEW                                                                                33 of
                                                                                                                         of 10
                                                                                                                            10

                              (a)                                                         (b)
           Figure 1. for
Figure 1. Procedure  Procedure   for(a)
                         purifying   purifying  (a) styrene(SO)-free
                                        styrene oligomers   oligomers  (SO)-free polystyrene
                                                                     polystyrene (PS) and (b)(PS) and (b) treatment.
                                                                                              subsequent
                                                subsequent treatment.
2.3. Decomposition Method
 2.2. Reagent
       Figure 2 shows the schematic diagram of the experimental equipment for PS decomposition
higher    than 50 ◦ C. Silicone
        Polyethylene              oil bath was
                         glycol (PEG1540,          used for
                                               Average        heating.weight
                                                          molecular     A 20-mL     glass flask
                                                                                 1350–1650,      was used
                                                                                               Wako    Pure for SO-freeCo.,
                                                                                                             Chemical     PS
decomposition.        Chromyl/alumel       thermocouples       were   used  to  monitor   the  temperature
 Osaka, Japan) was used as the heat medium due to high solubility for PS, thermal stability and low           of a  reaction
mixture    in Benzene
 volatility.  the flask and
                          and that  of an oil
                               methanol     forbath.   The flask
                                                 dissolving    PS has  a nitrogen gas inlet
                                                                   or reprecipitation   and and     a gas seal for (THF)
                                                                                               tetrahydrofuran     nitrogenas
gas   flowing    out. A  heat  medium,     4.9  g of  PEG   a stirrer were   placed  in the  flask
 the GPC eluent all these were of reagent grades and manufactured by Wako Pure Chemical Co. SD2     and  nitrogen   gas was
introduced     at aprepared
                    rate of 50 bymLthe     −1 .-When the flask had reached a predetermined temperature, 0.1 g
                                      mindecomposition
 and ST were                                                   of PS and purified by distillation under reduced
SO-free
 pressurePSby  (cut  off small
                   boiling       pieces
                             point       under 5 mm)
                                      fractionation        andThe
                                                        [23].    diphenyl
                                                                      purityasofa surrogate
                                                                                   SD2, ST was         10−6 g in benzene)
                                                                                                (1.0 ×determined     by gas
were    charged   into  the flask. The   reaction   solution   was  stirred  at 500 rpm.   Temperature
 chromatography (GC) with a flame ionization detector (FID) as 99.8% or more before use. The internal      was  adjusted   to
astandard,
   predetermined       temperature     ± 1  ◦ C using a digital thermometer.
              phenanthrene, and diphenyl were used after being purified using a special grade of Kanto
       PS decomposition
 Chemical                     at 30 ◦ CJapan)
               Co., Inc. (Tokyo,         was carried    out without
                                                 following             solventtreatment.
                                                              sublimation        because the SMmelting
                                                                                                   and SDpoint of PEG1540
                                                                                                            1 (Wako Pure
is about    45 ◦ C. PS  samples    were   stored   in a flask  placed  in a thermostatic    chamber     (Yamato   Scientific
 Chemical Co.Osaka, Japan) were used after the distillation of reagents prior to use.
Co., Ltd.,Tokyo, Japan) control accuracy ±1 ◦ C) under nitrogen gas. The reaction at 30 ◦ C was continued
for
 2.3.three   years.
      Decomposition     Method
     Figure 2 shows the schematic diagram of the experimental equipment for PS decomposition
higher than 50 °C. Silicone oil bath was used for heating. A 20-mL glass flask was used for SO-free
PS decomposition. Chromyl/alumel thermocouples were used to monitor the temperature of a
reaction mixture in the flask and that of an oil bath. The flask has a nitrogen gas inlet and a gas seal
for nitrogen gas flowing out. A heat medium, 4.9 g of PEG a stirrer were placed in the flask and
nitrogen gas was introduced at a rate of 50 mL min−1.-When the flask had reached a predetermined
temperature, 0.1 g SO-free PS (cut off small pieces under 5 mm) and diphenyl as a surrogate (1.0 ×
10−6 g in benzene) were charged into the flask. The reaction solution was stirred at 500 rpm.
Temperature was adjusted to a predetermined temperature ± 1 °C using a digital thermometer.
     PS decomposition at 30 °C was carried out without solvent because the melting point of PEG1540
is about 45 °C. PS samples were stored in a flask placed in a thermostatic chamber (Yamato Scientific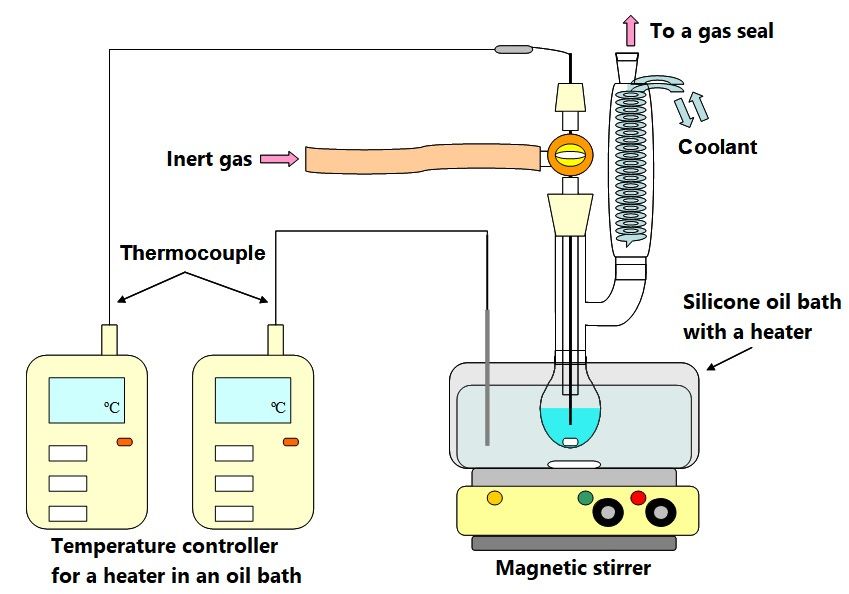
Appl. Sci. 2020, 10, x FOR PEER REVIEW                                                                           4 of 10

Appl. Co.,  Ltd.,Tokyo,
      Sci. 2020, 10, 5100 Japan) control accuracy ±1 °C) under nitrogen gas. The reaction at 30 °C was 4 of 10
     continued for three years.

                               Figure 2. Schematic diagram of a decomposition equipment.
                             Figure 2. Schematic diagram of a decomposition equipment.
     2.4. Apparatus
2.4. Apparatus  andand OperatingConditions
                    Operating    Conditions
          SO-free PS was heated at a fixed temperature for a given period in a flask. The reaction mixture
      SO-free PS was heated at a fixed temperature for a given period in a flask. The reaction mixture
     was recovered with 10 mL benzene and was transferred to a 50-mL separating funnel and washed
was recovered with 10 mL benzene and was transferred to a 50 mL separating funnel and washed
     three times with 10 mL purified water to remove PEG. After drying with 5 g anhydrous sodium
threesulfate
       times overnight,
              with 10 mLthepurified    water
                                solution  wastofiltered
                                                 removeand  PEG.   After drying
                                                               transferred   to 10with
                                                                                    mL5 methanol
                                                                                         g anhydrous    sodium sulfate
                                                                                                    to precipitate
overnight,
     unreacted PS. The solvent was completely removed from the solution by evaporation at 25unreacted
             the  solution    was  filtered  and  transferred     to 10 mL    methanol   to precipitate    °C and PS.
The solvent   was   completely     removed    from   the  solution    by evaporation    at 25 ◦ C and the residue was
     the residue was collected with benzene in a 10-mL volumetric flask. Following the addition of
collected  with benzene
     phenanthrene,    1 μL ofinthe
                                a 10-mL
                                   solutionvolumetric
                                            was injectedflask.   Following
                                                           into GC/MS    withthe  addition of and
                                                                               a micro-syringe  phenanthrene,   1 µL of
                                                                                                    analyzed. The
     details are
the solution     shown
               was       in Figure
                     injected   into 1b. The GC
                                      GC/MS    withused was HP6890 (Agilent
                                                      a micro-syringe             Technologies,
                                                                          and analyzed.     TheInc.,  Santa
                                                                                                 details areClara,
                                                                                                              shown in
     CA,1b.
Figure    USA).
             TheTheGCmass
                        usedspectrometer
                               was HP6890   (MS)  was JMS-AMII
                                              (Agilent               manufactured
                                                          Technologies,             by JEOL,
                                                                            Inc., Santa       Ltd.
                                                                                         Clara,    (Tokyo,
                                                                                                 CA,  USA). Japan)
                                                                                                              The mass
     and  the separation  column    was  DB-1  manufactured     by  Agilent  J & W. The  operating
spectrometer (MS) was JMS-AMII manufactured by JEOL, Ltd. (Tokyo, Japan) and the separation         conditions are
     shown in Table 1.
column was DB-1 manufactured by Agilent J & W. The operating conditions are shown in Table 1.
                             Table 1. Apparatus and operation conditions of GC/MS analysis.
                          Table 1. Apparatus and operation conditions of GC/MS analysis.
              Apparatus                                   JEOL JMS-AM II with GC/MS (HP6890)
         Selected  Ion (SI, m/z)
              Apparatus                                  78, 104, 105, 152,
                                                               JEOL         178, 193,II196,
                                                                       JMS-AM           with207,GC/MS
                                                                                                 208, 312 (HP6890)
               Injection                                                      1 μL
       Selected     Ion (SI, m/z)                            78, 104, 105, 152,     178, 193, 196, 207, 208, 312
                Column                                    DB-1, L 30 m, ID 0.32 mm, Thick 0.25 μm
                Injection
           Injection method                                                  Spitless
                                                                                        1 µL
                Column
        Injection temperature                                 DB-1,    L 30   m,  ID
                                                                             250 °C    0.32  mm, Thick 0.25 µm
          Injection
        Column         method Initial temp. 40 °C (holding 5 min), max temp. 290 °C
                  temperature                                                         Spitless
                                                                                         (holding 5 min), program rate 15 °C/min
      Injection     temperature
        Interface temperature                                                250 °C 250 ◦ C
       Ion source temperature              Initial temp. 40 ◦ C (holding     2005°Cmin), max temp. 290 ◦ C (holding 5 min),
      Column        temperature
       Ion acceleration  current                                              70 eV rate 15 ◦ C/min
                                                                          program
                Current                                                      300 μA
      Interface temperature                                                            250 ◦ C
              PM voltage                                                      600 V
     Ion source      temperature
              Carrier gas                                               He, 1.4 mL/min
                                                                                       200 ◦ C
     Ion acceleration current                                                    70 eV
             Current                                                            300 µA
     3. Results and Discussion
           PM voltage                                                            600 V
           Carrier gas                                                      He, 1.4 mL/min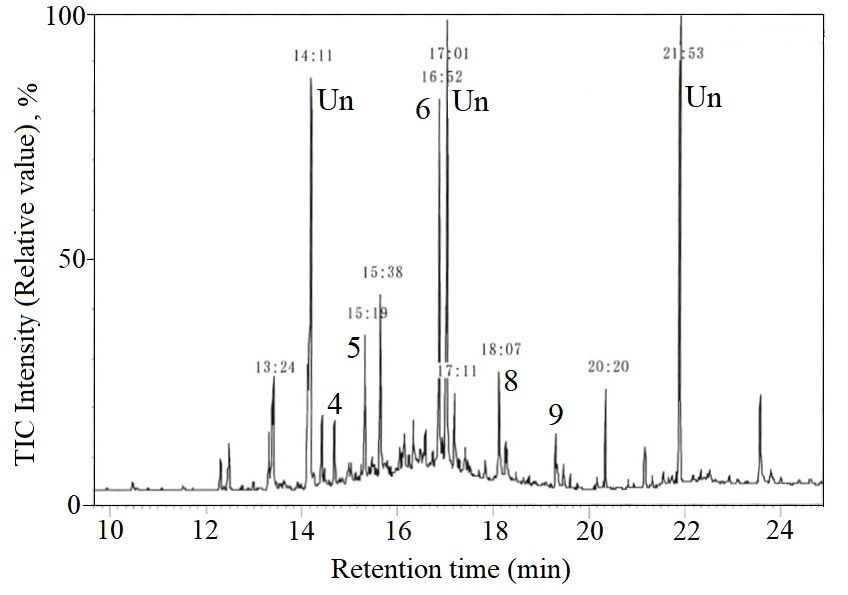
Appl. Sci. 2020, 10, 5100                                                                                 5 of 10

Appl. Sci. 2020, 10, x FOR PEER REVIEW                                                                     5 of 10
3. Results and Discussion
 3.1. Accuracy
3.1. Accuracy
       The mass spectrum obtained by GC/MS, TIM was used to determine fragment ion (m/z) of the
      The mass spectrum obtained by GC/MS, TIM was used to determine fragment ion (m/z) of the
 target chemicals (SM, SD1,2, ST). The quantitative analysis was conducted by using the monitoring
target chemicals (SM, SD1,2 , ST). The quantitative analysis was conducted by using the monitoring ion:
 ion: Q (quantitative ion), m/z: 104, 154, 178, 196, 208, 312 and qualitative ion: m/z: 78, 105, 117, 152, 193
Q (quantitative ion), m/z: 104, 154, 178, 196, 208, 312 and qualitative ion: m/z: 78, 105, 117, 152, 193
 ions. Calibration curves were prepared by the internal standard method using the detected ion peak
ions. Calibration curves were prepared by the internal standard method using the detected ion peak
 area ratio (I/Q). For quantitative analysis of the target chemicals by mass spectrometry, Selected Ion
area ratio (I/Q). For quantitative analysis of the target chemicals by mass spectrometry, Selected Ion
 Monitoring (SIM) was used because target detection performance of SIM was 100 times higher than
Monitoring (SIM) was used because target detection performance of SIM was 100 times higher               than
 that in Total Ion Monitoring (TIM). It was thus possible to obtain very low concentrations (10−9 level)
that in Total Ion Monitoring (TIM). It was thus possible to obtain very low concentrations (10−9 level)
 of SOs by the SIM.
of SOs by the SIM.
       A standard solution of each compound (SM, SD1,2, ST) was prepared to obtain a target solution
      A standard solution of each compound (SM, SD1,2 , ST) was prepared to obtain a target solution
 using a pipette and volumetric flask, and the calibration       curve of each compound was prepared.
using a pipette and volumetric flask, and the calibration        curve of each compound was prepared.
 Curve linearity ranged from 0.2 μg to 10 mg kg with a correlation coefficient, r = 0.9996 to 0.9999.
                                                      −1
Curve linearity ranged from 0.2 µg to 10 mg kg−1 with−1a correlation coefficient, r = 0.9996 to 0.9999.
 The detection limit was found at S/N = 2 to be 10 μg kg .
The detection limit was found at S/N = 2 to be 10 µg kg−1 .
 3.2. Effects
3.2.  Effects of
              of Temperature
                 Temperatureand
                             andTime
                                   Time
       Polymer decomposition
       Polymer    decompositionsuchsuchas
                                        asthat
                                           thatfor
                                                forPS
                                                   PShas
                                                       haslong
                                                           longbeen
                                                                  beenstudied
                                                                       studied[16–22].
                                                                                 [16–22]. Since
                                                                                          Since the
                                                                                                 the polymer
                                                                                                     polymer has
                                                                                                              has
 low thermal
low   thermalconductivity,
                 conductivity,a apreliminary
                                  preliminary  heating
                                             heating    time
                                                      time     is necessary
                                                            is necessary     to achieve
                                                                          to achieve thethe  target
                                                                                          target     temperature
                                                                                                 temperature  for
decomposition [21]. The generated SOs has an extremely low value of less than µg kg thuskg
 for  decomposition    [21]. The   generated  SOs   has  an  extremely   low   value of less  than   μg   −1 thus
                                                                                                  −1     making
 making analysis difficult in this study, this difficulty was overcome by a new decomposition using
analysis difficult in this study, this difficulty was overcome by a new decomposition using PEG as the
 PEG as the heat medium. Among the various factors governing plastic degradation in the nature, we
heat medium. Among the various factors governing plastic degradation in the nature, we focused
 focused thermal effect on PS decomposition in the experiments. We assume first-order reaction of PS
thermal effect on PS decomposition in the experiments. We assume first-order reaction of PS to form
 to form SOs. The rate of ST formation was calculated at each reaction temperature. ln k and the
SOs. The rate of ST formation was calculated at each reaction temperature. ln k and the reciprocal of
 reciprocal of the absolute temperature (T−1) are shown in Figure 3, which shows a linear relationship
the absolute temperature (T−1 ) are shown in Figure 3, which shows a linear relationship in the entire
 in the entire temperature range of 30 to 150 °C. PS activation energy of 45 kJ mol−1 was obtained from
temperature range of 30 to 150 ◦ C. PS activation energy of 45 kJ mol−1 was obtained from the slope of
 the slope of the line by using the Arrhenius equation. A low activation energy 45.0 kJ mol−1 indicated
the line by using the Arrhenius equation. A low activation energy 45.0 kJ mol−1 indicated a secondary
 a secondary reaction, a backbiting reaction [24] to be a dominant factor in low temperature
reaction, a backbiting reaction [24] to be a dominant factor in low temperature decomposition.
 decomposition.

       Figure 3. Arrhenius plot of styrene trimer (ST) formation through PS-decomposition at 30 to 150 ◦ C.
       Figure 3. Arrhenius plot of styrene trimer (ST) formation through PS-decomposition at 30 to 150 °C.

     SO composition did not change in the range 30 to 150 °C. The largest component was ST followed
by SD and SM. The SO composition ratio of SM:SD:ST was about 1:1:5. Trace amounts of
ethylbenzene, propyl benzene and benzaldehyde were observed along with secondary reactions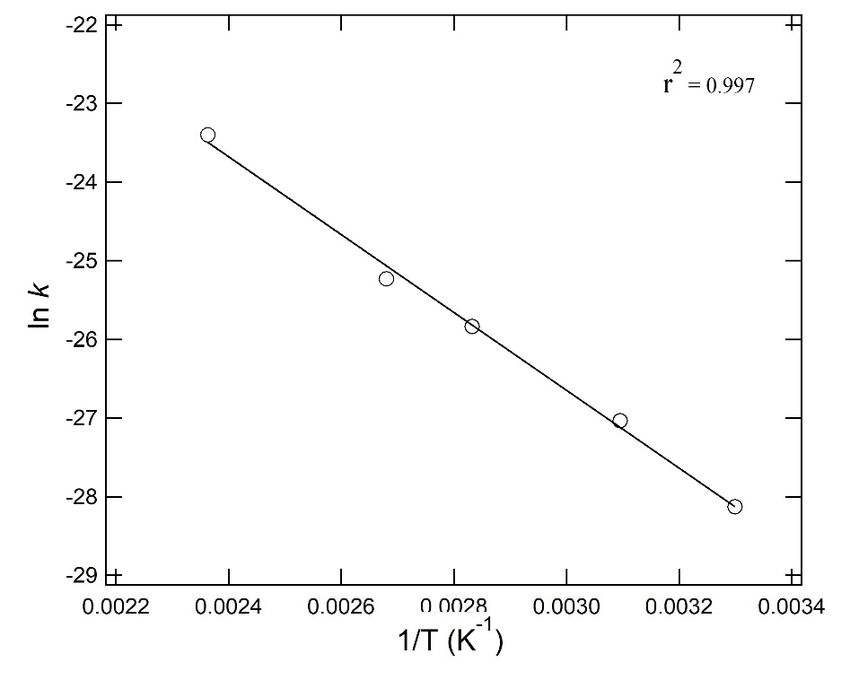
Appl. Sci. 2020, 10, 5100 6 of 10
Appl.SO
Sci. composition
2020, 10, x FOR did
PEERnot change
REVIEW in the range 30 to 150 ◦ C. The largest component was ST followed 6 of 10
by SD and SM. The SO composition ratio of SM:SD:ST was about 1:1:5. Trace amounts of ethylbenzene,
when temperature
propyl benzene andreached 200 °C were
benzaldehyde and higher. After
observed the with
along reaction, the PS reactions
secondary was recovered
when and prepared
temperature
into a film and
◦ analyzed by IR (infrared absorption spectrum). The IR analysis showed
reached 200 C and higher. After the reaction, the PS was recovered and prepared into a film and no change in
the PS main
analyzed by IRchain (2924,
(infrared 2850 cm spectrum).
absorption
−1 aliphatic stretching vibration,
The IR analysis 1450no
showed cmchange
−1 aliphatic
in thevibration).
PS main
Alternatively Gel Permeation
−1 Chromatography (GPC, Column:−1 Asahipak GF-7MHQ,
chain (2924, 2850 cm aliphatic stretching vibration, 1450 cm aliphatic vibration). Alternatively Detector: RI,
eluent:
Gel THF 0.6Chromatography
Permeation mL/min, Sample:(GPC, 2 mgColumn:
in 100 mL THF, 20
Asahipak μL injection,
GF-7MHQ, 30 °C)RI,
Detector: detected
eluent: number–
THF 0.6
average molecular weight decreased by 20% when reaction
◦ conditions were between
mL/min, Sample: 2 mg in 100 mL THF, 20 µL injection, 30 C) detected number–average molecular 200–280 °C for
30 min or more [21]. ◦
weight decreased by 20% when reaction conditions were between 200–280 C for 30 min or more [21].
3.3.Degree
3.3. DegreeofofPS
PSDegradation
Degradationin
inOcean,
Ocean,Determined
Determinedfrom
fromRate
RateConstant
ConstantofofST
STFormation
Formation
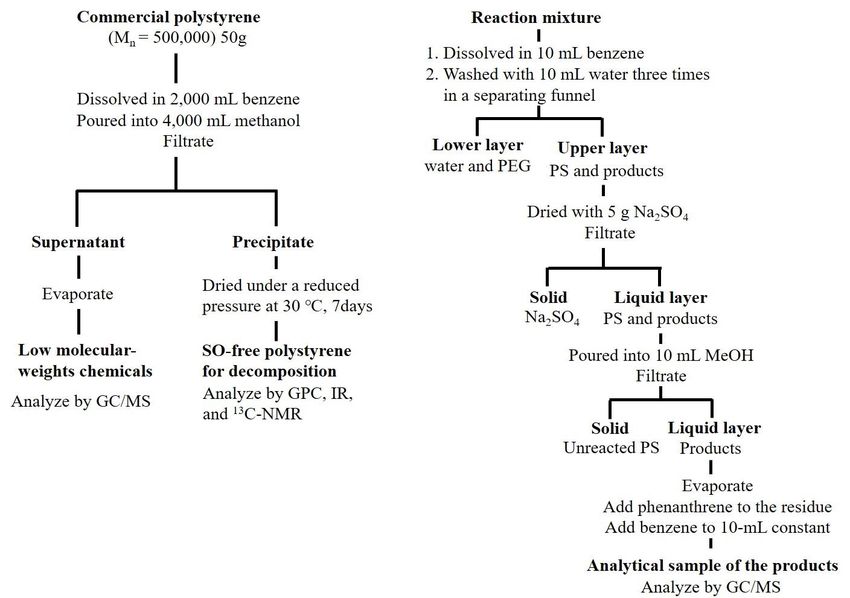
Variouschemical
Various chemical species
species possibly
possibly derived
derived fromfrom artificial
artificial sources
sources havedetected
have been been detected in the
in the nature.
nature.4Figures
Figures 4 andtypical
and 5 show 5 showTIM-GC/MS
typical TIM-GC/MS chromatograms
chromatograms of analytical
of analytical samples samples by extraction
by extraction of sand
of sand
and andinpebble
pebble in each sampling
each sampling site industrial
site far from far from industrial
area. area.
Figure4.4.TIM-GC/MS
Figure TIM-GC/MSchromatograms
chromatograms ofofthe
thesample
sampleextracted
extracted from
from sand
sand in
in Waikiki
Waikikibeach,
beach,Hawaii,
Hawaii,
◦ 0
21°16′ N, ◦ 0
158°8′
21 16 N, 158 8 E, Date: 25 March 1975.
Figure 4 shows the chromatogram of an extraction sample of sand from Waikiki beach at Oahu,
Hawaii in 1975 and Figure 5 shows the chromatogram of an extraction sample of pebbles by Showa
base, Antarctic Continent in 1984. Compared with the mass fragments of each standard sample, Peak 1
was identified as SM, 3 as diethyl phthalate, 4 as SD1 , 5 as SD2 , 8 as bisphenol A, 9 as ST. 2 as diphenyl
added as a surrogate and 6 as phenanthrene added as an internal standard and Un means unknown
chemicals. SM has been shown a breakdown product formed by cinnamon mold flora and possibly
may be present in oceans as a single contaminant [25]. However, the other styrene oligomers are not
naturally present in ocean. Considering the constant ratio of SM:SD:ST, the authors concluded that
SOs have been shown to be the degradation products of PS from land-based sources. The chemical
contamination generated from PS had already been present in the nature over 45 years ago.
Figure 5. TIM-GC/MS chromatograms of the sample extracted from pebble by Showa base, Antarctic
continent, 60°00′ S, 39°35′ E, 1984.Figure
Appl. Sci. 2020, 4.
10,TIM-GC/MS
5100 chromatograms of the sample extracted from sand in Waikiki beach, Hawaii,
7 of 10
21°16′ N, 158°8′ E, Date: 25 March 1975.
Figure5.5.TIM-GC/MS
Figure TIM-GC/MSchromatograms
chromatogramsof
ofthe
thesample
sampleextracted
extractedfrom
frompebble
pebbleby
byShowa
Showabase,
base,Antarctic
Antarctic
continent, ◦ 000 S, 39◦ 350 E, 1984.
continent,60
60°00′ S, 39°35′ E, 1984.
Jambeck et al. [26] estimated total waste plastics inflow in 2010 into world oceans to range from
4.8 to 12.7 × 10⁶ MT. However, in all these computations [3–6,26], there has always been considerable
margin for error. There is really virtually no completely relivable information on the quantities of
plastics that have undergone degradation and sedimented to the ocean floor.
The rate of ST formation was thought same as the rate of PS decomposition at ambient temperatures
in oceans and on beaches since PS decomposition at low temperature, 30–150 ◦ C, give ST as the dominant
product [22]. The decomposition rate, k, of PS (basically
the
same as the formation rate of ST) was
found to be St = P0 [1 − exp(−kt)] ≈ P0 kt, where k min−1 = 9.850 × 10⁻⁶ exp(−5029/T ) where P0
is the initial amount of purified PS in a flask, t the reaction time and T the temperature in Kelvin.
Rate of ST formation was 6.15 × 10⁻¹³ min−1. Converting
the unit of rate into annual rate, the annual
decomposition rate, k, of PS was given as k year−1 = 5.177 exp(−5029/T ) where P0 is the amount
of PS in the ocean, t time in years since 1950 and T the temperature in Kelvin. The ST rate was
3.233 × 10⁻⁷ year−1 at 30 ◦ C. One MT PS decomposed at a rate of 0.3 g per year at 30 ◦ C. PS production
of seven percent in the total plastics production [2]. Jambeck et al. assumed three percent of the total
plastic consumption as plastic inflow to the ocean [26]. The cumulative amounts of PS and SOs in the
ocean were simulated as shown in Figure 6.
The simulation was conducted by using three differential equations (Equations (1) through (3)).
The production share of PS at seven percent and inflow ratio at three percent were assumed to be
constant during 1950 to 2050.
w(t) = 1.50 × 10⁶ + 4.845 × 10⁴ t2.107 (1)
dP(t)
= 3.150 × 10³ + 101.7t2.107 − 3.232 × 10⁻⁷ P(t) (2)
dt
dS(t)
= 3.232 × 10⁻⁷ P(t) (3)
dt
where w(t) (MT) is the annual plastic production at the eclipsed year t since 1950, P(t) (MT) is the
cumulative amount of PS accumulated in the ocean at eclipsed year since 1950, t, S(t) (MT) is the total
amount of SOs in the ocean at the year t.
Equation (1) is a fitting result to the statistical data of global plastic production [1,2]. In Equation (3),
3.240 × 10⁻⁷ (year−1 ) is the rate of ST formation at 30 ◦ C that equals to the rate of SOs formation.ST as the dominant product [22]. The decomposition rate, k, of PS (basically the same as the formation
rate of ST) was found to be = 1− (− ) ≈ , where (min ) = 9.850 ×
10 (−5029/ ) where P0 is the initial amount of purified PS in a flask, t the reaction time and T
the temperature in Kelvin. Rate of ST formation was 6.15 × 10⁻¹³ min–1. Converting the unit of rate into
annual rate, the annual decomposition rate, k, of PS was given as (year ) = 5.177 (−5029⁄ )
where
Appl. Sci. 2020, P0 is
10, the amount of PS in the ocean, t time in years since 1950 and T the temperature in Kelvin.
5100 8 of 10
The ST rate was 3.233 × 10⁻⁷ year–1 at 30 °C. One metric ton PS decomposed at a rate of 0.3 g per year
at 30 °C. PS production of seven percent in the total plastics production [2]. Jambeck et al. assumed
Equation
three(2) was given
percent by multiplying
of the total Equation
plastic consumption as (1) by inflow
plastic the share of ocean
to the PS 7% and
[26]. inflow
The ratio 3%.
cumulative
Equation (3) isofbased
amounts PS andonSOs
theinkinetic parameters
the ocean of ST formation
were simulated 30 ◦ C.6.
as shown inatFigure
6. Simulated
FigureFigure amounts
6. Simulated amounts ofof(P,(P,left)
left)PS
PSdebris
debris and generated(S,(S,right)
and generated right) SOs
SOs thatthat have
have beenbeen
accumulated in oceans
accumulated at time
in oceans t (year)
at time since
t (year) 1950
since 1950toto2050.
2050.
ST gradually decomposed to generate SM and SD and SD generated SM [22]. PS had been
considered non-degradable in the nature, but kinetically PS, which contains no additives such as
stabilizers, has been shown to degrade under the environmental temperature range to produce SOs.
SOs formation would be enhanced under the severer conditions in the nature such as UV irradiation
and exposure to oxygen in the air.
There has been the common misconception that plastic is stable and does not decompose at
ambient temperatures. Accordingly, plastics have been considered to remain permanently intact in
oceans. However, this study has clearly indicated this not to be the case, based on careful examination
of PS degradation. In this study, even purified PS decomposition was shown to start even at 30 ◦ C. Not
only dose drifting lumps of PS break into micro/nano pieces, but also subsequently degrades into basic
structure units.
It is widely known that the reaction rate doubles with a temperature increase of 10 ◦ C. Tropical and
subtropical ocean temperatures reach 30 ◦ C and coastal sand at these latitudes reach 60 ◦ C. The amounts
of SO in the world oceans should thus be considered to be significantly higher than this PS value,
suggesting ocean contamination to intensify as a result of plastics. Increasing amounts of various
polymers go into the ocean and coastal area. Intensive studies are required to evaluate the biologic
impacts of SOs from PS and the other chemical species possibly derived from various plastics.
4. Conclusions
SOs were often detected in sea water and sand of coastal area. PS decomposition at a low
temperature range, 30 to 150 ◦ C, was conducted to confirm SOs formation from PS wastes in the nature.
In this temperature range, ST was a dominant product. ST would be an intermediate yielding SD1 ,
SD2 and SM because SM became dominant in PS decomposition at the higher temperature range.
The Arrhenius plot of ln k with the reciprocal of a reaction temperature in Kelvin showed a linear
relationship within the low temperature range. The rate coefficient, k (year–1 ), was obtained as 5.177Appl. Sci. 2020, 10, 5100 9 of 10
exp(−5029/T) based on the rate of ST formation. SOs in the ocean was estimated over 400 MT in 2050
based on the simulation including thermal decomposition at 30 ◦ C.
Author Contributions: Conceptualization, H.K., Y.K. and K.S.; data curation, H.K.; M.O. and K.S.; investigation,
H.K., Y.K., K.K. and K.S.; writing of the original draft preparation, H.K., Y.K. and K.S.; writing of review and
editing, H.K., Y.K., T.H. and K.Y. All authors have read and agreed to the published version of the manuscript.
Funding: This research received no external funding.
Conflicts of Interest: The authors declare no conflicts of interest.
References
1. Plastics Europe. The Compelling Facts about Plastics 2006 (Plastics Europe, 2008). Available online: https:
//www.plasticseurope.org/application/files/2815/1689/9283/2006compelling_fact_PubJan2008.pdf (accessed
on 20 June 2020).
2. Plastics Europe. Plastics-the Facts 2016 (Plastics Europe, 2016). Available online: https://www.plasticseurope.
org/application/files/4315/1310/4805/plastic-the-fact-2016.pdf (accessed on 20 June 2020).
3. Carpenter, E.D.; Smith, K.L., Jr. Plastics on the Sargasso Sea surface. Science 1972, 175, 1240–1241. [CrossRef]
[PubMed]
4. Moore, C.J.; Moore, S.L.; Leecaster, M.K.; Weisberg, S.B. A comparison of plastic and plankton in the north
pacific central gyre. Mar. Pollut. Bull. 2001, 42, 1297–1300. [CrossRef]
5. Thompson, R.C.; Olsen, Y.; Mitchel, R.P.; Davis, A.; Rowland, S.J.; John, A.W.G.; McGonigle, D.; Russell, A.E.
Lost at sea: Where is all the plastic? Science 2004, 304, 838. [CrossRef] [PubMed]
6. Takada, H. Call for pellets! International pellet watch global monitoring of POPs using beached plastic resin
pellets. Mar. Pollut. Bull. 2006, 52, 1547–1548. [CrossRef]
7. Law, K.L. Plastics in the marine environment. Annu. Rev. Mar. Sci. 2017, 9, 205–229. [CrossRef]
8. Isobe, A.; Iwasaki, S.; Uchida, K.; Tokai, T. Abundance of non-conservative microplastics in the upper ocean
from 1957 to 2066. Nat. Commun. 2019, 10, 417. [CrossRef] [PubMed]
9. Law, K.L.; Thompson, R.C. Microplastics in the sea. Science 2014, 345, 144–145. [CrossRef]
10. Jennings, S.; Melin, F.; Blanchard, J.L.; Forster, R.M.; Dulvy, N.K.; Wilson, R.W. Global-scale predictions of
community and ecosystem properties from simple ecological theory. Proc. R. Soc. B 2008, 275, 1375–1383.
[CrossRef]
11. Saido, K.; Amamiya, K.; Sato, H.; Okabe, A.; Ogawa, N.; Kamaya, Y.; Kogure, K.; Nishimura, M.; Okukawa, K.;
Kusui, T. Analysis of styrene oligomer contaminations generated from marine debris polystyrene on the
coast of Okinawa. Bunseki Kagaku 2012, 61, 629–636. [CrossRef]
12. Kwon, B.G.; Kiozumi, K.; Chung, S.-Y.; Kodera, Y.; Kim, J.-O.; Saido, K. Global styrene oligomers monitoring
as new chemical contamination from polystyrene plastic marine pollution. J. Hazard. Mater. 2015, 300,
359–367. [CrossRef]
13. Kwon, B.G.; Chung, S.-Y.; Park, S.-S.; Saido, K. Qualitative assessment to determine internal and external
factors influencing the origin of styrene oligomers pollution by polystyrene plastic in coastal marine
environments. Environ. Pollut. 2018, 234, 167–173. [CrossRef] [PubMed]
14. Amamiya, K.; Saido, K.; Chung, S.-Y.; Hiaki, T.; Lee, D.S.; Kwon, B.-G. Evidence of transport of styrene
oligomers originated from polystyrene plastic to oceans by runoff. Sci. Total Environ. 2019, 667, 57–63.
[CrossRef] [PubMed]
15. Amamiya, K.; Koizumi, K.; Yamada, K.; Hiaki, T.; Kusui, T.; Saido, K. Analysis of Drifting Polystyrene
Degradation Surround Japan. Austin J. Environ. Txicol. 2020, 6, id1030.
16. Staudinger, H.; Steinhofer, A. Über hochpolymere Verbindungen. 107. Beiträge zur Kenntnis der Polystyrole.
Justus Liebigs Ann. der Chem. 1935, 517, 35–53. [CrossRef]
17. Madorsky, S.L. Rate of thermal degradation of polystyrene and polyethylene in a vacuum. J. Polym. Sci.
1952, 9, 133–156. [CrossRef]
18. John, J.R.M.; Eddy, J.; Callaerts, A.; Buekens, A. Kinetic study of thermal decomposition of polystyrene by
means of pyrolysis gas chromatography. Macro. Chem. Rpid Commun. 1982, 3, 349–356. [CrossRef]
19. Faravelli, F.; Pinciroli, M.; Pisano, F.; Bozzano, G.; Dente, M.; Ranizi, E.G. Themal degradation of polystyrene.
J. Anal. Appl. Pyrolysis 2000, 60, 103–121. [CrossRef]Appl. Sci. 2020, 10, 5100 10 of 10
20. Dewangga, P.B.; Rochmadi; Purnomo, C.W. Pyrolysis of polystyrene plastic waste using bentonite catalyst.
Earth Environ. Sci. 2019, 399, 0120110. [CrossRef]
21. Saido, K.; Taguchi, H.; Kodera, Y.; Ishihara, Y.; Ryu, I.-J.; Chung, S.-Y. Novel method for polystyrene reactions
at low temperature. Macromol. Res. 2003, 11, 87–91. [CrossRef]
22. Saido, K.; Kodera, Y.; Taguchi, H.; Tomono, K.; Ishihara, Y.; Kuroki, Y. New trimer depolymerization pathway
in thermal degradation of polystyrene. 230th ACS Polym. Prep 2005, 46, 685.
23. Saido, K.; Motohashi, S.; Kuroki, T.; Ikemura, T.; Kirisawa, M. Preparation and properties of heat-resistant
phthalic ester plasticizers derived from the thermal decomposition products of waste polystyrene. Ind. Eng.
Chem. Prod. Res. Dev. 1985, 24, 102–106. [CrossRef]
24. Shibasaki, Y.; Yang, M.; Sun, L.; Shi, L. Role of back-biting in the thermal degradation of vinyl polymers.
Polym. Recycl. 2000, 5, 189–204.
25. Lafeuille, J.-L.; Buniak, M.-L.; Vioujas, M.-C.; Lefevre, S. Natural formation of styrene by cinnamon mold
flora. J. Food Sci. 2009, 74, 276–283. [CrossRef] [PubMed]
26. Jambeck, J.R.; Geyer, R.; Wilcox, C.; Siegler, T.R.; Perryman, M.; Andrady, A.; Narayan, R.; Law, K.L. Plastic
waste inputs from land into the ocean. Science 2015, 347, 768–771. [CrossRef] [PubMed]
© 2020 by the authors. Licensee MDPI, Basel, Switzerland. This article is an open access
article distributed under the terms and conditions of the Creative Commons Attribution
(CC BY) license (http://creativecommons.org/licenses/by/4.0/).You can also read