Dynamic temperature field measurements using a polarization phase-shifting technique
←
→
Page content transcription
If your browser does not render page correctly, please read the page content below

Dynamic temperature field
                 measurements using a polarization
                 phase-shifting technique

                 David Ignacio Serrano-García
                 Amalia Martínez-García
                 Noel-Ivan Toto-Arellano
                 Yukitoshi Otani

Downloaded From: https://www.spiedigitallibrary.org/journals/Optical-Engineering on 07 Dec 2020
Terms of Use: https://www.spiedigitallibrary.org/terms-of-use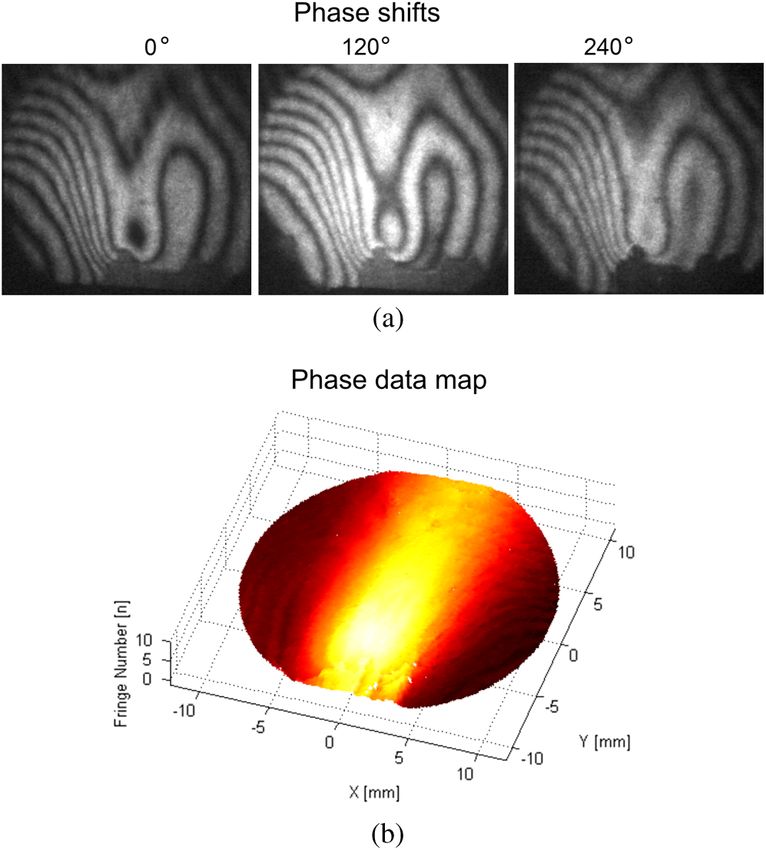
Optical Engineering 53(11), 112202 (November 2014)

                Dynamic temperature field measurements using
                a polarization phase-shifting technique
                David Ignacio Serrano-García,a,b,* Amalia Martínez-García,a Noel-Ivan Toto-Arellano,c and Yukitoshi Otanib
                a
                  Centro de Investigaciones en Óptica A.C., León, Gto., México
                b
                  Utsunomiya University, Center of Optical Research and Education, 7-1-2 Yoto, Utsunomiya, Tochigi 321-8585, Japan
                c
                  Laboratorio de Óptica y Fotónica de la Universidad Tecnológica de Tulancingo, Tulancingo, Hidalgo, México

                                 Abstract. In this study, an optical system capable of simultaneously grabbing three phase-shifted interferometric
                                 images was developed for dynamic temperature field measurements of a thin flame. The polarization phase-
                                 shifting technique and a Michelson interferometer that is coupled to a 4-f system with a Ronchi grating placed at
                                 the frequency plane are used. This configuration permits the phase-shifted interferograms to be grabbed simul-
                                 taneously by one CCD. The temperature field measurement is based on measuring the refraction index differ-
                                 ence by solving the inverse Abel transform, which requires information obtained by the fringe order localization.
                                 The phase map is retrieved by a three-step algorithm. Experimental results of a dynamic thin flame are pre-
                                 sented. © The Authors. Published by SPIE under a Creative Commons Attribution 3.0 Unported License. Distribution or reproduction of this
                                 work in whole or in part requires full attribution of the original publication, including its DOI. [DOI: 10.1117/1.OE.53.11.112202]

                                 Keywords: interferometry; polarization; phase shifts; temperature; diffraction.
                                 Paper 131460SS received Sep. 23, 2013; revised manuscript received Dec. 19, 2013; accepted for publication Dec. 30, 2013; pub-
                                 lished online Feb. 28, 2014.

                1 Introduction                                                                               Other single-shot systems are based on the use of a three-
                In phase-shifting techniques, a stepping motor or piezo-                                 layer sensor to detect three wavelengths; these systems have
                electric transducers are normally used to move a reference                               been applied accurately by fringe projections profilometry7
                surface to get the interference fringe images with a relative                            and digital holographic system.8 Interferometric polarization
                phase shift. However, this takes a period of time, making it                             phase-shifting techniques also have been employed before
                susceptible to environmental effects such as ambient vibra-                              in different techniques; some of them are based on using
                tion or air turbulence, which results in measurement errors.                             Wollaston prisms and polarization gratings9 by using a prism
                To facilitate the applicability of interferometric techniques                            and a glass plate with different thicknesses,10 and lately
                for measuring dynamic events, a system that is capable of                                a system capable of acting as a fringe projection system, or
                acquiring several phase-shifted images instantaneously or                                a shearing interferometer by employing a Savart plate and
                simultaneously is required. As a result of this capability,                              liquid crystals.11
                a reduction of environmental disturbances is encountered,                                    Alternative systems, also based on phase-shifting polari-
                increasing the accuracy and stabilization of the system.                                 zation techniques, have been presented before.2,12 These sys-
                   In this study, a measurement system that is capable of                                tems are based on obtaining interference replicas by using
                grabbing three phase-shifted interferometric images instanta-                            phase/amplitude gratings,12 and also they only retrieve the
                                                                                                         phase data map. The interferogram amplitude modulation
                neously (or simultaneously) was developed for dynamic
                                                                                                         change obtained by the replication system was solved earlier
                temperature measurement over a period of time. The system
                                                                                                         by using two crossed gratings and selecting the orders with
                presented is based on polarization phase-shifting techniques
                                                                                                         equal amplitude.2,3,12 Even this amplitude modulation
                presented previously,1–3 with the addition of calibration pro-
                                                                                                         change was minimum when using phase gratings,3,12 it
                cedures and digital fringe processing techniques in order to
                                                                                                         was still encountered. In this work, the selection of an ampli-
                accurately measure temperature fields varying in time.
                                                                                                         tude grating is to emphasize the amplitude modulation
                   Single-shot polarization phase-shifting techniques are
                                                                                                         change and how this can be solved by a fringe normalization
                currently a focus field of study, and the most important and
                                                                                                         process.
                an industry standard nowadays are pixelated phase mask                                       In order to implement a system capable of obtaining
                interferometers. One of the principal properties of these                                temperature field measurements of a flame varying in time,
                systems is that the modulating phase-mask remains fixed,                                 we implemented calibration and normalization procedures.
                placed before the CCD light sensor.4 Nowadays, some                                          In this work, the temperature field measurement is based
                authors present novel algorithms based on this property; for                             on measuring the refraction index difference by solving the
                example, in the demodulation form, algorithms focused on                                 inverse Abel transform. The inversion of the Abel transform
                harmonics rejections, and recently encountered more accu-                                is solved with the information obtained by the fringe order
                rate results by proposing an extension of the phase-shifting                             localization of the deformed fringe pattern generated by the
                unit cell.5,6                                                                            flame under study.
                                                                                                             This paper is organized in five sections, including the
                                                                                                         present introduction. Section 2 discusses the theoretical
                *
                    Address all correspondence to: David Ignacio Serrano-García, E-mail: david@          background of the single-shot procedure by first explaining
                    cio.mx                                                                               the phase data map retrieval and then the relationship with

                Optical Engineering                                                             112202-1                                              November 2014    •   Vol. 53(11)

Downloaded From: https://www.spiedigitallibrary.org/journals/Optical-Engineering on 07 Dec 2020
Terms of Use: https://www.spiedigitallibrary.org/terms-of-use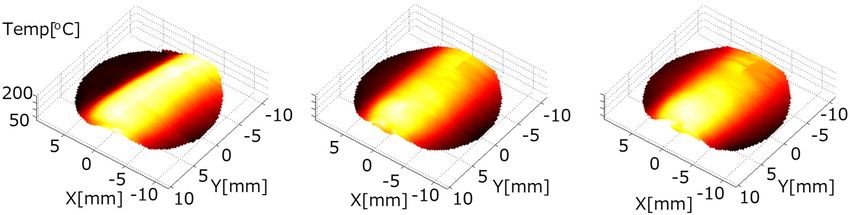
Serrano-García et al.: Dynamic temperature field measurements using a polarization. . .
the temperature field measurement. In Sec. 3, the experimen- 2.1 Polarization Phase Shifting Technique
tal setup is described, and the dynamic temperature field The output beam of the interferometer, after passing
measurements are presented. Finally, in Sec. 4, conclusions the quarter-wave plate, can be represented as the sum of
are presented. the states, object and reference beam, with circular polariza-
tion states in opposite directions, respectively
2 Temperature Fields Measurements by
1 1 −iφðx;yÞ 1 1
Means of Phase Data Map Calculation Ot ðx; yÞ ¼ pffiffiffi e þ pffiffiffi ; (1)
2 i 2 −i
Interference occurs when placing a quarter-wave plate and
a linear polarizer at the output of an interferometer that has
when this field is observed through a linear polarizing filter
its reference and object beams with orthogonal linear polari-
Pθ whose transmission axis is at angle θ
zation. Interference is between the right-handed and left-
handed circularly polarized states in objects and reference
cos2 θ sin θ cos θ
beam, respectively. A desired phase shift will be obtained Pθ ¼ : (2)
and controlled by the angle of the polarizer.13,14 This consid- sin θ cos θ sin2 θ
eration is suitable in the implementation for a single-shot
phase-shifting interferometer. The resulting irradiance is associated with the interference
The optical setup presented for the optical phase calcula- pattern with a phase shift introduced twice the angle of
tion consists of a polarization Michelson interferometer the polarizers.
(PMI) that is coupled to a 4-f system with an amplitude
grating placed at the Fourier plane (Fig. 1). As a result,
the interferogram first obtained by the PMI is replicated at I θ ðx; yÞ ¼ jPθ · Ot j2 ¼ 1 þ cos½φðx; yÞ þ 2θ: (3)
the image plane of the 4-f system (Fig. 2).
2.2 Interferogram Pattern Replication
The transmittance of a Ronchi grating of spatial period d ¼
ðλfÞ∕ðX0 Þ that is placed in the Fourier Plane can be written
as
X ∞
u
Gðu; vÞ ¼ rect δðu − n · dÞ
aw n¼−∞
X∞
u−n·d
¼ rect ; (4)
n¼−∞
aw
where δðuÞ denotes the Dirac delta function and * the con-
volution operation. aw represents the width of the white
Fig. 1 Setup of the instantaneous polarized phase-shifting interfer- stripe and ½u; v represents the frequency coordinates. The
ometer. The polarizing Michelson interferometer (PMI) is coupled corresponding Fourier transform scaled to the wavelength
to a 4-f system in order to obtain replicas of the interference pattern
at the output. Each interferogram retrieved presents a relative phase λ and the focal length f is
shift of 120 deg. Mirror: M; half wave plate: HWP; lens: Li; polarizers:
Pi; quarter wave plate: QWP; beam splitter: BS.
X∞
aw a
gðx; yÞ ¼ sinc w x · δðx − nX 0 Þ
n¼−∞
d λf
X
∞
¼ Cn · δðx − nX 0 Þ: (5)
n¼−∞
The physical meaning of the parameter X 0 is the replica
separation in the image plane where its amplitude is
modulated by a sincð·Þ function. Figure 3 shows the
transmittance of the Ronchi ruling with its corresponding
Fourier transform. For purpose of visualization in Fig. 3(b),
the correspondent sincð·Þ function was plotted showing
the amplitude change obtained by the zeroth order with
the 1st order.
The transmittance obtained in the image plane will be
Fig. 2 Interferogram replication system based on a 4-f system with an
composed of the convolution of the interference pattern
amplitude grating in the Fourier plane. The necessary phase shifted with the Ronchi ruling grating diffraction pattern scaled in
interferograms are captured in the same image. the λ and the focal length f.
Optical Engineering 112202-2 November 2014 • Vol. 53(11)
Downloaded From: https://www.spiedigitallibrary.org/journals/Optical-Engineering on 07 Dec 2020
Terms of Use: https://www.spiedigitallibrary.org/terms-of-use
Serrano-García et al.: Dynamic temperature field measurements using a polarization. . .

                                                                                                                Z     ∞   fðrÞrdr
                                                                                                    NðxÞλ ¼ 2             pffiffiffiffiffiffiffiffiffiffiffiffiffiffi ;                              (8)
                                                                                                                  x        r 2 − x2
                                                                                                    where NðxÞ represents the fringe order of the slice to
                                                                                                    be used to retrieve the refraction index profile. NðxÞ ¼
                                                                                                    ½φðx; ys Þ∕2π and fðrÞ ¼ nðrÞ − n0 . Equation (8) repre-
                                                                                                    sents the Abel transform of fðrÞ, and the index of refrac-
                                                                                                    tion difference is retrieved by using Abel transform
                                                                                                    inversion techniques.21 By inverting Eq. (8), we are able
                                                                                                    to calculate the position dependent index of refraction.
                                                                                                    Taking into account the Gladstone–Dale relation,
                                                                                                    ðTÞ ¼ 1 þ Kρ, expressed under ideal gas assumption,
                                                                                                    ρ ¼ p∕RT, we are able to retrieve the temperature profile
                Fig. 3 Transmittance of a Ronchi ruling of spatial period and width of              as
                the white strip. The resulting intensity of the diffraction pattern scaled
                in the wavelength and the focal length results in an amplitude change
                                                                                                                            P
                between orders following a sincð·Þ function.                                        Tðx; yÞ ¼                   ;                                      (9)
                                                                                                                  ρref þ fðx;yÞ
                                                                                                                         K G−D R
                                                        X
                                                        N
                I p ðx; yÞ ¼ gðx; yÞ  I θ ðx; yÞ ¼           jCn j · I θ ðx − n · X 0 ; yÞ         taking air as a reference at T ¼ 15°C with a pressure
                                                       n¼−N                                         P ¼ 101325 N∕m2 , ρref ¼ 1.225, R ¼ 287 J∕kg K as the
                I n ðx; yÞ ¼ jCn jf1 þ cos½2θ − φðx; yÞg;                              (6)         specific gas constant, and K G−D ¼ 0.226 × 10⁻³ m3 ∕Kg
                                                                                                    as the Gladstone–Dale constant at λ ¼ 632.8 nm.22
                                                                                                    Several studies have concluded that the assumption of
                where θ is the angle of the linear polarizer placed over the                        air is sufficient for premixed flames as a sample, but in
                interference pattern replica and used to introduce the desired                      a more strictly manner, the Gladstone–Dale and specific
                phase shift. The term φðx; yÞ is the phase data map, and Cn is                      gas constants need to be taken into account for specific
                the n-Fourier complex coefficient.                                                  local component distribution, not in the scope of this
                   The major drawback of this system is the amplitude inter-                        work.23–25
                ferogram modulation caused by the phase/amplitude gra-
                tings.12 A more detailed study of the replicas obtained by
                using these techniques can be encountered in Ref. 2. This                           4 Experimental Setup of the Temperature Field
                amplitude modulation can be solved by the implementation                               Measurement
                of fringe pattern normalization algorithms.15,16 As a differ-                       The proposed system is based on a PMI coupled to a 4-f
                ence from the system previously presented in Ref. 2, in                             system in order to obtain replicas of the interference pattern
                this work, we used only one Ronchi ruling, taking the inter-                        at the output (Fig. 1). Light from a He-Ne laser at
                ference replicas obtained in the [−1; 0; 1] orders and using                        λ ¼ 633 nm is linearly polarized at 45 deg and divided in
                a fringe pattern normalization algorithm to avoid the inter-                        amplitude by the beam splitter (BS). Linear polarizers at
                ference amplitude difference against the [−1; 1] orders with                        0 and 90 deg are placed on the object and reference arms
                the [0] order.                                                                      of the PMI, respectively. A quarter-wave plate (QWP) at
                                                                                                    45 deg at the output of the interferometer turns linearly polar-
                                                                                                    ized light into left-handed and right-handed circularly polar-
                3 Temperature Field Measurement                                                     ized light, respectively. If we place a linear polarizer at this
                The phase difference φðx; yÞ between two waves passing                              stage, we could obtain an interference pattern with its phase
                through the same point of the phase object, one in the pres-                        modulation controlled twice the linear polarizer angle. By
                ence of an inhomogeneous medium and the other in the air, is                        placing an amplitude grating with a spatial frequency of
                given by17–20                                                                       100 lines∕mm on the frequency plane of the 4-f system,
                                                                                                    we are able to obtain replicas with the same capability of
                                 ZΓ                                                                 phase modulation by placing a linear polarizer angle in
                          2π                                                                        each of the replicas obtained (Fig. 2). As a result, we obtain
                φðx; yÞ ¼             ½nðx; y; zÞ − n0 dz;                             (7)
                           λ                                                                        the necessary interference fringe patterns with a relative
                                  0                                                                 phase shift in order to retrieve the phase data map properly.
                                                                                                    After each interferogram is separated from the image, the
                where nðx; y; zÞ is the refractive index of the medium, n0 is                       fringe processing is the same as any other algorithms already
                the refractive index of the air, and Γ is the total length of                       implemented in the literature. An He-Ne laser is utilized with
                the medium. In this equation, the optical path difference                           a power of 20 mW and λ ¼ 0.633 μm allowing sufficient
                provides the distortion of the wavefront. In order to evalu-                        illumination intensity to carry out the experiment. The mono-
                ate the index refraction difference term, Eq. (7) must                              chromatic camera used is based on a CMOS sensor with
                be solved. This task can be achieved depending on the                               1280 × 1024 pixels and with a pixel pitch of 6.7 μm. The
                structure of the phase object. Taking the thin-flame as a                           polarizing filter film that was used is commercially available
                phase object with radial symmetry, the equation of a bright                         (Edmund Optics, TechSpecs high contrast linear polarizing
                fringe, NðxÞ ¼ φðx; yÞ∕2π, of the retrieved interferogram                           film). The size of each polarized film used in each interfero-
                becomes                                                                             gram was 25 × 25 mm, with its transmission axes oriented at

                Optical Engineering                                                           112202-3                                        November 2014   •   Vol. 53(11)

Downloaded From: https://www.spiedigitallibrary.org/journals/Optical-Engineering on 07 Dec 2020
Terms of Use: https://www.spiedigitallibrary.org/terms-of-use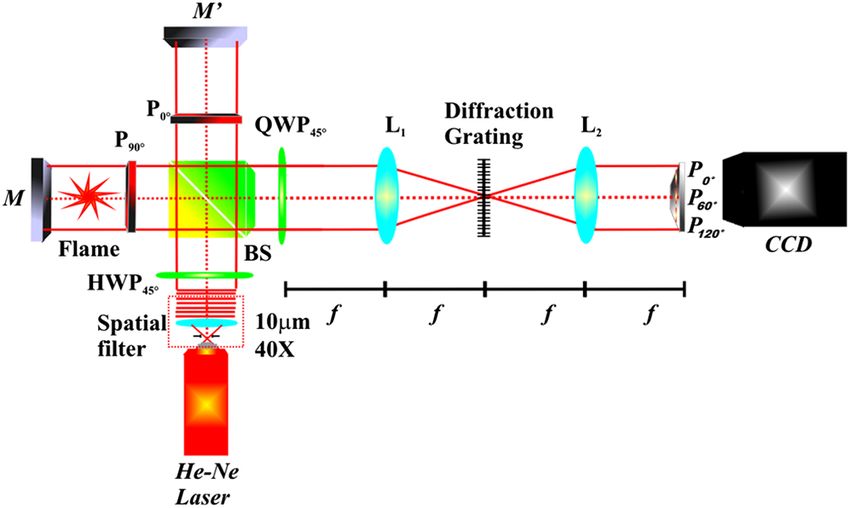
Serrano-García et al.: Dynamic temperature field measurements using a polarization. . .

                                                                                                  0, 60, and 120 deg. The wrapped phase data map was
                                                                                                  retrieved using the minimum least square algorithm of three
                                                                                                  steps,26 and the unwrapped phase data through the 2-D
                                                                                                  Goldstein branch cut phase unwrapping algorithm.27
                                                                                                      A commercial disposable lighter using butane as a fuel
                                                                                                  was used. The lighter was settled to obtain the minimum
                                                                                                  flame size possible and prepared to fix the amount of fuel
                                                                                                  flow during the experiment. The variation observed in the
                                                                                                  experiment corresponds to the temperature distribution in
                                                                                                  the region surrounding the flame. Temperature profile meas-
                                                                                                  urement was obtained analyzing the dynamic behavior at
                                                                                                  8.3 fps in a period of time of 12 s.
                                                                                                      Figure 4 presents the three phase-shifted interferograms
                                                                                                  obtained by a single capture. After a previous calibration pro-
                                                                                                  cedure,1 we are capable of retrieving the three phase-shifted
                                                                                                  interference patterns. By implementing a fringe normaliza-
                                                                                                  tion technique, we are capable of retrieving the phase
                                                                                                  data map [see Fig. 4(b)]. By taking a reference phase
                                                                                                  map, the fringe order localization is directly obtained from
                                                                                                  the deformed fringe pattern, in this case, caused by a thin
                                                                                                  flame (Video 1).
                                                                                                      With the fringe order localization information, we are able
                                                                                                  to solve the inverse Abel transform [Eq. (8)] and obtain the
                                                                                                  temperature change occurred by the thin-flame analyzed.
                                                                                                  Figure 5 shows the typical temperature profile obtained in
                Fig. 4 Experimental results corresponding to the fringe order number              a single capture.
                obtained by the unwrapped phase map. (a) Three-phase shifted inter-
                ferograms with amplitude modulation obtained by a single capture
                                                                                                      As the system is able to obtain the dynamic temperature
                used to retrieve the phase data map. (b) By taking a reference                    profile in Fig. 6, we present several captures of a dynamic
                phase map, the fringe order localization is directly obtained of the              distribution of air temperature that occurred due to environ-
                deformed fringe pattern (Video 1, WMV, 0.5 MB) [URL: http://dx.doi                ment changes outside of the thin flame (Video 2).
                .org/10.1117/1.OE.53.11.112202.1].

                                                                                                  5 Final Remarks
                                                                                                  The experimental setup for dynamic temperature field
                                                                                                  measurements using a single-shot polarization phase shift-
                                                                                                  ing technique has been described. This system is able to
                                                                                                  obtain three phase shifted interferograms in only one shot.
                                                                                                  Therefore, it is suitable to carry out temporal measurements
                                                                                                  of temperatures changes occurred outside of a thin flame.
                                                                                                  The implementations of normalization fringe procedures
                                                                                                  present the advantage of avoiding the use of phase gratings,
                                                                                                  and also the advantage of using only three interferograms
                                                                                                  for the analysis. The system is considerably simpler than
                                                                                                  previous proposals, showing a suitable alternative to imple-
                                                                                                  ment in an industrial setting. It is important to note that for
                                                                                                  this work a polarization change related to the component’s
                                                                                                  temperature variation were not encountered. In order to
                                                                                                  apply this system for higher temperatures, it is strictly
                                                                                                  necessary the isolation of the sample without losing its
                Fig. 5 Temperature profile obtained in a single capture using polar-              polarization characteristics of the object beam for correct
                izing phase shifting techniques.                                                  implementations.

                                       Fig. 6 Temperature phase profiles varying in time (representative frames) (Video 2, WMV, 0.5 MB).
                                       [URL: http://dx.doi.org/10.1117/1.OE.53.11.112202.2].

                Optical Engineering                                                       112202-4                                   November 2014   •   Vol. 53(11)

Downloaded From: https://www.spiedigitallibrary.org/journals/Optical-Engineering on 07 Dec 2020
Terms of Use: https://www.spiedigitallibrary.org/terms-of-use
Serrano-García et al.: Dynamic temperature field measurements using a polarization. . .
Acknowledgments 18. D. P. Correia, P. Ferrão, and A. Caldeira-Pires, “Advanced 3D
Emission Tomography Flame Temperature Sensor,” Combustion
Authors thank M. A. Ruiz (CIO), Boaz Jessie Jackin Sci. Technol. 163(1) (2001).
(Utsunomiya Univ. CORE), and Barry Cense (Utsunomiya 19. C. Shakher and A. K. Nirala, “A review on refractive index and
temperature profile measurements using laser-based interferometric
Univ. CORE) for their contribution in proofreading the techniques,” Opt. Lasers Eng. 31(6) (1999).
manuscript. The authors gratefully acknowledge the research 20. S. Sharma, G. Sheoran, and C. Shakher, “Investigation of temperature
and temperature profile in axisymmetric flame of butane torch burner
support from the CONACYT under grant 180449. D-I using digital holographic interferometry,” Opt. Lasers Eng. 50(10)
Serrano-García is currently occupying a position as a visiting (2012).
researcher at Utsunomiya University in the Center for 21. E. Ampem-Lassen et al., “Refractive index profiling of axially sym-
metric optical fibers: a new technique,” Opt. Express 13(9), 3277–3282
Optical Research & Education (CORE). D-I Serrano-Garcia (2005).
is very grateful to CONACYT for the graduate scholarship 22. T.E. Walsh and K.D. Kihm, “Tomographic deconvolution of laser
granted (234454-227470/31458) and expresses sincere speckle photography for axisymmetric flame temperature measure-
ment,” J. Flow Visual. Image Process. 2(3), 299–310 (1995).
appreciation to Geliztle for the support provided. N.-I. 23. K. D. Kihm, “Laser speckle photography technique applied for heat
Toto-Arellano expresses sincere appreciation to Luisa, and mass transfer problems,” Adv. Heat Transfer 30, 255–311
(1997).
Miguel, and Damian for the support provided, and to 24. Z. Jinrong et al., “Study on the measurement of temperature field using
“Programa de Mejoramiento del Profesorado” (PROMEP) laserholographic interferometry,” Energy 5(1), 120–124 (2011).
for Grant UTTGO-PTC-016. 25. J. A. Qi et al., “Temperature-field measurements of a premixed butane/
air circular impinging-flame using reference-beam interferometry,”
Appl. Energy 83(12), 1307–1316 (2006).
References 26. M. Servin, J. C. Estrada, and J. A. Quiroga, “The general theory of
phase shifting algorithms,” Opt. Express 17(24), 21867–21881 (2009).
1. N. I. Toto-Arellano et al., “4D profile of phase objects through the use 27. D. C. Ghiglia and M. D. Pritt, Two-Dimensional Phase Unwrapping:
of a simultaneous phase shifting quasi-common path interferometer,” Theory, Algorithms and Software, Wiley-Interscience, New York
J. Opt. 13(11), 115502 (2011). (1998).
2. N. I. Toto-Arellano et al., “Slope measurement of a phase object using
a polarizing phase-shifting high-frequency Ronchi grating interferom-
eter,” Appl. Opt. 49(33), 6402–6408 (2010). David Ignacio Serrano-García received his bachelor’s degree
3. D. I. Serrano-García et al., “Radial slope measurement of dynamic from the Monterrey Institute of Technology and Higher Education
transparent samples,” J. Opt. 14(4), 045706 (2012). in physical engineering in 2008 and his master’s degree in optics
4. J. E. Millerd et al., “Pixelated phase-mask dynamic interferometer,” in 2010 from the Centro de Investigaciones en Optical A.C. in
Proc. SPIE 5531, 304–314 (2004). Leon, Guanajuato, Mexico. He is currently working toward his
5. M. Servin and J. C. Estrada, “Error-free demodulation of pixelated
carrier frequency interferograms,” Opt. Express 18(17), 18492–18497 PhD in the same institution. His main research involves optical met-
(2010). rology and polarization phase shifting techniques applied to single-
6. J. M. Padilla, M. Servin, and J. C. Estrada, “Synchronous phase- shot interferometry measurements.
demodulation and harmonic rejection of 9-step pixelated dynamic
interferograms,” Opt. Express 20(11), 11734–11739 (2012). Amalia Martínez-García received her PhD in optics at Centro de
7. S. Equis, R. Schnabel, and P. Jacquot, “Snap-shot profilometry Investigaciones en Óptica, Mexico (CIO). She was a research scien-
with the Empirical Mode Decomposition and a 3-layer color sensor,” tist at Centro de Investigación Científica y de Educación Superior de
Opt. Exp. 19(2), 1284–1290 (2011). Ensenada. Currently, she is a full-time researcher at CIO and member
8. J. M. Desse, P. Picart, and P. Tankam, “Digital three-color holographic
interferometry for flow analysis,” Opt. Exp. 16(8), 5471–5480 (2008). level II of the National System of Researchers, Mexico. She is the
9. M. W. Kudenov et al., “Spatial heterodyne interferometry with polari- vice-president of the Mexican Academy of Optics during 2013–2014
zation gratings,” Opt. Lett. 37(21), 4413–4415 (2012). and elected president 2015–2016. Her research area is in optical
10. V. Rosso et al., “Almost-common path interferometer using the sepa- metrology.
ration of polarization states for digital phase-shifting shearography,”
Opt. Eng. 46(10), 105601 (2007). Noel-Ivan Toto-Arellano received his BS degree in physical scien-
11. P. Blain et al., “Combining shearography and interferometric fringe ces at Universidad Veracruzana, México, his MSc in optical sciences
projection in a single device for complete control of industrial appli- from Benemerita Universidad de Puebla in 2005, and his PhD in opti-
cations,” Opt. Eng. 52(8), 084102 (2013).
12. N. I. Toto-Arellano et al., “Phase shifts in the Fourier spectra of phase cal sciences from the same institution in 2008. He did two postdoctoral
gratings and phase grids: an application for one-shot phase-shifting internships at CIO. He currently holds a research professor position in
interferometry,” Opt. Express 16(23), 19330–19341 (2008). Universidad Tecnológica de Tulancingo, Hidalgo, México, supporting
13. O. Bryngdahl, “Polarization-type interference-fringe shifter,” J. Opt. the creation of a photonics engineering program at the same
Soc. Am 62(3), 462–464 (1972). university.
14. H. J. Okoomian, “A two-beam polarization technique to measure
optical phase,” Appl. Opt. 8(11), 2363–2365 (1969) Yukitoshi Otani is a professor at the Center for Optical Research and
15. J. A. Quiroga, J. A. Gómez-Pedrero, and A. García-Botella, “Algorithm Education, Utsunomiya University, Japan. He received his doctorate
for fringe pattern normalization,” Opt. Commun. 197(1–3), 43–51 (2001).
16. J. A. Quiroga and M. Servín, “Isotropic n-dimensional fringe pattern from the University of Tokyo in 1995. He was an associate professor
normalizacion,” Opt. Commun. 224(4–6), 221–227 (2003). at Tokyo University of Agriculture and Technology until 2010 and vis-
17. C. M. Vest, Holographic Interferometry, John Wiley and Sons, New iting professor at the College of Optical Sciences, the University of
York (1979). Arizona, from 2004 to 2005. He is a fellow of SPIE since 2010.
Optical Engineering 112202-5 November 2014 • Vol. 53(11)
Downloaded From: https://www.spiedigitallibrary.org/journals/Optical-Engineering on 07 Dec 2020
Terms of Use: https://www.spiedigitallibrary.org/terms-of-useYou can also read