Clinical Implementation of - VUE Point FXTM White Paper - GE Healthcare
←
→
Page content transcription
If your browser does not render page correctly, please read the page content below
GE Healthcare

Clinical Implementation of
VUE Point FX
                TM

White Paper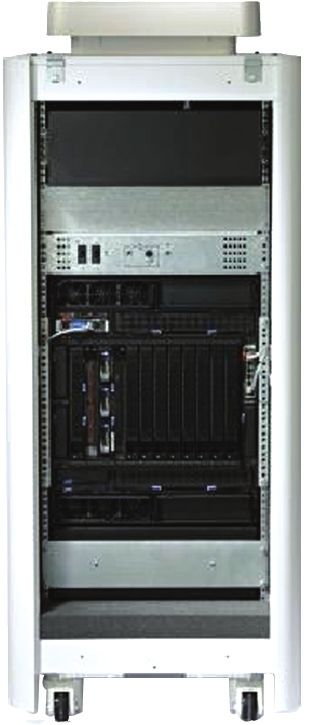
Introduction
This publication is part of a series of white papers aimed at communicating the
importance of each component in the image chain of a PET/CT study.  From data
acquisition to the creation of images available for diagnostic interpretation, each
component of the image chain has a critical function in the generation of high quality
images.  Some of the most important elements in the PET/CT image chain are: the
detector scintillation crystal type and length and photomultiplier tubes (PMTs), the
coincidence processor, the image reconstruction algorithm, data processing, prescription
management, and patient motion correction techniques. The best image quality is
delivered when all these components are well matched to the imaging situation. This
paper will focus on advanced time-of-flight reconstruction with VUE Point FX.

Background                                                              Basics of TOF
Although time-of-flight (TOF) sounds new, as it has                     At a high level, time-of-flight is a technique that localizes the
recently been touted by all three major Positron Emission               decay site based on the arrival time of the photons at the
Tomography (PET) manufacturers, it was in fact developed                detector.  The thing that makes this particularly complex is
and commercialized during the infancy of the PET modality.              that we are trying to measure a distance of approximately a
Scanditronix/PETT Electronics produced and sold a TOF PET               milimeter for a photon traveling at 300,000,000 m/sec.
scanner based on BaF2 scintillators in the late 1980’s.  That           Figure 2 shows the positional uncertainty as a function of the
scanner had a time resolution of approximately 550 pico                 time resolution.  From this data it can easily be understood
seconds (ps).[1] The projected improvement was that the TOF             that localization on the order of a few mm pixel will require
information would provide increased positional certainty to             temporal resolution capability at or better than 10 picoseconds
each event and thereby produce a pseudo increase to the                 (ps).  Temporal resolution with current LBS detector technology
scanner photon sensitivity.  The major challenge with that              is likely limited to around 500 ps.  At this temporal resolution
scanner was the low stopping power of the BaF2 scintillator             the spatial uncertainty is about 15 cm. As a result, TOF does
material to 511 keV positron annihilation photons.  Although            not provide precise localization. Rather, it provides some spatial
TOF did improve the relative signal to noise ratio (SNR) on             likelihood to the origin of decay.  This is like determining where
that system, the intrinsic stopping power of BaF2 was so low,           you are based on the current time zone you are in.  Given the
as compared to other scintillators like Bismuth germinate               1 hour resolution of the time zone system, several cities, states,
(BGO), that the TOF impact was overwhelmed by the initial               and countries may fall into the same time zone.  Therefore
sensitivity loss of utilizing BaF2. As a result TOF was abandoned       positioning by this metric will help you identify the region or
in favor of BGO.[2] Since this initial BaF2 TOF implementation,         country you are in but not your precise location.
alternate scintillators have become available.  Lutetium
based scintillators (LBS) were first developed in 1989 and              That said, the regional location information provided by TOF
commercialized into non-TOF products in 1998. In 1999 Moses             does have an impact. Traditional coincidence detection simply
et al. demonstrated that LBS could achieve approximately
500 pico second time resolution in a bench top single crystal
configuration.[3] However the translation to a whole-body                                                 ▲
scanner configuration required advances in PMT, electronics,                                        350
                                                                        Position Uncertainty (mm)

and computing power. Over time, advances in these                                                   300
technologies have made TOF plausible for modern commercial                                          250
systems. This has resulted in a recent resurgence of interest in TOF.
                                                                                                    950
                                              Figure 1: Commercial                                  150
                                              SP-3000 TOF system
                                                                                                    100
                                              (Scanditronix/PETT
                                              Electronics, St Louis,                                 50
                                              MO) installed at
                                                                                                                                                   ▲

                                                                                                     0
                                              the University of                                           0   200    400     600      800   1000
                                              Washington in the mid                                                 Time Resolution (ps)
                                              80s.
                                                                        Figure 2: Spatial positioning uncertainty as a
                                                                        function of temporal resolution.
identifies that two 511 keV photons have been acquired 20 cm
“simultaneously” between two detectors. However, the 30 cm
reconstruction does not know where between the detectors ▲ 40 cm
the event occurred. Historically the filtered back projection 9
(FBP) reconstruction algorithm had no option but to spread the 8
measured event across the entire image line of response (LOR) 7
TOF Gain
between the detector pair. This puts the signal in the correct 6
5
location but in essence places noise across the remaining
4
image space that lies between the detectors. If there are two
3
events along the same LOR, they will contribute noise to each
2
other in this traditional FBP process. If on the other hand the 1
detection system has the ability to approximate the arrival
▲
0
time of the photon pair, there is an opportunity to back project 0 200 400 600 800 1000
to a region probabilistically localized to the annihilation origin. Time Resolution (ps)
Therefore the noise will also be regionally localized, and two
events that are separated by a distance greater than the time Figure 4: Plot of estimated TOF gain as a function of
uniform activity diameter and timing resolutions.
resolution of the measurement will not contribute noise to each
other. An example of traditional and TOF projections are shown
Two caveats to keep in mind are as follows:
in figure 3.
Traditional 1. The D in equation 1 is the uniform activity distribution
diameter not the attenuation diameter.
2. Equation 1 was derived to estimate TOF value in a FBP
reconstruction, which is no longer employed in general
Detector
Module
clinical practice.
Detector
Module
TOF - System Design Considerations
The capability to measure the difference in arrival times of the
two coincident photons traveling at the speed of light requires
Time-of-Flight
a very bright and fast scintillator, very fast PMTs, a small block
detector design and advanced electronics.
Detector
Module
BGO has a very high stopping power, but its lower light output
and longer decay time results in insufficient timing resolution
for TOF reconstruction. Modern TOF capable scanners are
Detector
Module
using LBS which have high light output and fast decay times.
However LBS does have an inherent reduction in stopping
Figure 3: Traditional and TOF projection examples. power as compared to BGO. In addition, LBS is a relatively
expensive material and often requires design tradeoffs, such
Because TOF increases the information from a single event it as shorter radial depth, for cost effectiveness. It is important
has been considered as a pseudo increase in system sensitivity. to select a system design that maintains sensitivity. Keep in
The impact of TOF information for the FBP process was derived mind the experience of the SP-3000 from the late 1980s. If the
and can be described with Equation 1. [4] initial sensitivity of the scanner it too low, the TOF gains may be
overwhelmed by the initial sensitivity deficit.
D
GTOF =
1.6(c(δ∆t ) 2 )
Given the expense of the scintillator and PMTs, one solution to
Equation 1: TOF description reduce cost is to utilize fewer large PMTs to decode a larger
block detector. However the size (photo-sensitive area) of
The main parameters in this equation are D, the diameter of
the detector is a very critical design consideration for high
the activity distribution, and t the temporal resolution of the
count rate capability. Figure 5 shows the resulting count
detection process. Equation 1 is plotted in figure 4 to show
pileup when a second photon strikes the detector while the
the theoretical improvement of TOF across a range of uniform
detector electronics are still processing a previous event. Pileup
activity diameters and temporal resolutions. From this plot it
can result in missing both events or creating errors in both
can be seen that the estimate of TOF value is approximately a
the timing pick off and energy detection of the events. The
factor of 3 improvement for a 40 cm activity diameter and a
probability of pileup can be directly reduced by packaging the
600 ps time resolution.detectors into smaller block units as shown in Figure 6. This is Vendor GE Vendor A Vendor B
like adding additional ticket booths to a toll highway. However
this design requires an increase in number of block units and Scintillator LBS LBS LBS
PMT channels for the overall system design. Table 1 shows Area (cm ) 2
14 29 162
the block surface area and event processing time for the LBS Busy time (ns) 200 200 120
systems capable of supporting TOF. The probability of pileup Busy area (cm ns) 2
2800 5800 19400
is directly related to the busy area. From this data it can be
seen that the GE design has approximately 1/2 and 1/6 the Table 1: TOF compatible block configurations
probability of pileup as either the vendor A or B respectively,
as shown in Table 1. The impact of pileup on energy, spatial,
950
and temporal resolution was previously published as a function
900
of countrate for a TOF system with a large area detector
850
Time Resolution (ps)
design.[5] The effects of pileup for that scanner are clearly
800
identifiable in the plot of temporal resolution versus countrate
shown in figure 7. 750
700
650
Block 1
600
550
500
0 10 20 30 40 50
PMT 1 PMT 2 Single rate (Mcps)
Figure 7: Temporal resolution vs countrate for a competitor’s large
area detector (Surti et al., JNM 2007)
PET systems have historically run analog signals from the
detector blocks to a central digitization rack. This results
in two effects. First there is a loss in signal fidelity through
the transmission over a distance. Second, given the central
Signal
location of the electronics and the ring geometry of the
scanner, the signal path lengths from the detector to the
Time digitizer differ from block to block and therefore the signal
transit times vary. Both the loss in signal fidelity and the
Figure 5: Pile up in single detector that covers a large surface area variable transit times would contribute to degradation in
temporal resolution for the system. To compensate for this,
the Discovery PET/CT 600 & 690 has distributed digitization
electronics placed at the base of each detector unit as shown
Block 1 Block 2 in figure 8. This results in immediate digitization without loss in
signal fidelity and in uniform transit time from signal origin to
digital timestamp.
PMT 1 PMT 2 PMT 3 PMT 4
Signal
Signal
Time Time
Figure 6: Reduced signal pileup with two smaller blocks that cover the
same surface area as the single block shown in figure 5.Many of the details of this method are described in US Patent
7,129,496:Method and system for scattered coincidence
estimation in a time-of-flight positron emission tomography
system, by C.W. Stearns and R.M. Manjeshwar.
D1
T1
LOR
Figure 8: Distributed digitization units. Example digitizer
circled in yellow. S
Advanced reconstruction: D2
Although there are significant hardware requirements to support T2
TOF, in the end it is really a reconstruction technique. Therefore
the non-TOF reconstruction foundation is critical to maximize the
TOF impact. In 2007 GE launched the VUE Point HD intelligent
reconstruction algorithm that enabled reduced scan times, lower
injections and increased contrast recovery. The key features of Figure 9: Conversion of flight distance into time difference for TOF
that reconstruction are as follows: scatter correction.
• Variance reduction with fully 3D iterative reconstruction
• Resolution enhancement with native geometry modeling Sinogram datasets that contain TOF information are
• Increased quantitative accuracy with model based 3D scatter approximately 60 times larger than non-TOF equivalent.
correction Combine that with the additional computational demands
of the VUE Point FX algorithm and it is easy to understand
• Improved convergence through accurate Poisson noise
the potential impact of reconstruction time on overall exam
modeling with all the corrections in the loop
throughput. With that in mind the Discovery PET/CT 690
Expanding the VUE Point HD algorithm for TOF (VUE Point FX) provides an exclusive use of the IBM BladeCenterTM architecture
requires that timing information be applied to each correction shown in figure 10. This platform enables the capability to
step (normalization, randoms, deadtime, scatter, attenuation) reconstruct VUE Point FX data at a rate of approximately
within the iterative loop. Of these corrections the TOF impact 2 minutes 30 seconds per FOV. Combine that with the
on scatter is most notable. prospective reconstruction manager that initiates each FOV
from a multi FOV exam as soon as the data is available and you
The model-based scatter estimator in VUE Point HD calculates have an acquisition and reconstruction paradigm that supports
the scatter coincidence distribution predicted by the Klein- VUE Point FX use for routine use in clinical exams.
Nishina equation. It operates on every pair of coincident
detectors (one for the scattered photon and one for the
unscattered photon), and for every scatter point within the
patient. For each combination of those parameters, the model
computes the geometry of the scattered event.
Extending the scatter estimate to TOF imaging requires
expansion of the geometry calculation for the coincidence
event. Distance along the photons’ trajectory is converted
into timing difference, and the result for each element of
the calculation may be assigned to a timing bin along the
appropriate line of response as shown in figure 9. After all
scattered coincidences have been assigned, the scatter
estimate is then convolved by the timing response of the
system to form the final TOF scatter estimate.Demission
Dattenuation
Figure 10: IBM BladeCenterTM recon reconstruction engine Figure 11: Common FDG bio-distribution for obese patients.
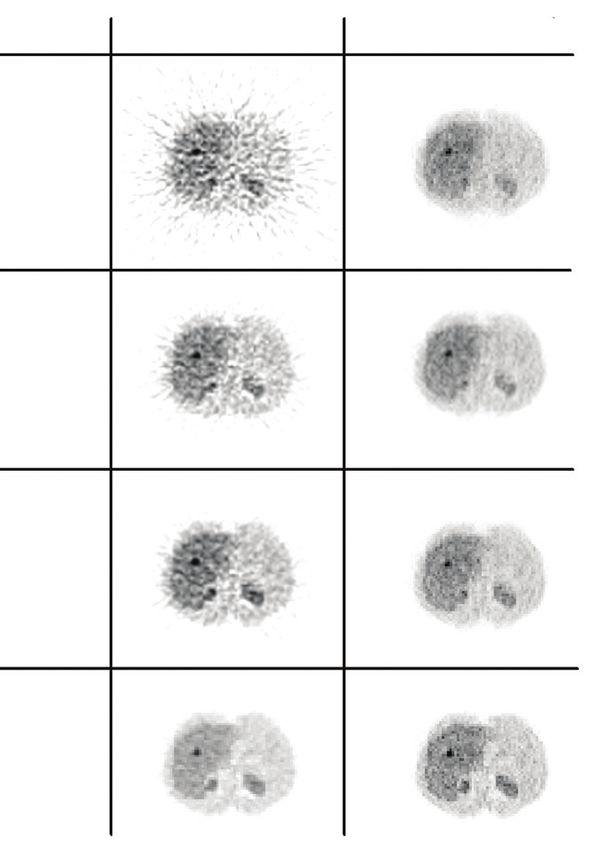
Clinical Experience To fully analyze the impact of this bio-distribution effect, a
A prototype TOF PET/CT system was developed and sited in series of studies were conducted at GE’s Global Research
a mobile van outside Mayo Clinic, Rochester, MN in October, Center (GRC). Normal organ sizes and uptake distribution were
2007. Under an IRB, patients who underwent normal clinical simulated within a layer of lipid tissue with mild activity. Data
scans were consented for a second PET/CT scan in the mobile was generated for temporal resolutions of 200, 500, 650 pico
TOF unit immediately following their clinical procedure. 40 seconds and compared to non-TOF for both FBP and VUE Point
patients were acquired across a range of BMI. Non-TOF vs. FX algorithms. The image data are shown in figure 12. The
TOF assessment was conducted on the self-consistent dataset difference between the FBP non-TOF and 650 ps TOF is very
acquired on the TOF unit by reconstructing with and without dramatic and seems consistent with the gains expected from
TOF information (VUE Point FX and VUE Point HD respectively). equation 1. Likewise, the difference between non-TOF FBP and
Four blinded physicians rated noise, lung boundary definition, non-TOF VUE Point HD is very dramatic. However, the difference
overall image quality, and lesion conspicuity. The conclusions between the VUE Point HD (non-TOF) and 500 or 600 ps VUE
from that initial study were “Noise and overall image quality Point FX reconstructions is far less significant. This speaks to the
degraded as BMI increased for non-TOF and TOF while second caveat on equation 1, it appears consistent for FPB (the
resolution and lung boundary was maintained for TOF. reconstruction method for which the equation was derived), but
Generally the TOF images possessed greater contrast and it doesn’t seem to hold for iterative techniques. Further, it seems
delineation of activity, at the expense of slight increase in noise, that iterative reconstruction done well has already achieved
which can be attributed to the different convergence rates for a significant gain toward the potential of TOF as compared
the TOF and non-TOF reconstructions. There was no significant to FBP. The TOF gains at 200 ps are more striking, but will
increase in the conspicuity of lesions with TOF.”[6] require scintillator and photo sensor technology not currently
commercially available.
Although there were some qualitative differences when FBP VUE Point HD/FX
Figure 12: Obese
applying TOF to the Mayo study, it was lower than originally patient simulation
anticipated through equation 1. As previously mentioned the comparison for
first caveat to equation 1 is that it assumes a uniform activity non-TOF different time
resolution and
distribution. In the Mayo experience we realized that as reconstruction
patients increase in BMI they often obtain a significant layer options.
of lipid tissue surrounding normal sized organs. Since the lipid
tissue has low uptake of FDG, the effective activity diameter for 650 ps
many obese patients is more consistent with that of a standard
size patient as shown in figure 11.
500 ps
200 psAlthough less than anticipated, there is an image quality of improvement in clinical performance such as motion
impact of VUE Point FX reconstruction. GE launched the management for respiration, improved quantitative accuracy
Discovery PET/CT 690 in October of 2008 and installed TOF for response assessment, and workflow efficiency.
enabled commerical systems at six global sites in December,
2008. Example images are shown in figures 13. Systematic
New technology is always exciting. The clinical question is
evaluation of the clinical impact of TOF reconstruction with VUE
whether the new technology provides an improvement in
Point FX is ongoing and will continue as the community of sites
patient management and care that is commensurate to its
grows.
expense. In the face of our challenging and dynamic global
economic environment, GE is aggressively working to answer
this critical question in the appropriate settings. As was
communicated through our healthymagination program
(www.healthymagination.com), our mission is to increase
access, reduce cost and increase quality.
VUE Point HD
References
1) Lewellen et. al, Performance Measurements of the SP3000/UW Time of Flight PET
Emission Tomograph, 1988 IEEE TNS
2) Lewellen, Time of Flight PET, 1997
3) Moses et. al, Prospect of Time of Flight PET using LSO scintillator, 1999 IEEE TNS
VUE Point FX
Figure 13: Clinical example from Discovery PET/CT 690.
Conclusions:
The experience with BaF2 TOF systems in the late 1980’s is
a key reminder that TOF in and of itself doesn’t guarantee
success. As with most system features, TOF requires a
complete system design that does not overly sacrifice intrinsic
slice sensitivity, provides adequate temporal resolution,
maintains a stable temporal resolution across a range of
operating conditions, applies sophisticated reconstruction
techniques and provides reconstructed images in a timeframe
consistent with the exam duration. Achieving these design
requirements demands cutting edge technology that will not
be obtained without expense.
Even with the best system design available today, the clinical
impact of TOF has not been definitively demonstrated. Much
of the value theory (such as equation 1) for TOF is based on
outdated FBP reconstruction methodologies. In addition
many large or obese patients don’t exhibit a large FDG
activity distribution diameter. From the recent literature
there is no question that TOF provides some improvements
to physics experiments and phantom measurements. There
are limited data on clinical experience, but large studies that
clearly establish the value have yet to be conducted. GE has
developed a cutting edge TOF product and is actively engaged
in the pursuit of understanding the potential clinical gains. In
addition, TOF gains have to be compared to alternate avenues©2009 General Electric Company – All rights reserved.
GE, GE Monogram and Discovery are trademarks of
General Electric Company. GE Healthcare,
a division of General Electric Company.
General Electric Company reserves the right to make changes in
specification and features shown herein, or
discontinue the product described at any time without notice or
obligation. Contact your GE representative for
the most current information.
About GE Healthcare
GE Healthcare provides transformational medical
technologies and services that are shaping a new age
of patient care. Our broad expertise in medical imaging
and information technologies, medical diagnostics, patient
monitoring systems, drug discovery, biopharmaceutical
manufacturing technologies, performance improvement
and performance solutions services help our customers to
deliver better care to more people around the world at a
lower cost. In addition, we partner with healthcare leaders,
striving to leverage the global policy change necessary
to implement a successful shift to sustainable healthcare
systems.
Our “healthymagination” vision for the future invites the
world to join us on our journey as we continuously develop
innovations focused on reducing costs, increasing access
and improving quality and efficiency around the world.
GE Healthcare
3000 North Grandview Blvd
Waukesha, WI 53188
U.S.A.
www.gehealthcare.com
PET-0228-09.09-EN-USYou can also read