MiR-101b Regulates Lipid Deposition and Metabolism of Primary Hepatocytes in Teleost Yellow Catfish Pelteobagrus fulvidraco - MDPI
←
→
Page content transcription
If your browser does not render page correctly, please read the page content below
G C A T
T A C G
G C A T
           genes
Article
miR-101b Regulates Lipid Deposition and
Metabolism of Primary Hepatocytes in Teleost Yellow
Catfish Pelteobagrus fulvidraco
Guang-Hui Chen 1 , Tao Zhao 1 , Xiao-Lei Wei 1 , Dian-Guang Zhang 1 , Mei-Qin Zhuo 1 and
Zhi Luo 1,2, *
 1   Key Laboratory of Freshwater Animal Breeding, Ministry of Agriculture of P.R.C., Fishery College,
     Huazhong Agricultural University, Wuhan 430070, China; cgh0626@webmail.hzau.edu.cn (G.-H.C.);
     zhaotao2017@webmail.hzau.edu.cn (T.Z.); xiaolei1205@webmail.hzau.edu.cn (X.-L.W.);
     ZDG@webmail.hzau.edu.cn (D.-G.Z.); zmq@mail.hzau.edu.cn (M.-Q.Z.)
 2   Laboratory for Marine Fisheries Science and Food Production Processes, Qingdao National Laboratory for
     Marine Science and Technology, Qingdao 266237, China
 *   Correspondence: luozhi99@mail.hzau.edu.cn; Tel.: +86-27-8728-2113; Fax: +86-27-8728-2114

 Received: 15 July 2020; Accepted: 24 July 2020; Published: 29 July 2020

 Abstract: Excessive fat deposition in the hepatocytes, associated with excess dietary fat intake,
 was related to the occurrence of fatty livers in fish. miR-101b plays the important roles in controlling
 lipid metabolism, but the underlying mechanism at the post-transcriptional level remains unclear.
 The purpose of this study is to explore the roles and mechanism of miR-101b-mediating lipid
 deposition and metabolism in yellow catfish Pelteobagrus fulvidraco. We found that miR-101b
 directly targeted fatty acid translocase (cd36), caspase9 (casp9) and autophagy-related gene 4A (atg4a).
 Furthermore, using palmitic acid (PA) or oleic acid (OA) to incubate the primary hepatocytes of
 yellow catfish, we demonstrated that miR-101b inversely regulated cd36, casp9, and atg4a expression
 at the transcriptional level; the inhibition of miR-101b aggravated fatty acids (FAs, PA or OA)-induced
 lipid accumulation, indicating that miR-101b mediated FAs-induced variations of lipid metabolism in
 yellow catfish. Taken together, our study gave novel insight into the regulatory mechanism of lipid
 deposition and metabolism and might provide potential targets for the prevention and treatment of
 fatty livers in fish.

 Keywords: miR-101b; lipid deposition; metabolism; transcriptional regulation; fish

1. Introduction
     At present, excessive hepatic lipid deposition and fatty livers are a common phenomenon for
fish under the intensive aquaculture. Excessive fat intake will aggravate lipid deposition in the liver
and hepatocytes, which could contribute to fatty livers and hepatic steatosis [1]. Lipid deposition,
metabolism, and their regulatory processes are very complex, which involves in the balance among
lipid absorption, transport, lipogenesis, and lipolysis, and several crucial enzymes and transcriptional
factors participate in these metabolic processes [2]. Fatty acid translocase (CD36) is a key regulator in the
FAs transport [3]. 6-phosphogluconate dehydrogenase (6PGD), glucose-6-phosphate dehydrogenase
(G6PD), malic enzyme (ME) and isocitrate dehydrogenase (ICDH) play the predominant roles in the
generation of NADPH, which is necessary for lipogenesis. Fatty acid synthase (FAS) is the main
lipogenic enzyme that produces FAs [4]. In addition, accumulating evidences suggest apoptosis and
autophagy are the pivotal pathways in regulating lipid metabolism [5,6]. Casp9 and ATG4 are the
pivotal proteins involved in the apoptosis and autophagy pathways, respectively, which contributes to
the control of lipid metabolism [7–9]. However, their regulatory mechanism remains unknown.

Genes 2020, 11, 861; doi:10.3390/genes11080861                                    www.mdpi.com/journal/genes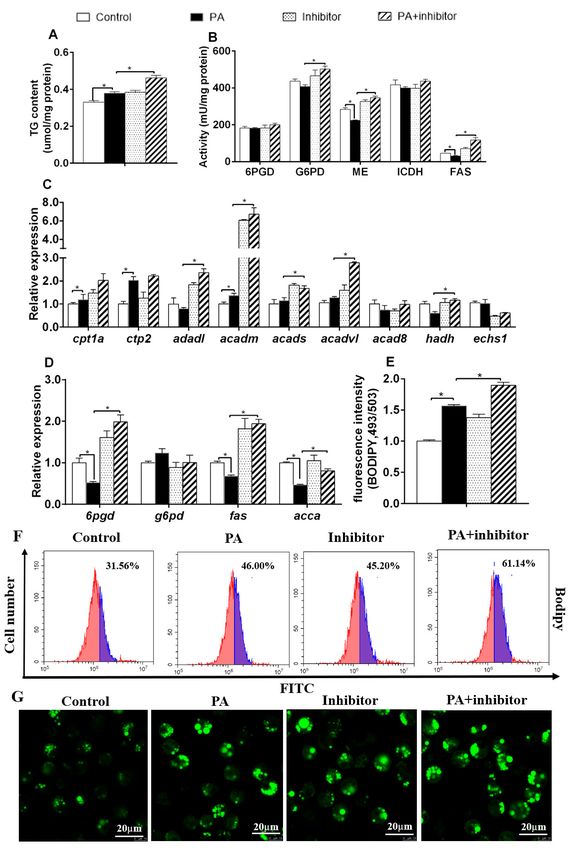
Genes 2020, 11, 861                                                                                  2 of 11

      MicroRNAs (miRNAs) are highly conserved small non-coding RNAs with 19–25 nucleotides (nt)
in length [10]. MiRNAs inhibit translation or degradation of target genes by base-pairing to the 30 -UTR
of target mRNAs [11,12]. Evidences show that miRNAs are implicated in many physiological and
pathological processes of fatty liver diseases [12] and act as key regulators in lipid metabolism [13–15].
Thus, miRNAs may be a novel therapeutic target to ameliorate fatty liver diseases.
      miR-101 is an important miRNA and is considered as the biomarker for metabolic diseases,
such as type 2 diabetes [16]. miR-101 has two isoforms, miR-101a and miR-101b, that are expressed
differentially in many cell types. Recently, we found that miR-101b expression in the liver tissues was
remarkably down-regulated in yellow catfish Pelteobagrus fulvidraco fed with high-fat diet (HFD) [15].
Moreover, HFD induced the dysfunction of hepatic lipid metabolism of yellow catfish. At present,
the roles and mechanism of miR-101b in regulating lipid metabolism have not been investigated.
The present study hypothesized that miR-101b regulated HFD-induced changes of lipid metabolism.
Compared to the animal model, the cell culture of hepatocytes was considered to be a reliable model
for testing metabolism for its controllability in the experimental conditions, avoidance for individual
differences, and its acceptance for animal welfare [17,18]. Here, using dual-luciferase reporter assay,
we determined the target genes of miR-101b in yellow catfish. Using primary hepatocytes from yellow
catfish, we identified the roles and mechanism of miR-101b regulating FAs-induced variations of
lipid metabolism.

2. Material and Methods

2.1. Experimental Animals and Cells
     Juvenile yellow catfish were purchased from local farm (Hubei Bairong Fisheries Farm,
Huanggang). HEK293 cells were obtained from the Cell Resource Center in Fishery College of
Huazhong Agricultural University (HZAU). Our study followed the guideline of HZAU for the use
of experimental animals and was approved by the Ethics Committee of HZAU (identification code:
Fish-2016-0420, Date: 20 April 2016).

2.2. Validation of miR-101b Target Genes
     The target genes of miR-101b were validated as described in Chen et al. [15]. At first, we synthesized
wild type (WT) DNA fragments of the 30 UTRs of cd36, casp9, and atg4a containing miR-101b putative
binding site, and subcloned them into pmirGLO vector (Promega, USA) with the SacI and XhoI sites.
Mutant (MUT) recombinant plasmids were synthesized by overlap-PCR, and the 7 mer of miR-101b
Seed Sequence was mutated to ACAGTAC.
     Four different treatment groups were designed: WT plasmids + miR-101b negative control (NC,
40 nM), WT plasmids + miR-101b mimics (40 nM), MUT plasmids + miR-101b NC, MUT plasmids +
miR-101b mimics. The cells were incubated for 24 h, and harvested for luciferase activity assays, based
on Chen et al. [15].

2.3. Primary Hepatocytes Culture and Treatment
     The primary hepatocytes from yellow catfish were isolated and cultured following our previous
studies [15,19]. Four groups were designed: Control (FA-free BCA + NC), miR-101b mimics/inhibitor
(40 nM), FAs (0.25 mM PA/0.5 mM OA+NC), FAs + miR-101b mimics/inhibitor, respectively.
The concentrations of FAs and miRNA inhibitor/mimics were chosen on the basis of our previous
study [15]. The cells were subsequently treated for 24 h and collected for the determination of lipid
deposition, enzymatic activity, and RT-qPCR analysis.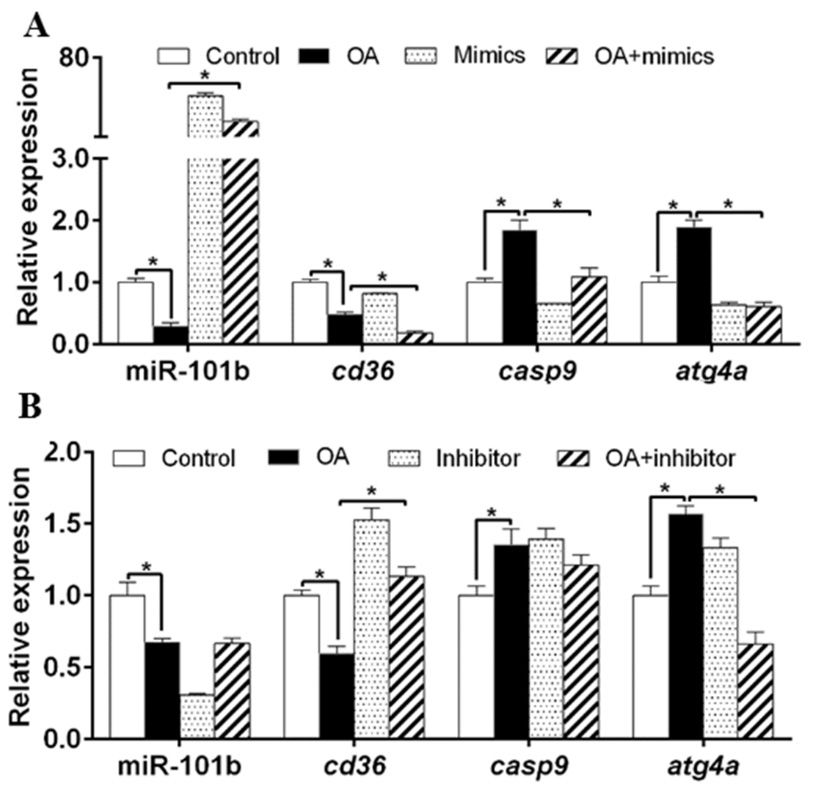
Genes 2020, 11, 861                                                                             3 of 11

2.4. Sample Analysis

2.4.1. Lipid Deposition
     Triglyceride (TG) contents were measured using the commercial kits, based on Chen et al. [15].
     Bodipy 493/503 staining was used to determine intracellular lipid droplets (LDs) on the basis of
the study by Zhao et al. [20]. The intensity of fluorescence of primary hepatocytes were determined
via the laser confocal microscope (Leica, Wetzlar, Germany).

2.4.2. Enzymatic Activity Assays
    The determination of lipogenic enzymes activities, including 6PGD, G6PD, ME, ICDH and FAS,
were performed as described in Chen et al. [3]. We measured the protein content with BSA as the
standard [21].

2.4.3. RT-qPCR Assays
     The gene expression was determined using the RT-qPCR method as reported by Chen et al. [22],
and microRNAs expression was assayed by the method of stem–loop RT–PCR [16]. The specific
stem-loop primers and PCR primers for each gene are shown in Table S1. To filtrate the most stable
two genes as housekeeping gene using geNorm software, we detected the mRNA expression of
housekeeping genes of β-actin, gapdh, b2m, hprt, elfa, tbp and ubce. We used the 2−∆∆Ct method to
calculate the relative expression of genes [23].

2.5. Statistical Analysis
     All these data are expressed as mean ± SEM. The Shapiro-Wilk test was used to normalize all data.
Bartlett’s test was used to detect the homogeneity of variances. Student’s t-test was used to compare
the difference between two groups. P < 0.05 was considered to be statistically significant. SPSS19.0
software was used for the data analysis.

3. Results

3.1. miR-101b Directly Targeted cd36, casp9, and atg4a
     We used Targetscan Fish 6.2 and miRWalk 3.0 to identify target genes of miR-101b. Figure 1A
showed that the 30 UTRs of cd36, casp9 and atg4a of yellow catfish possessed the potential miR-101b
binding sites. Compared to the NC, miR-101b mimics dramatically suppressed the luciferase activities
of pmirGLO-WT-cd36, pmirGLO-WT-casp9 and pmirGLO-WT-atg4a in HEK-293T cells, while the
luciferase activity of pmirGLO-MUT-cd36, pmirGLO-MUT-casp9 and pmirGLO-MUT-atg4a were
rescued (Figure 1C–E). These results suggested that miR-101b could directly target cd36, casp9 and
atg4a.
Genes 2020, 11, 861 4 of 11
Figure 1. miR-101b targeted cd36, casp9 and atg4a in yellow catfish. (A,B) Schematic representation of
Figure 1.
wild type (WT) and mutant (MUT) for the miR-101b target sequence within the 30 UTR of cd36, casp9,
and atg4a of yellow catfish. Seed sequences are highlighted in bold. (C–E) The luciferase activities of
the reporter of cd36, casp9, and atg4a of yellow catfish. Results are expressed as the mean ± SEM, n = 3.
* P < 0.05 (Student’s t test).
3.2. miR-101b Inversely Regulated cd36, casp9, and atg4a Expression in Hepatocytes of Yellow Catfish
PA down-regulated miR-101b, cd36 and casp9 expression, but up-regulated the gene concentrations
of atg4a (Figure 2A). Compared to PA group, miR-101b mimics and PA co-incubation up-regulated gene
concentrations of miR-101b and casp9, but down-regulated of gene concentrations of cd36 and atg4a.
Compared to PA
Figure 1. group, co-treatment with miR-101b inhibitor and PA up-regulated gene concentrations
of miR-101b, cd36 and atg4a (Figure 2B).
Figure 2.
1
Figure 2. 2.The influences of PA and miR-101b mimics (A) or inhibitor (B) co-incubation on gene
Figure
expression of miR-101b and its target genes in yellow catfish. Results are expressed as the mean ± SEM,
n = 3. * P < 0.05 (Student’s t test).
1Genes 2020, 11, 861 5 of 11
OA incubation down-regulated miR-101b and cd36 expression, but up-regulated gene
concentrations of atg4a
Genes 2020, 11, x FOR and casp9 (Figure 3A). Compared to OA group, co-treatment with miR-101b
PEER REVIEW 5 of 11
mimics and OA up-regulated miR-101b concentration, but down-regulated gene concentrations of cd36,
casp9 and atg4a.
regulated Compared
expression leveltoof
OAcd36,
group,
butco-treatment with miR-101b
down-regulated inhibitor
expression andatg4a
level of OA up-regulated
(Figure 3B).
expression cd36, down-regulated expression level of atg4a
Altogether, these results indicated that miR-101b mediated the FA-induced changes of cd36, these
level of but (Figure 3B). Altogether, casp9
results indicated
and atg4a that miR-101b mediated the FA-induced changes of cd36, casp9 and atg4a expression.
expression.
Figure 3.
Figure 3. The
The influences
influences ofof oleic
oleic acid
acid (OA)
(OA) and
and miR-101b
miR-101b mimics
mimics (A)
(A) or
or inhibitor
inhibitor (B)
(B) co-incubation
co-incubation on
on
geneexpression
gene expressionofofmiR-101b
miR-101band anditsitstarget
targetgenes
genesininyellow
yellow catfish.
catfish. Results
Results areare expressed
expressed as as
thethe mean
mean ±
SEM, n =n 3.
± SEM, * PGenes 2020, 11, 861 6 of 11
Genes 2020, 11, x FOR PEER REVIEW 6 of 11
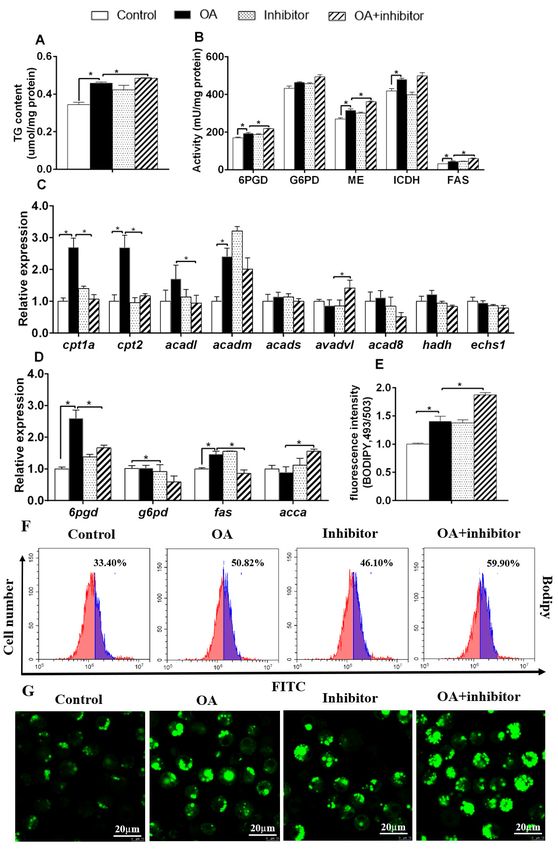
Figure 4.4.The
Figure Theinfluences
influences of PA
of and
PA miR-101b inhibitor
and miR-101b co-incubation
inhibitor on lipid deposition
co-incubation on lipid in hepatocytes
deposition in
of yellow catfish. (A) TG content; (B) lipogenic activities; (C,D) mRNA expression of
hepatocytes of yellow catfish. (A) TG content; (B) lipogenic activities; (C–D) mRNA expression oflipid metabolism;
(E) fluorescence
lipid metabolism; intensity after Bodipy
(E) fluorescence 493/503
intensity staining;
after Bodipy(F) flow cytometric
493/503 analysis
staining; (F) of Bodipyanalysis
flow cytometric 493/503
staining; (G) the images of Bodipy 493/503–stained LDs; Scale bars, 20 µm. Results are expressed
of Bodipy 493/503 staining; (G) the images of Bodipy 493/503–stained LDs; Scale bars, 20 μm. Results as the
mean ± SEM, n = 3. * P < 0.05 (Student’s t test).
are expressed as the mean ± SEM, n = 3. * P < 0.05 (Student’s t test).Genes 2020, 11, 861 7 of 11
Genes 2020, 11, x FOR PEER REVIEW 7 of 11
3.4. miR-101b Mediated OA-Induced Changes of Lipid Metabolism in Primary Hepatocytes of Yellow Catfish
3.4. miR-101b Mediated OA-Induced Changes of Lipid Metabolism in Primary Hepatocytes of Yellow Catfish
OA incubation increased TG content, up-regulated activities of 6PGD, ME, ICDH and FAS,
and mRNA OAcontents
incubationofincreased
6pgd, fas,TGcpt1a,
content, up-regulated
cpt2 and acadm activities
(Figure of 5A–D).
6PGD, ME, ICDH andto
Compared FAS,
OAand
group,
mRNA contents of 6pgd, fas, cpt1a, cpt2 and acadm (Figure 5A–D). Compared to OA group,
miR-101b inhibitor and OA co-treatment decreased increased TG content, G6PD, ME and FAS activities, miR-101b
inhibitor and OA co-treatment decreased increased TG content, G6PD, ME and FAS activities, and
and acca and adadl mRNA expression, but decreased mRNA expression of 6pgd, g6pd and fas, together
acca and adadl mRNA expression, but decreased mRNA expression of 6pgd, g6pd and fas, together
with mRNA expression of cpt1a, cpt2 and acadl. miR-101b inhibitor pretreatment also aggravated
with mRNA expression of cpt1a, cpt2 and acadl. miR-101b inhibitor pretreatment also aggravated OA-
OA-induced increase of fluorescence intensity, as shown by BDIPY 493/503 staining (Figure 5E–G).
induced increase of fluorescence intensity, as shown by BDIPY 493/503 staining (Figure 5E–G). Thus,
Thus,miR-101b
miR-101b mediated
mediated OA-induced
OA-induced variations
variations of metabolism
of lipid lipid metabolism in hepatocytes
in hepatocytes of yellowofcatfish.
yellow catfish.
Figure 5. The
Figure influences
5. The influencesof ofOAOAand
andmiR-101b
miR-101b inhibitor co-incubation
inhibitor co-incubation on on lipid
lipid deposition
deposition in the
in the
hepatocytes of yellow
hepatocytes catfish.
of yellow (A) (A)
catfish. TG TG
content; (B)(B)
content; lipogenic
lipogenicactivities;
activities;(C,D)
(C–D)mRNA
mRNAexpression
expression of
of lipid
lipid metabolism;
metabolism; (E) fluorescence
(E) fluorescence intensity
intensity after after
BodipyBodipy 493/503
493/503 staining;(F)
staining; (F)flow
flow cytometric
cytometric analysis
analysis of
Bodipy 493/503 staining; (G) the images of Bodipy 493/503–stained LDs; Scale bars, 20 µm. Results are
expressed as the mean ± SEM, n = 3. * P < 0.05 (Student’s t test).Genes 2020, 11, 861 8 of 11
4. Discussion
Accumulating evidences have shown that miRNAs are implicated in the lipid
metabolism [14,15,24], suggesting that miRNAs may be a novel therapeutic target to fatty livers.
Thus, it is rather crucial to identify novel miRNAs that target key nodes of lipid metabolism and
explore their regulatory mechanisms.
In the present study, we found that miR-101b directly targeted cd36, casp9 and atg4a by using
reporter gene analysis. Moreover, miR-101b inhibitor elevated gene concentrations of cd36, casp9, and
atg4a in hepatocytes of yellow catfish, suggesting that miR-101b inversely controlled the expression of
cd36, casp9 and atg4a. CD36, also called fatty acid translocase, is important in the FAs transporters [25].
Increased expression of cd36 was beneficial for absorption of FAs. Four ATG4 subtypes have been
identified in mammals, and ATG4a protein could regulate the deconjugation of LC3, which ultimately
affects the amplitude of the autophagic response [26,27]. Elevated expression of atg4a could promote
the formation of autophagosomes, which potentially influenced lipid metabolism [7,20]. Casp9 plays a
central role in the mitochondrial apoptotic pathway [28], which regulates lipolysis [8]. Interestingly,
PA + mimics/OA + mimics treatment in hepatocytes led to a robust reduction in expression of cd36
but increased the expression of cas9 and atg4a. We suspected that these genes were involved in the
different roles of lipid metabolism, and it required further exploration. Similarly, studies found that
ATG4D was the target gene of miR-101 [29,30].
To further investigate the mechanism of miR-101b-mediating FAs-induced lipid deposition
in hepatocytes, we determined the effects of FAs and miR-101b inhibitor on lipid deposition and
metabolism. In the diet, serum and liver tissue, PA (a saturated fatty acid) and OA (a monounsaturated
fatty) are two of the most abundant FAs [31]. We conducted the experiment by the co-treatment with
miR-101b inhibitor/mimics and OA/PA in hepatocytes of yellow catfish, respectively. In the present
study, miR-101b mimics pretreatment aggravated OA/PA-induced down-regulation of cd36 mRNA
concentration but miR-101b inhibitor pretreatment alleviated OA/PA-induced down-regulation of cd36
mRNA concentration. Given that CD36 played the crucial roles in lipid metabolism [25], our data
established miR-101b was a critical regulator of hepatic lipid metabolism by directly targeting cd36.
On the other hand, we observed that higher hepatic TG level, associated with elevated lipogenic
activities and gene expression in miR-101b interfering hepatocytes of yellow catfish, strongly indicating
that miR-101b was required for normal lipid homeostasis. Unexpectedly, PA/OA reduces the expression
of CD36 in hepatocytes. We suspected that there may be a negative feedback mechanism that the
excessive accumulation of TG in hepatocytes inhibited the expression of CD36, which ultimately
inhibited the absorption of fatty acids, as reported in other studies [32].
In the present study, PA increased TG content, but reduced ME and FAS activities, and mRNA
concentrations of 6pgd, fas, acca and cd36. Studies in our laboratory pointed out that PA elevated
NEFA content and regulated gene expression of lipid absorption in hepatocytes of yellow catfish [33].
The decreased gene expression and enzymatic activities related to lipid absorption as well as lipogenesis
contributed to suppress lipid accumulation [3]. The PA-induced suppression in gene expression and
activities of lipid absorption and lipogenic enzymes may be associated with the negative feedback
regulation caused by excessive lipid deposition in hepatocytes and the protection against the liptoxicity,
as suggested by several authors [34,35]. The PA-induced increase of TG content in miR-101b inhibitor
+ PA group was aggravated, suggesting that miR-101b inhibitor could accelerate the synthesis process
from FAs to TG. In addition, miR-101b inhibitor reversed the reduction of G6PD, ME and FAS activities,
and mRNA expression of ca36, 6pgd, fas and acca induced by PA. Lipid absorption and lipogenesis
are the fundamental regulatory way in lipid metabolism [3]. Thus, our results demonstrated that
the miR-101b regulated PA-induced lipid metabolism via lipid absorption and lipogenesis. On the
other hand, the present study showed that OA incubation increased TG content, up-regulated 6PGD,
ME, ICDH and FAS activities, and mRNA concentrations of 6pgd and fas, but down-regulated cd36
mRNA concentration. Previous studies pointed out that OA improved FA and TG synthesis via
lipogenesis, thereby inducing lipid accumulation [36,37]. We found that miR-101b inhibitor aggravatedGenes 2020, 11, 861 9 of 11
OA-induced increase of TG content, G6PD, ME, and FAS activities, and mRNA concentrations of 6pgd,
g6pd and fas, suggesting that miR-101b mediated OA-induced changes of lipid metabolism indirectly
via these enzymes and genes. In addition, flow cytometry and confocal microscopy analysis indicated
that miR-101b inhibitor pretreatment aggravated the PA or OA-induced increase in the volume and
amounts of LDs in hepatocytes. Here, we provided in vitro data to demonstrate that miR-101b was a
key mediator of lipid metabolism in yellow catfish.
In the present study, PA and OA could promote the expression level of genes involved in fatty
acid β-oxidation. Wu et al. [9] found that HFD and FAs incubation elevated the capacity of fatty acid
β-oxidation. Here, although PA and OA increased TG content, PA and OA produced the adverse
effect on lipogenic activities and gene expression. Similarly, other studied found that PA and OA
produced different effects on lipid metabolism in several hepatocytes [38,39]. Therefore, different
sources of FAs induced the different capacity for lipid synthesis, as reported by other workers [38,40].
Moreover, Mei et al. [38] pointed out that OA, as the unsaturated fatty acid, could promote the
formation of TG-enriched LDs, but PA, as the saturated fatty acid, had the poor conversion into LDs.
Zámbó et al. [41] found that the deposition of FAs was deemed to possess higher lipotoxicity and more
harmful to hepatocytes than TG. Thus, the hepatocytes could readily incorporate FAs into cytoplasmic
TGs, which might protect cells against their lipotoxicity [32,40].
In conclusion, miR-101b directly targeted cd36, casp9, and atg4a; miR-101b inversely regulated cd36,
casp9, and atg4a expression at the transcriptional level; miR-101b mediated FAs-induced variations
of lipid metabolism through directly targeting cd36; PA and OA incubation induced different effects
on lipid metabolism of hepatocytes. Taken together, we determined the roles of miR-101b mediating
FAs-induced changes of lipid metabolism, which might help further our understanding of mechanisms
that contribute to the prevention and treatment of fatty liver and its related metabolic disorders.
Supplementary Materials: The following are available online at http://www.mdpi.com/2073-4425/11/8/861/s1,
Table S1: Primers used for qRT-PCR analysis.
Author Contributions: Z.L. and G.-H.C. designed the experiment; G.-H.C. conducted the experiment with the
help of T.Z., X.-L.W., D.-G.Z., M.-Q.Z.; G.-H.C. and T.Z. analyzed the data; G.-H.C. drafted the manuscript and
Z.L. revised the manuscript. All the authors read and approved the manuscript. All authors have read and agreed
to the published version of the manuscript.
Funding: This work was supported by National Key R&D Program of China (grant no. 2018YFD0900400) and the
National Natural Science Foundation of China (Grant No. 31422056, 31372547).
Acknowledgments: We thank all the staffs in Laboratory of Molecular Nutrition, Fishery College, Huazhong
Agricultural University, for their help during the experiments.
Conflicts of Interest: The authors disclosed no conflict of interest
References
1. De Morentin, P.B.M.; Varela, L.; Ferno, J.; Nogueiras, R.; Dieguez, C.; Lopez, M. Hypothalamic lipotoxicity
and the metabolic syndrome. Biochim. Biophys. Acta 2010, 1801, 350–361. [CrossRef] [PubMed]
2. Spiegelman, B.M.; Flier, J.S. Obesity and the regulation of energy balance. Cell 2001, 104, 531–543. [CrossRef]
3. Chen, G.H.; Luo, Z.; Hogstrand, C.; Wu, K.; Ling, S.C. SREBP1, PPARG and AMPK pathways mediated
the Cu-induced change in intestinal lipogenesis and lipid transport of yellow catfish Pelteobagrus fulvidraco.
Food Chem. 2018, 269, 595–602. [CrossRef] [PubMed]
4. Elliott, W.H.; Elliott, D.C. Biochemistry and Molecular Biology, 4th ed.; Oxford University: Oxford, UK, 2009.
5. Singh, R.; Kaushik, S.; Wang, Y.; Xiang, Y.; Novak, I.; Komatsu, M.; Czaja, M.J. Autophagy regulates lipid
metabolism. Nature 2009, 458, 1131–1135. [CrossRef]
6. Boren, J.; Brindle, K.M. Apoptosis-induced mitochondrial dysfunction causes cytoplasmic lipid droplet
formation. Cell Death Differ. 2012, 19, 1561–1570. [CrossRef]
7. Wei, C.C.; Luo, Z.; Hogstrand, C.; Xu, Y.H.; Wu, L.X.; Chen, G.H.; Song, Y.F. Zinc reduces hepatic lipid
deposition and activates lipophagy via Zn2+ /MTF-1/PPARα and Ca2+ /CaMKKβ/AMPK pathways. FASEB J.
2018, 32, 6666–6680. [CrossRef]Genes 2020, 11, 861 10 of 11
8. Li, D.D.; Luo, Z.; Ling, S.C.; Wu, K.; Chen, G.H.; Cheng, J. Mitochondrial apoptotic pathway mediated the
Zn-induced lipolysis in yellow catfish Peteobagrus fulvidraco. Chemosphere 2018, 208, 907–915. [CrossRef]
9. Wu, K.; Zhao, T.; Hogstrand, C.; Xu, Y.C.; Ling, S.C.; Chen, G.H.; Luo, Z. FXR-mediated inhibition of
autophagy contributes to FA-induced TG accumulation and accordingly reduces FA-induced lipotoxicity.
Cell Commun. Signal. 2020, 18, 47. [CrossRef]
10. Ambros, V. The functions of animal microRNAs. Nature 2004, 431, 350. [CrossRef]
11. Bartel, D.P. MicroRNAs: Target recognition and regulatory functions. Cell 2009, 136, 215–233. [CrossRef]
12. Liu, C.H.; Ampuero, J.; Gil-Gómez, A.; Montero-Vallejo, R.; Rojas, Á.; Muñoz-Hernández, R.;
Romero-Gómez, M. miRNAs in patients with non-alcoholic fatty liver disease: A systematic review
and meta-analysis. J. Hepatol. 2018, 69, 1335–1348. [CrossRef] [PubMed]
13. Fernández-Hernando, C.; Suárez, Y.; Rayner, K.J.; Moore, K.J. MicroRNAs in lipid metabolism. Curr. Opin.
Lipidol. 2011, 22, 86. [CrossRef] [PubMed]
14. Cui, H.Y.; Chen, Q.L.; Tan, X.Y.; Zhang, D.G.; Ling, S.C.; Chen, G.H.; Luo, Z. MiR-205 mediated Cu-induced
lipid accumulation in yellow catfish Pelteobagrus fulvidraco. Int. J. Mol. Sci. 2018, 19, 2980. [CrossRef]
[PubMed]
15. Chen, G.H.; Wu, K.; Zhao, T.; Ling, S.C.; Liu, W.; Luo, Z. miR-144 mediates high fat–induced changes of
cholesterol metabolism via direct regulation of C/EBPα in the liver and isolated hepatocytes of yellow catfish.
J. Nutr. 2020, 150, 464–474. [CrossRef] [PubMed]
16. Higuchi, C.; Nakatsuka, A.; Eguchi, J.; Teshigawara, S.; Kanzaki, M.; Katayama, A.; Sasaki, S. Identification
of circulating miR-101, miR-375 and miR-802 as biomarkers for type 2 diabetes. Metabolism 2015, 64, 489–497.
[CrossRef] [PubMed]
17. Pesonen, M.; Andersson, T.B. Fish primary hepatocyte culture; an important model for xenobiotic metabolism
and toxicity studies. Aquat. Toxicol. 1997, 37, 253–267. [CrossRef]
18. Pesonen, M.; Teivainen, P.; Lundström, J.; Jakobsson, E.; Norrgren, L. Biochemical responses of fish sac fry
and a primary cell culture of fish hepatocytes exposed to polychlorinated naphthalenes. Arch. Environ.
Contam. Toxicol. 2000, 38, 52–58. [CrossRef]
19. Zhuo, M.Q.; Luo, Z.; Wu, K.; Zhu, Q.L.; Zheng, J.L.; Zhang, L.H. Regulation of insulin on lipid metabolism
in freshly isolated hepatocytes from yellow catfish (Pelteobagrus fulvidraco). Comp. Biochem. Phys. 2014,
177–178B, 21–28. [CrossRef]
20. Zhao, T.; Wu, K.; Hogstrand, C.; Xu, Y.H.; Chen, G.H.; Wei, C.C.; Luo, Z. Lipophagy mediated
carbohydrate-induced changes of lipid metabolism via oxidative stress, endoplasmic reticulum (ER) stress
and ChREBP/PPARγ pathways. Cell. Mol. Life Sci. 2020, 77, 1987–2003. [CrossRef]
21. Bradford, M.M. A rapid and sensitive method for the quantitation of microgram quantities of protein utilizing
the principle of protein-dye binding. Anal. Biochem. 1976, 72, 248–254. [CrossRef]
22. Chen, G.H.; Lv, W.H.; Xu, Y.H.; Wei, X.L.; Xu, Y.C.; Luo, Z. Functional analysis of MTF-1 and MT promoters
and their transcriptional response to zinc (Zn) and copper (Cu) in yellow catfish Pelteobagrus fulvidraco.
Chemosphere 2020, 246, 125792. [CrossRef] [PubMed]
23. Livak, K.J.; Schmittgen, T.D. Analysis of relative gene expression data using real-time quantitative PCR and
the 2-∆∆CT method. Methods 2001, 25, 402–408. [CrossRef] [PubMed]
24. Petri, A.; Lindow, M.; Kauppinen, S. MicroRNA silencing in primates: Towards development of novel
therapeutics. Cancer Res. 2009, 69, 393–395. [CrossRef] [PubMed]
25. Le Foll, C.; Dunn-Meynell, A.; Musatov, S.; Magnan, C.; Levin, B.E. FAT/CD36: A major regulator of neuronal
fatty acid sensing and energy homeostasis in rats and mice. Diabetes 2013, 62, 2709–2716. [CrossRef]
[PubMed]
26. Li, M.; Hou, Y.; Wang, J.; Chen, X.; Shao, Z.M.; Yin, X.M. Kinetics comparisons of mammalian Atg4
homologues indicate selective preferences toward diverse Atg8 substrates. J. Biol. Chem. 2011, 286, 7327–7338.
[CrossRef]
27. Betin, V.M.; Singleton, B.K.; Parsons, S.F.; Anstee, D.J.; Lane, J.D. Autophagy facilitates organelle clearance
during differentiation of human erythroblasts: Evidence for a role for ATG4 paralogs during autophagosome
maturation. Autophagy 2013, 9, 881–893. [CrossRef]
28. Allan, L.A.; Clarke, P.R. Apoptosis and autophagy: Regulation of caspase-9 by phosphorylation. FEBS J.
2009, 276, 6063–6073. [CrossRef]Genes 2020, 11, 861 11 of 11
29. Frankel, L.B.; Wen, J.; Lees, M.; Høyer-Hansen, M.; Farkas, T.; Krogh, A.; Lund, A.H. microRNA-101 is a
potent inhibitor of autophagy. EMBO J. 2011, 30, 4628–4641. [CrossRef]
30. Fu, Z.; Luo, W.; Wang, J.; Peng, T.; Sun, G.; Shi, J.; Zhang, B. Malat1 activates autophagy and promotes cell
proliferation by sponging miR-101 and upregulating STMN1, RAB5A and ATG4D expression in glioma.
Biochem. Bioph. Res. Commun. 2017, 492, 480–486. [CrossRef]
31. Baylin, A.; Kabagambe, E.K.; Siles, X.; Campos, H. Adipose tissue biomarkers of fatty acid intake. Am. J.
Clin. Nutr. 2002, 76, 750–757. [CrossRef]
32. Listenberger, L.L.; Han, X.; Lewis, S.E.; Cases, S.; Farese, R.V.; Ory, D.S.; Schaffer, J.E. Triglyceride accumulation
protects against fatty acid-induced lipotoxicity. Proc. Natl. Acad. Sci. USA 2003, 100, 3077–3082. [CrossRef]
33. Wu, L.X.; Wei, C.C.; Yang, S.B.; Zhao, T.; Luo, Z. Effects of fat and fatty acids on the formation of autolysosomes
in the livers from yellow catfish Pelteobagrus fulvidraco. Genes 2019, 10, 751. [CrossRef] [PubMed]
34. Kreeft, A.J.; Moen, C.J.; Porter, G.; Kasanmoentalib, S.; Sverdlov, R.; van Gorp, P.J.; Hofker, M.H. Genomic
analysis of the response of mouse models to high-fat feeding shows a major role of nuclear receptors in the
simultaneous regulation of lipid and inflammatory genes. Atherosclerosis 2005, 182, 249–257. [CrossRef]
[PubMed]
35. Yan, J.; Liao, K.; Wang, T.; Mai, K.; Xu, W.; Ai, Q. Dietary lipid levels influence lipid deposition in the
liver of large yellow croaker (Larimichthys crocea) by regulating lipoprotein receptors, fatty acid uptake and
triacylglycerol synthesis and catabolism at the transcriptional level. PLoS ONE 2015, 10, e129937. [CrossRef]
[PubMed]
36. Wu, C.H.; Lin, M.C.; Wang, H.C.; Yang, M.Y.; Jou, M.J.; Wang, C.J. Rutin inhibits oleic acid induced lipid
accumulation via reducing lipogenesis and oxidative stress in hepatocarcinoma cells. J. Food Sci. 2011, 76,
T65–T72. [CrossRef]
37. Ou, T.T.; Hsu, M.J.; Chan, K.C.; Huang, C.N.; Ho, H.H.; Wang, C.J. Mulberry extract inhibits oleic acid-induced
lipid accumulation via reduction of lipogenesis and promotion of hepatic lipid clearance. J. Sci. Food Agric.
2011, 91, 2740–2748. [CrossRef]
38. Mei, S.; Ni, H.M.; Manley, S.; Bockus, A.; Kassel, K.M.; Luyendyk, J.P.; Ding, W.X. Differential roles of
unsaturated and saturated fatty acids on autophagy and apoptosis in hepatocytes. J. Pharmacol. Exp. Ther.
2011, 339, 487–498. [CrossRef]
39. Nolan, C.J.; Larter, C.Z. Lipotoxicity: Why do saturated fatty acids cause and monounsaturates protect
against it? J. Gastroen. Hepatol. 2009, 24, 703–706. [CrossRef]
40. Ricchi, M.; Odoardi, M.R.; Carulli, L.; Anzivino, C.; Ballestri, S.; Pinetti, A.; Lonardo, A. Differential effect of
oleic and palmitic acid on lipid accumulation and apoptosis in cultured hepatocytes. J. Gastroenterol. Hepatol.
2009, 24, 830–840. [CrossRef]
41. Zámbó, V.; Simon-Szabó, L.; Szelényi, P.; Kereszturi, É.; Bánhegyi, G.; Csala, M. Lipotoxicity in the liver.
World J. Hepatol. 2013, 5, 550. [CrossRef]
© 2020 by the authors. Licensee MDPI, Basel, Switzerland. This article is an open access
article distributed under the terms and conditions of the Creative Commons Attribution
(CC BY) license (http://creativecommons.org/licenses/by/4.0/).You can also read