Consideration of the Door Opening Process in Pedestrian Flow: Experiments on Door Opening Direction, Door Handle Type, and Limited Visibility
←
→
Page content transcription
If your browser does not render page correctly, please read the page content below
sustainability

Article
Consideration of the Door Opening Process in
Pedestrian Flow: Experiments on Door Opening
Direction, Door Handle Type, and Limited Visibility
Jong-Yeong Son 1 , Young-Hoon Bae 1 , Young-Chan Kim 2 , Ryun-Seok Oh 3 , Won-Hwa Hong 1
and Jun-Ho Choi 3, *
 1    School of Architectural, Civil, Environmental and Energy Engineering, Kyungpook National University,
      Daegu 41566, Korea; ssonjy2239@gmail.com (J.-Y.S.); byh0105@gmail.com (Y.-H.B.);
      hongwonhwa@gmail.com (W.-H.H.)
 2    Department of Fire and Disaster Prevention Engineering, Changshin University, Changwon 51352, Korea;
      yyoungchani@gmail.com
 3    Department of Architectural and Fire Protection Engineering, Pukyong National University,
      Busan 48513, Korea; kaing367@gmail.com
 *    Correspondence: jchoi@pknu.ac.kr; Tel.: +82-(0)51-629-7830

 Received: 24 September 2020; Accepted: 10 October 2020; Published: 14 October 2020

 Abstract: The door is a section prone to bottlenecks and is an important element in the study of
 pedestrian flow. Therefore, characteristics of doors (e.g., width, location, and the distance between
 doors) have been taken into consideration in the existing literature related to doors. According to
 several previous studies, it appears likely that the door opening process (DOP) influences pedestrian
 flow. However, the number of studies examining the DOP remains small. Therefore, to enhance
 understanding of pedestrian flow, we examined two door characteristics that could affect the DOP
 (opening direction (swing door: push or pull) and handle type (knob, lever, and panic bar)) and
 limited visibility. We conducted a walking experiment to take all variables (10 cases; 10 participants
 per case) into account. Statistical analysis was performed on the difference in movement times,
 and the results were as follows: (1) inclusion of the DOP affected pedestrian flow; (2) when visibility
 was limited, movement times with DOP inclusion increased significantly regardless of the door
 opening direction and handle type; (3) when the door opening direction was ‘push’, regardless of
 limited visibility and door handle type, movement times with DOP inclusion were significantly lower;
 and (4) the door handle type did not result in any significant difference in movement times with
 DOP inclusion. In addition, we calculated the delay time based on the experiment results, to include
 the DOP in pedestrian flow (push 1.96–2.88 s, pull 3.91–4.43 s; limited visibility: push 7.38–12.56 s,
 and pull 12.88–16.35 s). The results of this study could be used as basic data for the development of
 codes/regulations, engineering guidance, and egress models for doors.

 Keywords: door opening process; movement time; opening direction; handle type; limited visibility

1. Introduction
       Understanding pedestrian flow during a fire in a building is a key problem and should be considered
in improving the accuracy of an evacuation model [1–4]. Studies related to pedestrian flow were
conducted in relation to building conditions (e.g., building use, size, number of floors, number of rooms,
size and number of doors, and presence or absence of escape stairs) [5–7], pedestrian characteristics
(e.g., number of pedestrians, age and gender distribution, interaction, physical characteristics, familiarity
with the building, and roles) [4,8,9], and evacuation environment (e.g., day/night, season, smoke,
heat, and presence of toxic gas) [10–14]. Among them, building conditions not only determine the

Sustainability 2020, 12, 8453; doi:10.3390/su12208453                      www.mdpi.com/journal/sustainability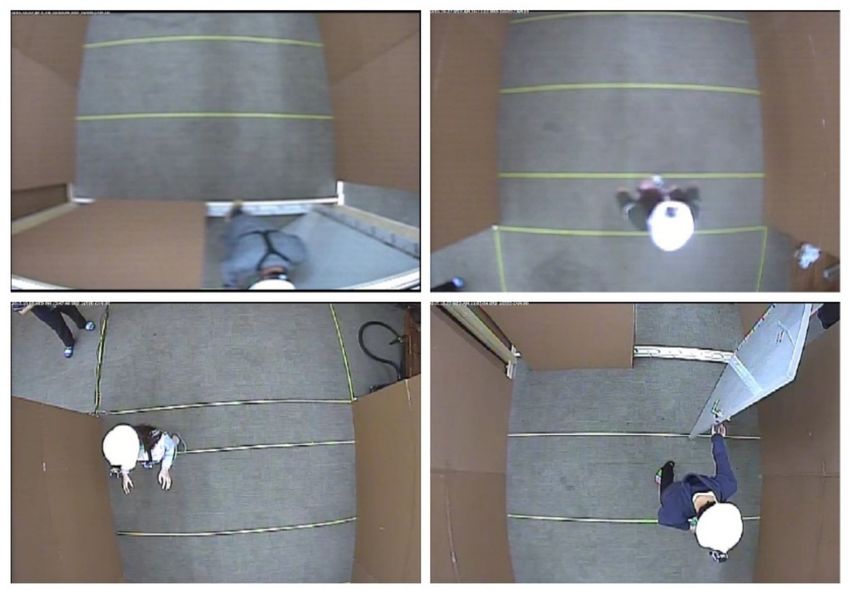
Sustainability 2020, 12, 8453                                                                        2 of 16

evacuation capacity of the building at the design stage but also affect pedestrian flow [15]. In addition,
building conditions are associated with the egress route that pedestrians take in evacuation and have
therefore been considered in many studies. These previous studies have examined the relationship
between pedestrian flow and building conditions, including building use (e.g., high-rise building
and underground) [16–18], stairs [5,19,20], corridors [21–24], and doors [25–29]. A door is one of the
important building conditions as it is an exit for pedestrian evacuation. In addition, as bottlenecks
are likely to occur, various studies related to doors have been carried out. Some studies have
shown that wider door width was associated with faster pedestrian walking speed [8,25]. However,
other studies have shown that when door width was increased to a certain level, walking speed no
longer increased [9,27]. Moreover, door location exerted an effect on pedestrian flow and was an
important factor in actual fire situations [28,30]. In addition, when multiple doors were present inside
a building, short distances between doors led to longer movement time [29].
     Therefore, the existing literature showed that a number of studies have been conducted on door
characteristics. The above studies were conducted on the premise that the door was open. However,
studies on some of the factors that can be included in the door opening process (DOP) support that DOP
can affect evacuation. For example, depending on dynamic width (width depending on the degree of
door opening), available exit width was smaller relative to the actual door width. In addition, the need
for greater force to open doors has been associated with greater interference with evacuation [31].
Considering that the majority of people keep doors closed in daily life [32], there is a high probability
that doors will be closed in an evacuation situation. In addition, the results of studies examining the
extended degree of the door leaf [21] and door type [33] support the claim that closed doors must be
taken into consideration in evacuation situations. In addition, depending on the handle type (between
knob and lever), the degree of recognition that people perceive varies significantly [34], and the force
required and usability vary [35]. In such situations, people generally evacuate by passing through the
door of the room, and there is a high probability that the final or emergency exit will be made through
a door. Therefore, the DOP is an important factor in understanding pedestrian flow through doors,
but no studies have examined door opening direction (e.g., push and pull) or handle type (e.g., knob,
lever, and panic bar).
     Therefore, the purpose of the study was to improve the understanding of pedestrian flow,
by analyzing the relationships between two DOP-related variables (opening direction and handle
type), on pedestrians’ movement time. In addition, an analysis was conducted on the condition of
limited visibility of pedestrians in consideration of the fire situation. In this study, an experimental set
was developed to analyze the relationship between the three variables, and a walking experiment was
conducted by separating the experimental cases. In addition, the difference in movement time by the
experiment case was analyzed statistically. Finally, the delay time due to the DOP was presented.

2. Method and Procedure
     The concept shown in Figure 1 was used to analyze the effects of the DOP. The process of a
pedestrian passing through a door is as follows: (1) walking before the door passage (Figure 1a);
(2) walking from the time the pedestrian holds the door handle to the time he/she opens and exits
the door (Figure 1b); and (3) walking after the door passage (Figure 1c). Figure 1b shows the DOP.
When doors are open, pedestrians can skip the process in Figure 1b during evacuation. When doors
are closed, evacuation could be delayed or walking speed reduced by the process shown in Figure 1b.
Sustainability 2020, 12, 8453 3 of 16
Figure 1. Concept of the door opening process: (a) walking before the door passage; (b) walking from
the time the pedestrian holds the door handle to the time he/she opens and exits the door (DOP);
(c) walking after the door passage.
2.1. Experimental Setup
In this study, experiment cases were set up with three variables to achieve the purpose of the study.
The experiment was planned as one-person walking, excluding the influence of other pedestrians,
to specifically observe the results of the conditions of the variables. All of the experiments were
video-recorded, and the movement time was measured accordingly. The experimental process is
shown in Figure 2.
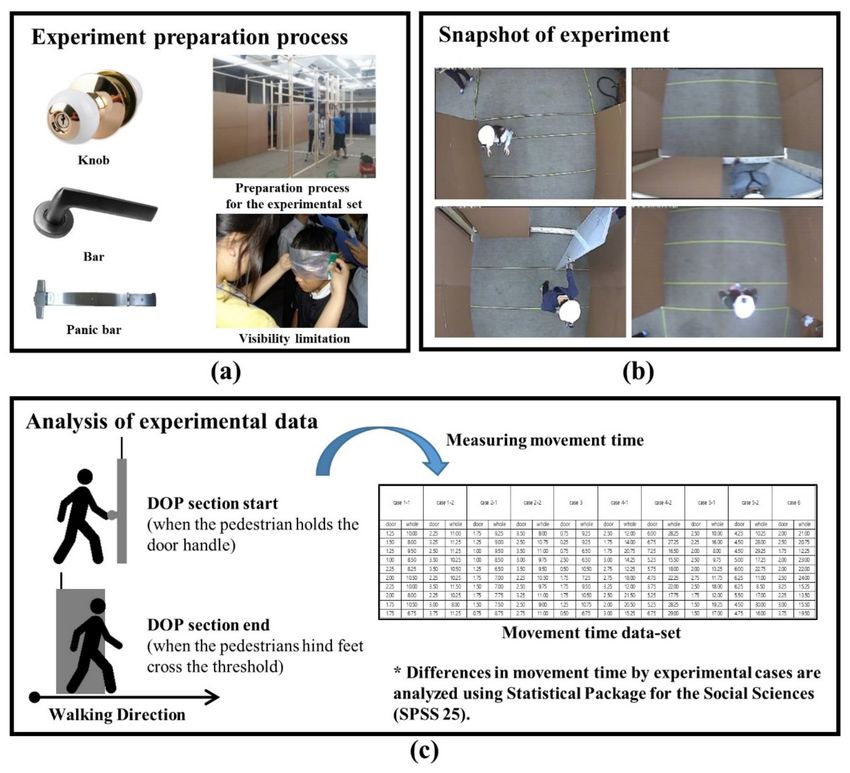
Figure 2. Experimental process: (a) handle types (knob, lever, and panic bar), eyepatch, and preparation
process for the experimental set; (b) analysis of effects of the door opening process using closed-circuit
televisions; (c) analysis of experimental data.Sustainability 2020, 12, 8453 4 of 16
The experiment was conducted to analyze movement time, with the door opening direction,
door handle type as independent variables. Door handles were divided into three types, as shown
in Figure 2a: (1) knob (typical handle), (2) lever (typical handle), and (3) panic bar (handle used for
emergency exit). The doors were swing doors, and opening directions were divided into two types:
(1) push and (2) pull. As mentioned in the introduction, in addition to building conditions, various
factors influence the pedestrian flow. Moreover, the DOP is influenced by correlations with other
factors that affect pedestrian flow [36–38]. Among them, limited visibility was chosen because it could
reduce pedestrians’ walking speed and impedes evacuation [10–13,38]. Limited visibility caused by
smoke was simulated using non-transparent eyepatches (extinction coefficient 1.0, visible distance
1–2 m), which have been used in various experiments [11,39]. Although an eyepatch is different from
actual smoke, it was chosen because it was safe and participants could have similar experiences.
The cases were constructed by considering all factors of opening direction, handle type, and limited
visibility. However, only one opening direction was considered for the panic bar, because it could only
be pushed open. Therefore, the study included 10 cases to account for all variables, and a detailed
description is provided in Table 1. Cases 1-1 to 3 were normal conditions and Cases 4-1 to 6 were
limited visibility conditions.
Table 1. Experimental cases.
Case No. Visibility Handle Type Opening Direction
Case 1-1 Normal Knob Push
Case 1-2 Normal Knob Pull
Case 2-1 Normal Lever Push
Case 2-2 Normal Lever Pull
Case 3 Normal Panic Bar Push
Case 4-1 Limited Knob Push
Case 4-2 Limited Knob Pull
Case 5-1 Limited Lever Push
Case 5-2 Limited Lever Pull
Case 6 Limited Panic Bar Push
Experiments were conducted in a custom-developed experimental set, to control for variables
excluded from Table 1. The experimental set was constructed with wooden beams and column, and the
walls were constructed using thick paper to create a corridor with a door. The size and shape of the
experimental set are shown in Figure 3. The entire area was 7.2 m × 3.6 m in size, and the width of the
door installed was 0.9 m (minimum door width for Korea Standard; Ministry of Land, Infrastructure
and Transport). In addition, the starting and arrival points were marked 3 m from the experimental set,
to allow pedestrians to enter the corridor at normal walking speed.
Figure 3. Size of the experimental set. After departing from the starting point, participants performed
the door opening process and walked to the arrival point.Sustainability 2020, 12, 8453 5 of 16
The participants were recruited via an advertisement at a university in Korea, a website, and social
network services. The participants aged between 20 and 40 years, and the total number of participants
was 100 (43 males, 57 females). All participants were college students or faculty members without
physical disabilities and did not have problems with walking. All procedures of our experiment were
approved by the Institutional Review Board (IRB) of the university. The experiments were conducted
according to the following procedure.
(1) Participants who agreed to participate in the experiment recorded personal information and were
photographed for identification.
(2) With the door open, participants’ normal walking speed was measured and recorded. Participants
measured their speed individually. In addition, participants walked from the starting point to the
arrival point, and the speed was calculated on the basis of the distance moved in the experimental
set (7.2 m; mean normal walking speed: 1.21 m/s, SD = 0.22 m/s). Participants’ movement time
was measured from the time the front foot entered the measurement area to the moment the back
foot exited the measurement area.
(3) Each participant departed from the starting point, passed through the door, and walked to the
arrival point, as shown in Figure 3. Staff members were stationed to ensure participant safety in
cases in which non-transparent eyepatches were used (Cases 4-1 to 6).
(4) Experiments were conducted for 1 participant at a time, and each case included 10 participants.
2.2. Data Analysis
To analyze changes in participants’ movement times resulting from the DOP, 6 closed-circuit
televisions (CCTVs) were installed (at the starting point, arrival point, on both sides of the door,
and between each point and the door) to record participants’ behavior, as shown in Figure 4. The CCTVs
were secured to the cross beams in the experimental set, and the camera angle was set vertically to
capture images of the area directly below. In addition, lines were marked 1 m apart on the floor,
because the exact locations of the participants were difficult to determine in the video recordings
because of the height and curvature of the lens (yellow line in Figure 5). The video recordings were
analyzed at 0.25 s intervals, and the CCTV images are shown in Figure 5.
Figure 4. Movement time measurement in the whole and door opening process sections.Sustainability 2020, 12, 8453 6 of 16
Figure 5. Closed-circuit television images. Lines were marked 1 m apart on the floor to analyze
video recordings.
In addition, participants’ movement times were measured for the whole section and DOP section,
as shown in Figure 4. The measuring section for the movement time in the whole section was defined
as the points at which the participants entered and exited the experimental set (i.e., it was not measured
from the starting point to the arrival point). In addition, the measuring section for the movement
time in the DOP section was defined as the points at which the participants held the door handle and
opened and exited through the door.
To determine whether participants’ movement times changed depending on the inclusion of the
DOP, the movement time for each case was compared with the movement time measured at normal
walking speed (with the door open). We performed a statistical analysis to determine whether inclusion
of the DOP exerted a significant effect on movement time. We determined statistical significance using
a non-parametric statistical method (Mann–Whitney U and Kruskal–Wallis tests), as the groups did
not satisfy normality. The statistical tests were performed at a significance level of 0.05. However,
four hypotheses (movement time difference (a) with and without the DOP, (b) with and without limited
visibility, (c) between two opening directions, and (d) among three handle types) were tested in this
study. Therefore, individual statistical tests were tested at a significance probability of 0.01 to control
familywise type I errors below 5% (Bonferroni correction, 0.05/4).
The analysis was conducted in the following order: (1) it was analyzed whether the increase in
movement time with DOP inclusion is significant compared to the movement time when it is not;
(2) differences in movement time depending on the visibility condition (with or without non-transparent
eyepatches) were analyzed with the same door opening direction and handle type (e.g., Case 1-1 and
4-1); (3) difference in movement time of participants according to the opening direction was analyzed
(e.g., Case 1-1 and Case 1-2); and (4) difference in movement time of participants according to handle
type was analyzed (e.g., Case 1-1, Case 2-1, Case 3). Then, the above differences were analyzed using
the movement time of the DOP section. This is because eyepatches can affect the walking speed of
participants in sections other than the DOP section.
3. Results
3.1. Movement Times and Walking Speeds According to the Experimental Case
Participants’ movement times and walking speeds while passing through the DOP and whole
sections for each case are shown in Table 2 and Figure 6. For this purpose, the average movement time
and walking speed in the whole section were analyzed to compare the normal walking speed of theSustainability 2020, 12, 8453 7 of 16
participants. The average movement time in the DOP section was analyzed to find the duration the
participants spent on the DOP.
Table 2. Results according to the case.
Average Average Movement Average Walking Percentage of Increase
Case No. Movement Time Time in Whole Speed in Whole in Movement Time
in DOP Section (s) Section (s) Section (m/s) with and without DOP
Case 1-1 1.70 9.00 0.80 47.1%
Case 1-2 2.97 10.55 0.68 72.4%
Case 2-1 1.35 8.08 0.89 32.0%
Case 2-2 2.92 10.03 0.72 63.9%
Case 3 1.18 8.68 0.83 41.8%
Case 4-1 2.53 16.05 0.45 162.3%
Case 4-2 5.68 22.47 0.32 267.2%
Case 5-1 2.13 13.50 0.53 120.6%
Case 5-2 5.15 19.00 0.38 210.5%
Case 6 2.50 18.68 0.39 205.1%
Average movement time at normal walking speed = 6.12 s; DOP = door opening process.
Figure 6. Movement time distribution by case. DOP (door opening process) refers to ‘movement time
for DOP section’, and Whole refers to ‘movement time for whole section’.
Overall, the participants’ mean walking speed was slower relative to their mean normal walking
speed (1.21 m/s), which was measured with the door open, in each case. In addition, participants’
walking speeds differed according to the door opening direction (Cases 1-1 and 1-2/Cases 2-1 and
2-2/Cases 4-1 and 4-2/Cases 5-1 and 5-2) and handle type (Cases 1-1, 2-1, and 3/Cases 4-1, 5-1, and 6).
Moreover, walking speeds for cases involving limited visibility conditions, in which participants
wore non-transparent eyepatches (Cases 4-1 to 6), were significantly slower relative to those for cases
involving normal conditions (Cases 1-1 to 3). These differences were observed in the movement times
of both the DOP section and whole section without the DOP section (e.g., Case 1-1 (7.30 s = 9.00 s
− 1.70 s) < Case 4-1 (13.52 s = 16.05 s − 2.53 s). However, differences in movement times in cases
involving limited visibility conditions were greater relative to those observed for cases involving
normal conditions (Figure 6).Sustainability 2020, 12, 8453 8 of 16
3.2. Analysis of Differences in Movement Times between Cases with and without the DOP
The results showed that movement times for all cases with the DOP were significantly longer
(increases ranged from 32.0% to 267.2%) relative to those for cases without the DOP (Table 2). The results
of the statistical analysis performed to determine whether DOP inclusion exerted a significant effect on
movement times are shown in Table 3. In addition, movement times for the whole section without the
DOP increased in the cases involving limited visibility conditions (Cases 4-1 to 6) and were therefore
excluded. For the remaining cases, the results showed significant differences in movement times
between cases with and without DOP (Case 1-1: p < 0.001; Case 1-2: p < 0.001; Case 2-1: p < 0.001;
Case 2-2: p < 0.001; Case 3: p < 0.001).
Table 3. Mann–Whitney U test results for movement times with and without DOP (* p < 0.01).
The statistical analysis was performed on the difference between the normal walking speed and average
movement time of each experimental case.
Average Movement Mann–Whitney p-Value
Case No N Range Min. Max. SD
Time (s) U (N = 110)
Normal walking 100 4.00 4.00 8.00 6.12 0.10 - -
Case 1-1 10 3.75 6.75 10.50 9.00 1.27 30.00 0.000 *
Case 1-2 10 3.50 8.00 11.50 10.55 1.02 7.50 0.000 *
Case 2-1 10 3.00 6.50 9.50 8.08 1.06 75.00 0.000 *
Case 2-2 10 3.00 8.00 11.00 10.03 1.01 7.50 0.000 *
Case 3 10 4.25 6.50 10.75 8.68 1.75 6.00 0.000 *
Abbreviations: DOP = door opening process; Min. = minimum; Max. = maximum; SD = standard deviation.
3.3. Analysis of Differences in Movement Times According to the Presence or Absence of Limited Visibility
As shown in Table 3, participants’ movement times in the cases involving limited visibility
conditions (Cases 4-1 to 6) were significantly longer relative to those in cases involving normal
conditions (Cases 1-1 to 3). The results of the analysis of movement times with DOP inclusion according
to the presence or absence of limited visibility (with or without non-transparent eyepatches) showed
significant differences in movement times between cases involving normal and limited visibility
conditions (knob, push, p = 0.005; knob, pull, p < 0.001; lever, push, p = 0.002; lever, pull, p < 0.001;
and panic bar, push, p < 0.001; Table 4). This indicated that the presence or absence of limited visibility
exerted an effect on movement times with DOP inclusion.
3.4. Analysis of Differences in Movement Times According to the Door Opening Direction
The results of the analysis of handle types between cases involving normal (Cases 1-1 to 2-2) and
limited visibility (Cases 4-1 to 5-2) conditions showed that for the knob-type handle (Cases 1-1 and
1-2), movement times were fastest when the door opening direction was push (1.70 s), and for the
lever-handle (Cases 2-1 and 2-2), movement times were fastest when door opening direction was push
(1.35 s). There were significant differences in movement times according to the door opening direction
(knob: p < 0.001; lever: p < 0.001; Table 5). These results indicated that movement times were shortest
when the push door opening direction was used, regardless of the type of door handle.Sustainability 2020, 12, 8453 9 of 16
Table 4. Results of Mann–Whitney U tests examining movement times in the DOP section with and
without limited visibility (* p < 0.01).
Average Movement Mann–Whitney p-Value
Visibility N Range Min. Max. SD
Time (s) U (N = 20)
Case 1-1
10 1.25 1.00 2.25 1.70 0.44
(Normal) 87.00 0.005 *
Case 4-1
10 1.50 1.75 3.25 2.53 0.53
(Limited)
Case 1-2
10 1.50 2.25 3.75 2.98 0.61
(Normal) 99.50 0.000 *
Case 4-2
10 3.50 3.75 7.25 5.68 1.05
(Limited)
Case 2-1
10 1.00 0.75 1.75 1.35 0.36
(Normal) 90.50 0.002 *
Case 5-1
10 1.25 1.50 2.75 2.1250 0.44
(Limited)
Case 2-2
10 1.25 2.25 3.50 2.93 0.49
(Normal) 100.00 0.000 *
Case 5-2
10 2.00 4.25 6.25 5.15 0.78
(Limited)
Case 3
10 2.25 0.25 2.50 1.18 0.74
(Normal) 92.50 0.000 *
Case 6
10 2.00 1.75 3.75 2.50 0.65
(Limited)
Abbreviations: DOP = door opening process; Min. = minimum; Max. = maximum; SD = standard deviation.
Table 5. Results of Mann–Whitney U tests examining opening direction in cases involving normal
conditions (* p < 0.01).
Opening Average Movement Mann–Whitney p-Value
N Range Min. Max. SD
Direction Time (s) U (N = 20)
Case 1-1
10 1.25 1.00 2.25 1.70 0.44
(Push, Knob) 3.00 0.000 *
Case 1-2
10 1.50 2.25 3.75 2.98 0.61
(Pull, Knob)
Case 2-1
10 1.00 0.75 1.75 1.35 0.36
(Push, Lever) 0.00 0.000 *
Case 2-2
10 1.25 2.25 3.50 2.93 0.49
(Pull, Lever)
Abbreviations: Min. = minimum; Max. = maximum; SD = standard deviation.
The results of the analysis of cases involving limited visibility conditions showed that for the
knob-type handle (Cases 4-1 and 4-2), movement times were fastest when the door opening direction
was push (2.53 s), and for the lever-type handle (Cases 5-1 and 5-2), movement times were fastest
when the door opening direction was push (2.13 s). There were significant differences in movement
times according to the door opening direction (knob: p < 0.001; lever: p < 0.001; Table 6). These results
indicated that movement times were shortest when the push door opening direction was used,
regardless of the handle type, in cases involving limited visibility conditions. Therefore, movement
times were shortest when the push door opening direction was used in cases involving both normal
and limited visibility conditions.Sustainability 2020, 12, 8453 10 of 16
Table 6. Results of Mann–Whitney U tests examining opening direction in cases involving limited
visibility conditions (* p < 0.01).
Opening Average Movement Mann–Whitney p-Value
N Range Min. Max. SD
Direction Time (s) U (N = 20)
Case 4-1
10 1.50 1.75 3.25 2.53 0.53
(Push, Knob) 0.00 0.000 *
Case 4-2
10 3.50 3.75 7.25 5.68 1.05
(Pull, Knob)
Case 4-1
10 1.25 1.50 2.75 2.13 0.44
(Push, Lever) 0.00 0.000 *
Case 4-2
10 2.00 4.25 6.25 5.15 0.78
(Pull, Lever)
Abbreviations: Min. = minimum; Max. = maximum; SD = standard deviation.
3.5. Analysis of Differences in Movement Times According to the Handle Type
Since limited visibility and door opening direction resulted in significant differences in evaluation
times, all cases were analyzed for both variables. Therefore, the cases were split into normal
condition-push cases (Case 1-1, 2-1, and 3), limited visibility condition-push cases (Cases 4-1, 5-1,
and 6), normal condition-pull cases (Cases 1-2 and 2-2), and limited visibility condition-pull cases
(Cases 4-2 and 5-2) in the analysis.
Movement times for the normal condition-push cases were shortest for the panic bar-type handle
(1.18 s) and longest for the knob-type handle (1.70 s). No significant differences in movement times
were observed between door handle types (p = 0.108; Table 7). This result indicated that the door
handle type did not exert an effect on movement times with DOP inclusion when the push door
opening direction was used in cases involving normal conditions.
Table 7. Results of Kruskal–Wallis tests examining differences in movement times according to handle
type (normal condition, push).
Average Movement Mean p-Value
Handle Type N Range Min Max SD Chi-Square
Time (s) Rank (N = 30)
Case 1-1
10 1.25 1.00 2.25 1.70 0.44 20.10
(Knob, Push)
4.446 0.108
Case 2-1
10 1.00 0.75 1.75 1.35 0.36 14.15
(Lever, Push)
Case 3
10 2.25 0.25 2.50 1.18 0.74 12.25
(Panic Bar, Push)
Abbreviations: Min. = minimum; Max. = maximum; SD = standard deviation.
Movement times for the limited visibility condition-push cases were shortest for the panic bar-type
handle (2.13 s) and longest for the knob-type handle (2.52 s). No significant difference in movement
times was observed between door handle types (p = 0.224; Table 8). This result indicated that door
handle type did not exert an effect on movement times with DOP inclusion when the push door
opening direction was used in cases involving limited visibility conditions.
Movement times for the normal condition-pull cases (Cases 1-2 and 2-2) were shortest for the
lever-type handle (2.93 s). No significant difference in movement times was observed between door
handle types (p = 0.908; Table 9). This result indicated that the door handle type did not exert an
effect on movement times with DOP inclusion when the pull door opening direction was used in cases
involving normal conditions.Sustainability 2020, 12, 8453 11 of 16
Table 8. Results of Kruskal–Wallis tests examining differences in movement times according to handle
type (limited visibility condition, push).
Average Movement Mean p-Value
Handle Type N Range Min Max SD Chi-Square
Time (s) Rank (N = 30)
Case 4-1
10 1.50 1.75 3.25 2.53 0.53 18.10
(Knob, Push)
2.996 0.224
Case 5-1
10 1.25 1.50 2.75 2.13 0.44 11.70
(Lever, Push)
Case 6
10 2.00 1.75 3.75 2.50 0.65 16.70
(Panic Bar, Push)
Abbreviations: Min. = minimum; Max = maximum; SD = standard deviation.
Table 9. Results of Mann–Whitney U tests examining differences in movement times according to the
handle type (normal condition, pull).
Handle Average Movement Mann–Whitney p-Value
N Range Min. Max. SD
Type Time (s) U (N = 20)
Case 1-2
10 1.50 2.25 3.75 2.98 0.61
(Knob, Pull) 48.50 0.908
Case 2-2
10 1.25 2.25 3.50 2.93 0.49
(Lever, Pull)
Abbreviations: Min. = minimum; Max = maximum; SD = standard deviation.
Movement times for limited visibility condition-pull cases (Cases 4-2 and 5-2) were shortest for
the lever-type handle (5.15 s). No significant difference in movement times was observed between
door handle types (p = 0.197; Table 10). This result indicated that door handle type did not exert an
effect on movement times with DOP inclusion when the pull door opening direction was used in cases
involving limited visibility conditions.
Table 10. Results of Mann–Whitney U tests examining movement times according to handle type
(limited visibility condition, pull).
Handle Average Movement Mann–Whitney p-Value
N Range Min. Max. SD
Type Time (s) U (N = 20)
Case 4-2
10 3.50 3.75 7.25 5.68 1.05
(Knob, Pull) 33.00 0.197
Case 5-2
10 2.00 4.25 6.25 5.15 0.78
(Lever, Pull)
Abbreviations: Min = minimum; Max = maximum; SD = standard deviation.
The results of the analysis of handle type showed that handle type did not exert a significant
effect on movement times with DOP inclusion in any cases (normal condition-push, limited visibility
condition-push, normal condition-pull, and limited visibility condition-pull).
4. Discussion
This study examined the effects of the DOP on pedestrian flow. The purpose was to investigate
the relationships between three variables (opening direction, handle type, and limited visibility) and
participants’ walking speed. The results suggested that the effects of the DOP on the evacuation
process should be considered when calculating movement time. The findings could have implications
for the development of codes/regulations, engineering guidance, and egress models related to doors.
In addition, future research examining correlations between the DOP and other factors that could
influence pedestrian flow through doors could help to clarify current understanding of this flow.
In all cases with the DOP, movement times were longer relative to those observed for cases
without the DOP. The results showed significant differences between cases with and without the
DOP (Case 1-1: p < 0.001; Case 1-2: p < 0.001; Case 2-1: p < 0.001; Case 2-2: p < 0.001; and Case 3:Sustainability 2020, 12, 8453 12 of 16
p < 0.001). When a large number of pedestrians pass through a door, the movement time may vary
with changes in door width [8,25] or crowd density [40–43]. However, this experiment considered
one-person walking, and the door width was fixed at 0.9 m. Therefore, the DOP exerted a significant
effect on pedestrian flow.
Limited visibility significantly increased movement times for all cases. Table 2 shows that the
movement time for the whole section increased. In other words, walking speed decreased (knob/push:
0.80–0.45 m/s; knob/pull: 0.68–0.32 m/s; lever/push: 0.89–0.53 m/s; lever/pull: 0.72–0.38 m/s; and panic
bar/push: 0.83–0.39 m/s). In addition, movement times for the DOP section increased. This could be
attributed to two factors. First, participants would not have known the location of the door because
of the use of non-transparent eyepatches. Smoke is a major factor resulting in delays in pedestrian
flow [10–13,38], which is supported by research results indicating that pedestrian flow through doors
was impeded by smoke even when doors were open [12]. Second, participants could have experienced
difficulty in operating the door handles because of the use of non-transparent eyepatches. Participants
wearing non-transparent eyepatches did not knowing which handle type was installed, which was
evident in the longer movement times recorded for participants wearing non-transparent eyepatches
(panic bar/limited visibility: 2.50 s), relative to those observed for participants who were not wearing
non-transparent eyepatches (panic bar: 1.18 s). In this study, there were limitations to using eyepatches
in place of actual smoke. However, an eyepatch can fully reproduce pedestrians’ visibility depending
on the concentration of smoke [11]. Additionally, the use of only one characteristic eyepatch (extinction
coefficient 1.0, visible distance 1–2 m) was intended to prevent participants from recognizing the door
opening direction and handle type before arriving at the door. Therefore, the eyepatches used in this
experiment sufficiently simulated the limited visibility situation.
With respect to the door opening direction, movement times were fastest when the push door
opening direction was used. As with door handle type, all cases were considered when comparing
movement times, to control for the effects of other variables, and the push opening direction showed
significantly shorter movement times relative to those for the pull opening direction. Based on
experience, it is optimal for doors to open in the direction of an evacuation. This idea is supported by
building and fire safety codes in various countries (e.g., NFPA101; National Fire Protection Association).
However, considering exceptions based on installation standards and fire situations, it is necessary
to consider cases involving the pull opening direction, as individuals could pass through various
pull-direction doors depending on the building and fire situation. Therefore, analysis of pull-direction
doors is necessary for the inclusion of this type of door in an evacuation model.
In contrast to our expectations, no significant difference in movement times was observed
between handle types. To control for the effects of door opening direction and limited visibility,
differences between handle types were compared with various combinations of these two factors,
but no significant differences were observed. It is noteworthy that movement times were fastest
for the panic bar handle in situations without limited visibility (panic bar: 1.18 s and lever: 1.35 s),
whereas movement times were fastest for the lever handle in situations involving limited visibility
(lever: 2.13 s, panic bar: 2.50 s; and opening direction: push). There are two possible explanations
for this result. First, participants did not know the location of the door because they were wearing
non-transparent eyepatches. This explanation is supported by previous studies indicating that smoke
made it difficult to perceive one’s route [10–13,38]. Second, participants were unaware of the handle
type because they were wearing non-transparent eyepatches and were unable to perceive the panic bar,
which is not commonly used in Korea (although panic bars are installed and used in specific buildings,
such as hospitals, their use is limited in general buildings in Korea). Therefore, participants were
unable to perceive the panic bar when their visual fields were impaired, because they were unfamiliar
with this type of handle. However, this is the authors’ opinion and should be examined further in
future research.Sustainability 2020, 12, 8453 13 of 16
Based on the current results, we aimed to present the difference in movement times between cases
with and without the DOP as delay time. The delay time was defined as the DOP delay time and was
calculated as follows.
T = t − t0 , (1)
T indicates the delay time for the DOP, t indicates the movement time for the whole section for
each case (Table 2), and t0 indicates the movement time for the whole section when the door was open
(see Table 2). The results calculated using Equation (1) are shown in Table 11. However, the delay
time in cases involving limited visibility conditions (Cases 4-1 to 6) could change depending on the
concentration of smoke or fire. In addition, this was a simulation experiment; therefore, application of
the data from Table 11 should be performed with caution depending on the population and region
(participants were aged between 20 and 40 years and had no physical abnormality).
Table 11. Delay time for DOP.
Category Handle Type Opening Direction Visibility DOP Delay Time (s)
Case 1-1 Knob Push Normal 2.88
Case 1-2 Knob Pull Normal 4.43
Case 2-1 Lever Push Normal 1.96
Case 2-2 Lever Pull Normal 3.91
Case 3 Panic bar Push Normal 2.56
Case 4-1 Knob Push Limited 9.93
Case 4-2 Knob Pull Limited 16.35
Case 5-1 Lever Push Limited 7.38
Case 5-2 Lever Pull Limited 12.88
Case 6 Panic bar Push Limited 12.56
Abbreviations: DOP = door opening process.
One factor that should be considered in future research is the effect of the DOP on movement
times with multiple pedestrians. When multiple pedestrians are passing through a door, which is
affected by door width and pedestrian speed and density [40–43]. The flow rate (product of walking
speed and crowd density) for pedestrians can be used in engineering calculations and evacuation
models. However, the results observed in real situations and simulation experiments show values
below the maximum planned flow rate [44]. This could be attributed to familiarity between pedestrians
when exiting the door [45], competition between pedestrians (or selfish behavior) [3,9,46], and the
degree to which the door is open [21,26]. For example, flow rate increases as competition increases,
but if this exceeds a certain level, evacuation efficiency decreases [3]. In addition, depending on
pedestrian density, the location of following pedestrians could change, and the door might not close
completely, which could impede evacuation [21,26]. Therefore, to develop an accurate evacuation
model, other factors excluded from the flow rate equation (product of walking speed and crowd
density) for pedestrians should also be considered. Examination of the effects of the DOP on movement
times with multiple pedestrians would contribute greatly to the development of an accurate evacuation
model. Moreover, the comparison of results obtained with the DOP and existing research results
related to flow rates would be a useful topic for future research.
5. Conclusions
In the current study, we analyzed changes in pedestrians’ movement times according to two door
characteristics (opening direction and handle type) and limited visibility, to enhance understanding of
pedestrian flow in cases with the DOP. To date, a number of studies have involved door passage to
understand pedestrian flow, but few have considered the DOP. However, in general, people evacuate
by passing through the door of the room in evacuation situations, and there is a strong probability that
the final or emergency exit will be a door. Taking these facts into consideration, we determined thatSustainability 2020, 12, 8453 14 of 16
there is sufficient need to take the DOP into account. The following conclusions were drawn from
the study.
(1) There was a statistically significant difference between movement times with and without the
DOP. Based on this finding, it is appropriate to include the DOP in the calculation of pedestrians’
movement times.
(2) When visibility was limited, movement times with DOP inclusion increased significantly
regardless of the door opening direction and handle type.
(3) When the door opening direction was ‘push’, regardless of limited visibility and door handle
type, movement times with DOP inclusion were significantly lower.
(4) The handle type did not show a significant difference in movement times with DOP inclusion.
(5) Based on the experimental results, the DOP delay time was calculated as follows: push 1.96–2.88
s and pull 3.91–4.43 s/(visibility is limited) push 7.38–12.56 s and pull 12.88–16.35 s.
DOP delay time could be applied to an evacuation model for the calculation of movement times
for pedestrians passing through a door. However, the current results lack representativeness and are
limited in that only a few factors were considered. Nonetheless, this was a basic study on the DOP,
which has not been considered in evacuation models previously. The results of the current study could
be useful for improving the accuracy of evacuation models designed to assess building safety.
Author Contributions: Conceptualization, J.-Y.S.; Methodology, Y.-C.K.; Data curation, Y.-H.B.; Validation J.-Y.S.
and Y.-H.B.; Formal analysis, Y.-H.B.; Investigation, R.-S.O.; Resources, W.-H.H. and J.-H.C.; Writing–original
draft, J.-Y.S.; Writing—review and editing, Y.-C.K., R.-S.O., Y.-H.B., W.-H.H. and J.-H.C.; Visualization, J.-Y.S.;
Software J.-Y.S.; Supervision, W.-H.H. and J.-H.C.; Project administration, J.-H.C.; Funding acquisition, J.-H.C..
All authors have read and agreed to the published version of the manuscript.
Funding: This work was supported by the National Research Foundation of Korea (NRF) grant (No. NRF-
2018R1A2B3005951), which was funded by the Korean government (MSIT).
Conflicts of Interest: The authors declare no conflict of interest.
References
1. Gwynne, S.; Galea, E.R.; Owen, M.; Lawrence, P.J.; Filippidis, L. A review of the methodologies used in the
computer simulation of evacuation from the built environment. Build. Environ. 1999, 34, 741–749. [CrossRef]
2. Helbing, D.; Johansson, A. Pedestrian, Crowd, and Evacuation Dynamics. Encycl. Complex. Syst. Sci. 2013,
16, 6476–6495. [CrossRef]
3. Nicolas, A.; Bouzat, S.; Kuperman, M.N. Pedestrian flows through a narrow doorway: Effect of individual
behaviours on the global flow and microscopic dynamics. Transp. Res. Part B Methodol. 2017, 99, 30–43.
[CrossRef]
4. Yanagisawa, D.; Kimura, A.; Tomoeda, A.; Nishi, R.; Suma, Y.; Ohtsuka, K.; Nishinari, K. Introduction of
frictional and turning function for pedestrian outflow with an obstacle. Phys. Rev. E Stat. Nonlinear Soft
Matter Phys. 2009, 80, 36110. [CrossRef] [PubMed]
5. Huo, F.; Song, W.; Chen, L.; Liu, C.; Liew, K.M. Experimental study on characteristics of pedestrian evacuation
on stairs in a high-rise building. Saf. Sci. 2016, 86, 165–173. [CrossRef]
6. Lovreglio, R.; Ronchi, E.; Nilsson, D. A model of the decision-making process during pre-evacuation.
Fire Saf. J. 2015, 78, 168–179. [CrossRef]
7. Wang, S.; Yue, H.; Zhang, B.; Li, J. Setting the Width of Emergency Exit in Pedestrian Walking Facilities.
Procedia Soc. Behav. Sci. 2014, 138, 233–240. [CrossRef]
8. Tian, W.; Song, W.; Ma, J.; Fang, Z.; Seyfried, A.; Liddle, J. Experimental study of pedestrian behaviors in a
corridor based on digital image processing. Fire Saf. J. 2012, 47, 8–15. [CrossRef]
9. Song, X.; Ma, L.; Ma, Y.; Yang, C.; Ji, H. Selfishness- and Selflessness-based models of pedestrian room
evacuation. Phys. A Stat. Mech. Appl. 2016, 447, 455–466. [CrossRef]
10. Isobe, M.; Helbing, D.; Nagatani, T. Experiment, theory, and simulation of the evacuation of a room without
visibility. Phys. Rev. E Stat. Nonlinear Soft Matter Phys. 2004, 69, 1–10. [CrossRef]Sustainability 2020, 12, 8453 15 of 16
11. Jeon, G.Y.; Hong, W.H. An experimental study on how phosphorescent guidance equipment influences on
evacuation in impaired visibility. J. Loss Prev. Process. Ind. 2009, 22, 934–942. [CrossRef]
12. Kobes, M.; Helsloot, I.; de Vries, B.; Post, J.G.; Oberijé, N.; Groenewegen, K. Way finding during fire
evacuation; an analysis of unannounced fire drills in a hotel at night. Build. Environ. 2010, 45, 537–548.
[CrossRef]
13. Fridolf, K.; Andrée, K.; Nilsson, D.; Frantzich, H. The impact of smoke on walking speed. Fire Mater. 2014,
38, 744–759. [CrossRef]
14. Zhang, G.; Zhu, G.; Yuan, G.; Wang, Y. Quantitative risk assessment methods of evacuation safety for collapse
of large steel structure gymnasium caused by localized fire. Saf. Sci. 2016, 87, 234–242. [CrossRef]
15. Helbing, D.; Buzna, L.; Johansson, A.; Werner, T. Self-organized pedestrian crowd dynamics: Experiments,
simulations, and design solutions. Transp. Sci. 2005, 39, 1–24. [CrossRef]
16. Pauls, J. Calculating evacuation times for tall buildings. Fire Saf. J. 1987, 12, 213–236. [CrossRef]
17. Aleksandrov, M.; Cheng, C.; Rajabifard, A.; Kalantari, M. Modelling and finding optimal evacuation strategy
for tall buildings. Saf. Sci. 2019, 115, 247–255. [CrossRef]
18. Ronchi, E.; Arias, S.; La Mendola, S.; Johansson, N. A fire safety assessment approach for evacuation analysis
in underground physics research facilities. Fire Saf. J. 2019, 108, 102839. [CrossRef]
19. Qu, Y.; Gao, Z.; Xiao, Y.; Li, X. Modeling the pedestrian’s movement and simulating evacuation dynamics on
stairs. Saf. Sci. 2014, 70, 189–201. [CrossRef]
20. Sano, T.; Ronchi, E.; Minegishi, Y.; Nilsson, D. A pedestrian merging flow model for stair evacuation.
Fire Saf. J. 2017, 89, 77–89. [CrossRef]
21. Gwynne, S.M.V.; Kuligowski, E.D.; Kratchman, J.; Milke, J.A. Questioning the linear relationship between
doorway width and achievable flow rate. Fire Saf. J. 2009, 44, 80–87. [CrossRef]
22. Shiwakoti, N.; Gong, Y.; Shi, X.; Ye, Z. Examining influence of merging architectural features on pedestrian
crowd movement. Saf. Sci. 2015, 75, 15–22. [CrossRef]
23. Chen, S.; Fu, L.; Fang, J.; Yang, P. The effect of obstacle layouts on pedestrian flow in corridors: An experimental
study. Phys. A Stat. Mech. Appl. 2019, 534, 122333. [CrossRef]
24. Bae, Y.-H.; Kim, Y.-C.; Oh, R.-S.; Son, J.-Y.; Hong, W.-H.; Choi, J.-H. Walking speed reduction rates at
intersections while wayfinding indoors: An experimental study. Fire Mater. 2020. [CrossRef]
25. Nagai, R.; Fukamachi, M.; Nagatani, T. Evacuation of crawlers and walkers from corridor through an exit.
Phys. A Stat. Mech. Appl. 2006, 367, 449–460. [CrossRef]
26. Daamen, W.; Hoogendoorn, S. Capacity of doors during evacuation conditions. Procedia Eng. 2010, 3, 53–66.
[CrossRef]
27. Liao, W.; Tordeux, A.; Seyfried, A.; Chraibi, M.; Drzycimski, K.; Zheng, X.; Zhao, Y. Measuring the steady
state of pedestrian flow in bottleneck experiments. Phys. A Stat. Mech. Appl. 2016, 461, 248–261. [CrossRef]
28. Tavares, R.M. Design for horizontal escape in buildings: The use of the relative distance between exits as an
alternative approach to the maximum travel distance. Saf. Sci. 2010, 48, 1242–1247. [CrossRef]
29. Zhao, D.L.; Li, J.; Zhu, Y.; Zou, L. The application of a two-dimensional cellular automata random model to
the performance-based design of building exit. Build. Environ. 2008, 43, 518–522. [CrossRef]
30. Khamis, N.; Selamat, H.; Ismail, F.S.; Lutfy, O.F.; Haniff, M.F.; Nordin, I.N.A.M. Optimized exit door locations
for a safer emergency evacuation using crowd evacuation model and artificial bee colony optimization.
Chaos Solitons Fractals 2020, 131, 109505. [CrossRef]
31. McDermott, H.; Haslam, R.; Gibb, A. Occupant interactions with self-closing fire doors in private dwellings.
Saf. Sci. 2010, 48, 1345–1350. [CrossRef]
32. Hopkin, C.; Spearpoint, M.; Wang, Y. Internal door closing habits in domestic premises: Results of a survey
and the potential implications on fire safety. Saf. Sci. 2019, 120, 44–56. [CrossRef]
33. Fruin, J.J. Service Pedestrian Planning and Design; Metropolitan Association of Urban Designers and
Environmental Planners: New York, NY, USA, 1971.
34. Paschoarelli, L.C.; Santos, R.; Bruno, P. Influence of door handles design in effort perception: Accessibility
and usability. Work 2012, 41, 4825–4829. [CrossRef] [PubMed]
35. Paschoarelli, L.C.; Santos, R. Usability Evaluation of Different Door Handles; CRC Press: Boca Raton, FL, USA,
2010; pp. 291–299.
36. Boyce, K.; McConnell, N.; Shields, J. Evacuation response behaviour in unannounced evacuation of licensed
premises. Fire Mater. 2017, 41, 454–466. [CrossRef]Sustainability 2020, 12, 8453 16 of 16
37. Shen, Y.; Wang, Q.S.; Yan, W.G.; Sun, J.H.; Zhu, K. Evacuation Processes of Different Genders in Different
Visibility Conditions—An Experimental Study, Proceedings of the Procedia Engineering; Elsevier Ltd.: Amsterdam,
The Netherlands, 2014; Volume 71, pp. 65–74.
38. Seike, M.; Kawabata, N.; Hasegawa, M. Experiments of evacuation speed in smoke-filled tunnel. Tunn. Undergr.
Space Technol. 2016, 53, 61–67. [CrossRef]
39. Xie, W.; Lee, E.W.M.; Cheng, Y.; Shi, M.; Cao, R.; Zhang, Y. Evacuation performance of individuals and social
groups under different visibility conditions: Experiments and surveys. Int. J. Disaster Risk Reduct. 2020,
47, 101527. [CrossRef]
40. Helbing, D.; Farkas, I.; Vicsek, T. Simulating dynamical features of escape panic. Nature 2000, 407, 487–490.
[CrossRef]
41. Lee, R.S.C.; Hughes, R.L. Prediction of human crowd pressures. Accid. Anal. Prev. 2006, 38, 712–722.
[CrossRef]
42. Seyfried, A.; Steffen, B.; Klingsch, W.; Lippert, T.; Boltes, M. The Fundamental Diagram of Pedestrian Movement
Revisited—Empirical Results and Modelling, Proceedings of the Traffic and Granular Flow’05; Schadschneider, A.,
Pöschel, T., Kühne, R., Schreckenberg, M., Wolf, D.E., Eds.; Springer: Berlin/Heidelberg, Germany, 2007;
pp. 305–314.
43. Kretz, T.; Grünebohm, A.; Schreckenberg, M. Experimental study of pedestrian flow through a bottleneck.
J. Stat. Mech. Theory Exp. 2006. [CrossRef]
44. Graat, E.; Midden, C.; Bockholts, P. Complex evacuation; effects of motivation level and slope of stairs on
emergency egress time in a sports stadium. Saf. Sci. 1999, 31, 127–141. [CrossRef]
45. Fu, L.; Cao, S.; Shi, Y.; Chen, S.; Yang, P.; Fang, J. Walking behavior of pedestrian social groups on stairs:
A field study. Saf. Sci. 2019, 117, 447–457. [CrossRef]
46. Haghani, M.; Sarvi, M.; Shahhoseini, Z. Evacuation behaviour of crowds under high and low levels of
urgency: Experiments of reaction time, exit choice and exit-choice adaptation. Saf. Sci. 2020, 126, 104679.
[CrossRef]
Publisher’s Note: MDPI stays neutral with regard to jurisdictional claims in published maps and institutional
affiliations.
© 2020 by the authors. Licensee MDPI, Basel, Switzerland. This article is an open access
article distributed under the terms and conditions of the Creative Commons Attribution
(CC BY) license (http://creativecommons.org/licenses/by/4.0/).You can also read