Dataset and validation of the approaches to study skills inventory for students
←
→
Page content transcription
If your browser does not render page correctly, please read the page content below
www.nature.com/scientificdata

               OPEN           Dataset and validation of the
Data Descriptor               approaches to study skills inventory
                              for students
                                                         1✉
                              Skarlatos G. Dedos              & Dimitris Fouskakis2

                              There exists a vast amount of research on how students, in higher education, approach their studying
                              and learning. Such research resulted in a multitude of questionnaires and tools to capture the way
                              students perform in higher education institutions. One of these tools is the Approaches to Study
                              Skills Inventory for Students (ASSIST) that was developed in the ’80 s and ’90 s. This inventory broadly
                              classifies students, as approaching their study, in a deep, a strategic and/or a surface manner. Although
                              it has gone through rigorous validation in many studies, there exist no publicly available dataset of
                              the results of these studies and so the raw datasets cannot be re-used or integrated with other similar
                              datasets. Here, we report and make publicly available the raw data of an 8-year longitudinal survey
                              using this inventory in a cohort study of 1181 students from a department of a higher education
                              institution. We validated our dataset using reliability analyses that confirmed, and compared well, with
                              the results of previous studies.

                              Background & Summary
                              How can we enhance students’ studying in higher education? This multi-faceted question has been the focus
                              of a great number of studies1–12 and it is generally regarded that the students’ involvement with the curricu-
                              lum is one of the most decisive factors. Several tools have been developed to help academic teachers assess stu-
                              dents’ approaches to study, such as the Vermunt’s inventory of Learning Styles in Higher Education (ILS)13, the
                              Approaches to Study Skills Inventory for Students (ASSIST)14, the Kolb’s Learning Style Inventory (LSI)15, the
                              Visual, Aural, Read/Write, Kinaesthetic learning-styles inventory16, or the Motivated Strategies for Learning
                              Questionnaire (MSLQ)17, among many others10–12,18. One line of research, dating back to the ‘70 s focused on
                              the approaches to studying and through a repeated improvement of an original questionnaire, arrived into a 52
                              items inventory that came to be called Approaches to Study Skills Inventory for Students14,19. The responses to this
                              5-point Likert scale inventory, when analysed as groups of 4 items (questions) clustered into sub-scales and scales,
                              provide a broad attribute to the responder as having a deep approach, a strategic approach or a surface approach
                              to studying14. Several weaknesses, as well as strengths, have been identified in this inventory11, one among them
                              being the labelling of individuals, rather than behaviours, as being “deep” or “strategic” or “surface” learners11.
                              Although one study20 identified the absence of clear polarity between the three approaches in subsets of students,
                              several studies have validated this inventory in diverse higher education institutions in many countries.
                                  Here, we report and make publicly available the results of a multi-sample longitudinal study that asked under-
                              graduate students to complete, in real time, a Greek version of the inventory21. In the first year of the study
                              (2011), students were not asked to provide their names and departmental ID so as to avoid any refusal to par-
                              ticipate. From the 2nd year (2012) and until the 8th year (2018) of this study, students were asked to provide their
                              departmental ID and name if they wished, and most of the students happily did. No names are included and the
                              departmental IDs of the students are codified in the publicly available dataset22. For each year, we sought to have
                              the same students completing the inventory so as to identify whether there are any changes in their responses. We
                              have then integrated the responses of the students into a single file22. Specific information about the inventory and
                              the data collection procedure are provided in the Methods Section.
                                  One of the broader goals, that motivated us to collect the data, was the absence of any publicly available data-
                              set from any study that has used this inventory so that we could make an in-depth validation and compare any

                              1
                                Department of Biology, National and Kapodistrian University of Athens, Panepistimioupoli Zografou, Athens,
                              15784, Greece. 2Department of Mathematics, National Technical University of Athens, Zografou Campus, Athens,
                              15780, Greece. ✉e-mail: sdedos@biol.uoa.gr

  Scientific Data |   (2021) 8:158 | https://doi.org/10.1038/s41597-021-00943-6                                                                  1
www.nature.com/scientificdata/ www.nature.com/scientificdata
analyses done on other datasets vis-à-vis our dataset. By having the collected dataset publicly available we believe
that we increase the potential re-use value of the inventory and enable further analysis and further comparative
research to be carried out on the way undergraduate students manage their studies. Another broader goal was the
need to identify students who have a “surface” approach to studying23,24. Such students have been documented
in many other studies2,7,9,14,19 as having an ineffective approach to studying by simply memorising facts just to
pass a course, an approach that is ill-suited in today’s tertiary education where a vast amount of information
is available6,23. By making this dataset public, we hope we can enable other researchers to quickly identify such
students by analysing their responses to the inventory and thereby redesign, wherever appropriate, instructions
and assessment.
Methods
Participants. Tertiary education in Greece is public and exclusively provided by higher education institu-
tions that are subject to state supervision and financed by the government. Admission of students to these higher
education institutions depends on their performance at nation-wide exams that take place yearly when students
complete their secondary education (mostly at the age of 18). Enrolment to the various schools or departments
of the Greek universities depends on the general score obtained by the secondary education graduates at these
nation-wide exams, on the number of available places at each higher education institution and on the candidates’
ranked preferences among schools and departments of a university. Enrolment to a school or department of a
university entails the attendance of the departmental program of study that lasts for 8 semesters (4 years) in most
cases. Therefore, enrolment to a school or department of a university in Greece is defined as the registration, by
obtaining a departmental ID, of a student to only one departmental program of study. Students who complete
their studies are awarded their degree when they have passed the necessary number of courses stipulated in the
departmental program and have accumulated the required number of credits.
All 1181 participants had enrolled in the Department of Biology, National and Kapodistrian University of
Athens since 2007 (with 5 exceptions22). The Department of Biology enrolled on average 161,4 students/year in the
10-year cohort (2007–2016) of participating students (Table 1). The survey was carried out for 8 consecutive years,
from 2011 until 2018. Participation in the study is defined as the number of students that have completed and
handed in the inventory every time they were asked, starting on the spring semester of 2011 when students attend-
ing all 4 years of the departmental program (i.e. those with a departmental ID from 2007 to 2010) were asked to
complete the inventory and lasting until the spring semester of 2018 for students that enrolled in the Department
of Biology until 2016 (Table 1). Participation in the study was calculated to be 72.37% (N = 1614) if all students
are accounted for, and 86.97% (N = 1297), if the students that dropped out of the program (N = 317) are excluded
(Table 1). A total of 2029 hard copies of the inventory were collected in this longitudinal study from students
ranging from the 1st to the 5th year of study (Table 1). For 81 students, we managed to have their responses for each
year of the 4-year program and for 221 and 192 students we managed to have their responses for the two years and
three years, respectively, of the 4-year program. The Greek version of the inventory21 was handed to each student
before the beginning of practical/laboratory classes of variable courses, early in the spring semester (2nd semester
of each academic year). Students were asked to provide their departmental ID and/or their name if they wished.
In the first year of the survey (2011) students were not asked to provide their departmental ID or their name so as
to determine whether they will complete the inventory without the fear of being identified. As it turns out from
the rates of participation in the 8-year survey, students displayed a high rate of voluntary participation (Table 1).
Questionnaire. The English version of the Approaches to Study Skills Inventory for Students
(ASSIST)14,19,25–27 was used as presented19. It was translated into Greek21 by the authors and was compared to an
earlier Greek version of the inventory28 aiming to translate the meaning of each statement rather than provide
an accurate translation of each statement. The Greek version was then back translated to English and was further
cross-examined for the accuracy of each statement.
The English version of the inventory19 consists of three parts. All three parts of the inventory consist of a
5-point Likert scale where the highest number (i.e. 5) indicates agreement with the item (question) being asked
and therefore places the responder as scoring high in this item. Conversely, the lowest number (i.e. 1) indicates
disagreement with the item (question) being asked and therefore places the responder as scoring low in this item.
The first part of the inventory contains 6 items (questions) about the conceptions of learning that have not been
thoroughly analysed in the relevant literature14,25.
The second part of the English version contains 52 items (questions). This part has been mostly used on its
own in the relevant literature, it is generally referred as the Revised ASI or RASI14,29, and generates scores on the
Deep Approach, the Strategic Approach and the Surface Approach to studying (Tables 2–4)14,25,26,30.
In more detail, the sum of responses to the 5-point Likert scale of particular items form a particular sub-scale
(see Table 2)14,19, while the sum of responses to the 5-point Likert scale of 16 or 20 items (questions) (Table 2) form
the Deep, the Strategic and the Surface Approach to studying14,19. When a responder scores high on the sum of the
responses to the 5-point Likert scale of, for example, the 16 items that form the Deep Approach to studying, then,
depending on the analysis, the responder can be categorised as exhibiting a “deep” approach to studying11,14,19,20.
The third part contains 8 items (questions) about the students’ preferences for different kinds of teaching. It
is also composed of a 5-point Likert scale as described above and this part has also not been thoroughly analysed
in the relevant literature14,25. The inventory also contains a self-rating question presented as a 9-point Likert scale
in which students are asked to assess their own academic progress starting from 1 as “rather badly” and ending
to 9 as “very well”14,19,21.
The Greek version of the inventory21, that we asked students to complete, also contained, on its first page,
questions about their parents’ education background (i.e. whether their father and/or mother have completed
primary, secondary or tertiary education), and questions about their gender, age and year of study21,22.
Scientific Data | (2021) 8:158 | https://doi.org/10.1038/s41597-021-00943-6 2www.nature.com/scientificdata/ www.nature.com/scientificdata
Student Cohort
Discontinued Participants’ Year of Study
Academic Year1 Survey Participants Enrolled Graduated Non-Graduates4 their Studies5 (1st/2nd/3rd/4th year)
Cohort2 158
2007 91 40 27 (N.D./N.D./N.D./76)
Participants3 48%
Cohort 155
2008 93 33 29 (N.D./N.D./116/N.D.)
Participants 75%
Cohort 144 86 35
2009 23 (N.D./78/1/8 + 3*)
Participants 63% 12% 6%
Cohort 153 88 36
2010 29 (76/1/25/5 + 4*)
Participants 73% 40% 14%
Cohort 142 77 32 33
2011 (52/29/10/16 + 3*)
Participants 77% 70%6 38%6 6%6
Cohort 153 76 34 43
2012 (99/5/2/1)
Participants 70% 100% 71% 16%
Cohort 188 80 76 22
2013 (74/64/11/5)
Participants 82% 100% 87% 36%
Cohort 201 21 134 46
2014 (150/5/ N.D./N.D.)
Participants 77% 100% 89% 33%
Cohort 159 N.D. 133 26
2015 (125/4/N.D./N.D.)
Participants 81% 94% 15%
Cohort 161 N.D. 122 39
2016 (120/N.D./N.D./N.D.)
Participants 75% 95% 10%
Cohort 1614 612 675 317
Total (696/186/165//111 + 10*)
Participants 72% 45% 70% 13%
Table 1. Tabulation of the number of students that enrolled at the Department of Biology relative to those that
responded to the Approaches to Study Skills Inventory for Students (ASSIST). The survey lasted for 8 years (2011–
2018) therefore, N.D.: No Data collected. The numbers in brackets indicate the number of students that participated
in the survey per year and category and % indicates their percentage relative to the cohort shown in the same cell.
1
The year that the students enrolled to the undergraduate program of the Department of Biology and acquired their
unique departmental ID, 2Total number of students that enrolled at the 4-year study program each year, 3Percentage
of students that responded to the survey at least once, 4Number of students that have not yet graduated as of 08/2019,
5
Number of students that have dropped out of the program as of 08/2019, 642 students that did not report their
departmental ID, *Number of students that deferred enrolment to the program for 1 year. There are 8 additional
students that could not be assigned to a specific academic year due to incomplete demographic information they
provided and 5 students with reported deferral of enrolment to the program for more than 1 year.
Scales (Approaches) Sub-scales Items
Seeking meaning (SM) 4, 17, 30 and 43
Relating ideas (RI) 1, 21, 33 and 46
Deep
Use of evidence (UE) 9, 23, 36 and 49
Interest in ideas (II) 13, 26, 39 and 52
Organised studying (OS) 1, 14, 27 and 40
Time management (TM) 5, 18, 31 and 44
Strategic Alertness to assessment (AA) 2, 15, 28 and 41
Achieving (AC) 10, 24, 37 and 50
Monitoring effectiveness (ME) 7, 20, 34 and 47
Lack of purpose (LP) 7, 20, 34 and 47
Unrelated memorising (UM) 6, 19, 32 and 45
Surface
Syllabus-boundness (SB) 12, 25, 38 and 51
Fear of failure (FF) 8, 22, 35 and 48
Table 2. Structure of the second part of the Approaches to Study Skills Inventory for Students. Each sub-scale
is formed by the sum of the responses to four particular items (questions) of the second part of the inventory.
In turn, each of the three identified14,19 approaches (Scales) to studying is formed by the sum of the responses to
the items (questions) that comprise the four (or five in the case of the Strategic Approach) sub-scales.
Data collection and integration. Hard copies of the inventory were collected by one of the authors,
handed to another person to tabulate them into an Excel file and then cross-examined for accuracy of each
entry. Then, the departmental ID of each student was given a random codified number to provide anonymity. A
Scientific Data | (2021) 8:158 | https://doi.org/10.1038/s41597-021-00943-6 3www.nature.com/scientificdata/ www.nature.com/scientificdata
0.838 0.844 0.731
Deep Approach (N = 1914) Strategic Approach (N = 1950) Surface Approach (N = 1946)
0.525 0.568 0.527
Seeking meaning Organised studying Lack of purpose
(N = 1985) (N = 1998) (N = 2005)
0.660 0.751 0.465
Relating ideas Time management Unrelated memorising
(N = 1985) (N = 2016) (N = 1994)
0.579 0.615 0.530
Use of evidence Alertness to assessment Syllabus-boundness
(N = 1999) (N = 2009) (N = 1997)
0.650 0.630 0.640
Interest in ideas Achieving Fear of failure
(N = 2005) (N = 2008) (N = 2018)
0.573
Monitoring effectiveness
(N = 2011)
Table 3. Cronbach’s α reliability index for the sub-scales and the Deep, Strategic and Surface Approach scales.
For each Cronbach’s α value the sample size is also shown.
Greece22,31 Portugal36 Portugal35 Norway33 Ireland37 USA37 Ireland34
(this study)
Scales and sub-scales N = 2029 N = 386 N = 566 N = 573 N = 437 N = 298 N = 286
Deep Approach 0.838 0.78 0.81 0.81 0.84 0.82 0.81
Seeking meaning 0.525 0.51 0.51 0.49 0.63 0.55 0.66
Relating ideas 0.660 0.47 0.54 0.62 0.59 0.59 0.55
Use of evidence 0.579 0.59 0.59 0.49 0.59 0.49 0.63
Interest in ideas 0.650 0.59 0.56 0.64 0.69 0.67 0.54
Strategic Approach 0.827 0.81 0.83 0.81 0.87 0.87 0.86
Organised studying 0.568 0.55 0.51 0.59 0.63 0.55 0.54
Time management 0.751 0.63 0.65 0.72 0.74 0.77 0.76
Alertness to assessment 0.615 0.47 0.40 0.41 0.63 0.56 0.67
Achieving 0.630 0.58 0.67 0.66 0.68 0.63 0.65
Monitoring effectiveness 0.573 0.55 0.58 0.51 0.61 0.61 0.52
Surface Approach 0.731 0.66 0.79 0.70 0.83 0.80 0.80
Lack of purpose 0.527 0.59 0.54 0.68 0.75 0.68 0.73
Unrelated memorising 0.465 0.48 0.73 0.57 0.59 0.57 0.53
Syllabus-boundness 0.530 0.47 0.62 0.57 0.64 0.55 0.61
Fear of failure 0.640 0.57 0.63 0.57 0.74 0.72 0.77
Table 4. Cronbach’s α reliability index for the sub-scales and the Deep, Strategic and Surface Approach scales
calculated in this study and previous studies. For each Cronbach’s α value the sample size is also shown.
consecutive response number (i.e. 1, 2, 3 or 4) was given if multiple responses from each student were collected22.
Each responder’s gender was codified as 1 = male or 2 = female. Their age was left as stated by each responder
(≥18)22 and their year of study (termed year of study at assessment)22 was left as stated by each responder (≥1)22.
The dataset was enriched with information about the year that each responder completed the inventory and the
year that they enrolled at the Department of Biology22. Missing values were left intact. All data were then trans-
ferred into an SPSS v26 (Armonk, N.Y., IBM Corp) file for analysis.
Data Records
The Data Records consist of 4 separate files that have been deposited to Figshare data repository system.
The first Data Record (https://doi.org/10.6084/m9.figshare.13507341.v4) is the Greek version of the
Approaches to Study Skills Inventory for Students and it is deposited for validation and re-use purposes, contain-
ing both the Greek text and the original text in English from which the translation was generated21.
The second Data Record (https://doi.org/10.6084/m9.figshare.13507362.v4) is an Excel file that contains all
the responses to the inventory and additional information for each responder22. Details about the contents of each
column of the dataset are given on its first row and a codebook, in.htm format, accompanies this record in which
details about the percentages of missing values and the responses are documented22.
The third Data Record (https://doi.org/10.6084/m9.figshare.13507374.v2) is an SPSS output file, in.htm for-
mat, that contains all the dataset’s validation results, with the most important ones presented in Tables 3 and 4.
This record contains all the reliability analysis tests and the inter-item Spearman correlation matrix results31.
The fourth Data Record (https://doi.org/10.6084/m9.figshare.13507383.v2) is an Excel file that contains
a description of the courses taught in the Department of Biology during the 4 years of undergraduate study
and during the years that the survey took place. Data collection was terminated in 201832, after the Department
Scientific Data | (2021) 8:158 | https://doi.org/10.1038/s41597-021-00943-6 4www.nature.com/scientificdata/ www.nature.com/scientificdata
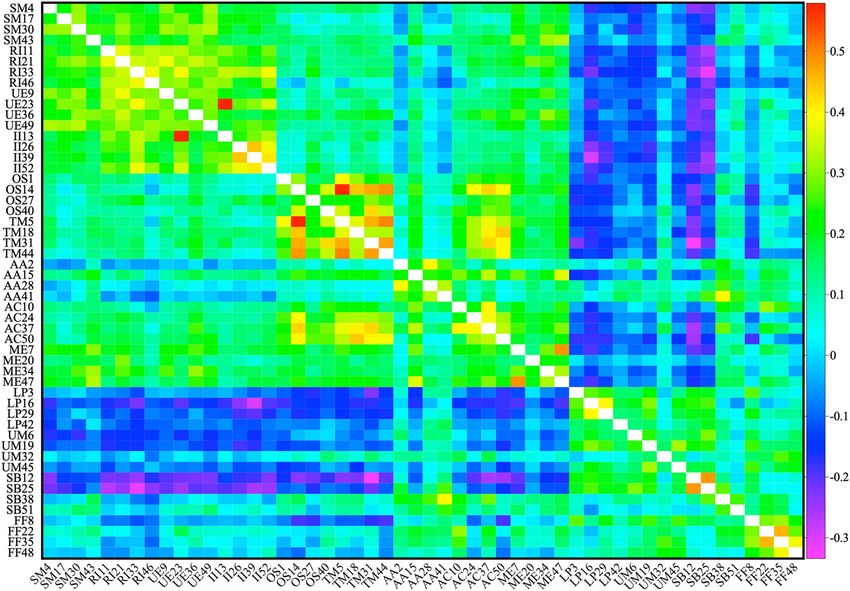
Fig. 1 Inter-item Spearman correlation matrix for the items in the Approaches to Study Skills Inventory for
Students. The 52 items of the second part of the inventory are ordered so that the first 16 (SM, RI, UE and II)
form the Deep Approach scale, the next 20 (OS, TM, AA, AC and ME) form the Strategic Approach scale and
the last 16 (LP, UM, SB and FF) form the Surface Approach scale as described14,19. Numbers indicate the order
of the appearance of the items in the inventory. The Spearman correlation matrix was generated using SPSS v26
without correcting for missing values. Abbreviations are: SM, Seeking Meaning. RI, Relating Ideas. UE, Use of
Evidence. II, Interest in Ideas. OS, Organised studying. TM, Time Management. AA, Alertness to Assessment.
AC, AChieving. ME, Monitoring Effectiveness. LP, Lack of Purpose. UM, Unrelated memorising. SB, Syllabus-
Boundness. FF, Fear of Failure. The same abbreviations are used in31.
implemented a new undergraduate program in 2017, however records about the students’ completion of the pro-
gram were collected until August 2019. Details about the contents of each column of the dataset are given on its
first row of the spreadsheet32.
Technical Validation
As done in all of the relevant literature14,33–36 of this inventory, technical validation consisted of reliability analysis
on SPSS v26 using Cronbach’s α14 reliability index (SPSS > Analyse > Scale > Reliability analysis) (Tables 3 and 4)
and inter-item Spearman correlation matrices (SPSS > Analyse > Correlate > Bivariate) (Fig. 1). The results in
Fig. 1 show that, as suggested in many other studies14,19,20,33,34, the sub-scale “Monitoring effectiveness” displays
ambivalent Spearman correlation coefficients with the sub-scales that are grouped in the Deep Approach and the
Strategic Approach14,20, while the “Alertness to Assessment” sub-scale displays an anomalous Spearman correla-
tion with the other sub-scales that form the Strategic approach, a result that has been reported before and resulted
in its exclusion in a previous study20.
The results in Table 3 show the Cronbach’s α14 reliability index and the number of responses that the stu-
dents gave in each of the sub-scales. Of note is the fact that the Cronbach’s α14 reliability index does not change
much if the sub-scale “Monitoring effectiveness” is grouped within the other items of the Deep Approach (0.846
(N = 1904)31 vis-à-vis 0.838 (N = 1914); Table 3).
Finally, we tabulated (Table 4) the Cronbach’s α14 reliability index for each sub-scale and each approach against
the results reported in previous studies14,33–35,37. The results in Table 4 show that the Cronbach’s α reliability index
falls within and does not exceed any of the previously reported values within the sub-scales and the three differ-
ent scales (approaches) that the inventory identifies. Notable exception is the sub-scale “Unrelated memorising”
which is below all the values shown in Table 4.
Usage Notes
To the best of our knowledge, this is the first report that makes publicly available a dataset that is related to the
Approaches to Study Skills Inventory for Students. This gives other researchers the opportunity to re-analyse
the dataset in multiple ways. For example, other researchers can re-analyse the dataset by re-arranging or omit-
ting20 items of each sub-scale to improve the reliability of the analysis. Alternatively, other researchers can opt to
regroup the items in a way that will unmask other covert approaches to studying23. As a third and very important
example, our dataset can be used to analyse the first part and the third part of the inventory that have not been
thoroughly analysed to date14,25 and can be a rich source of correlated information between the responses in the
first or third part and the responses to the second part of the inventory. Moreover, other researchers that have
worked with the same inventory in the past have now the opportunity to compare this dataset with those that may
Scientific Data | (2021) 8:158 | https://doi.org/10.1038/s41597-021-00943-6 5www.nature.com/scientificdata/ www.nature.com/scientificdata
have been generated even several decades ago and thus identify any inter-generational aspect(s) of how students’
approach to studying may or may not have changed.
By making publicly available the dataset we generated, we also hope that other researchers will use this dataset
in cross-cultural and interdisciplinary studies. Due to its multidimensional nature, containing responses to the
inventory and other metrices without identifying each student, the dataset can be integrated with datasets that
others may generate in the future.
Code availability
® ®
The IBM SPSS software v26, licensed to the National and Kapodistrian University of Athens (http://www.
cc.uoa.gr/texniki-ypostiri3h/egkatastash-paketwn-logismikoy/spss.html), was used for the dataset analysis31
with no specific variables or parameters used to process the current dataset. The Microsoft Excel for Mac
Version 16.16.14 (190909) was used to tabulate the responses to the inventory and generate the dataset22 before
®
® ®
analysis with the IBM SPSS software v26. No custom code was used in the generation or processing of the
dataset. The codebook that accompanies the second Data Record was generated by the IBM SPSS v26 software
(SPSS > Analyse > Reports > Codebook).
® ®
Received: 6 January 2021; Accepted: 30 April 2021;
Published: xx xx xxxx
References
1. Marton, F. & Svensson, L. Conceptions of research in student learning. Higher Education 8, 471–486, https://doi.org/10.1007/
BF01680537 (1979).
2. Entwistle, N. & Ramsden, P. Understanding Student Learning. (Routledge, 1983).
3. Biggs, J. Student Approaches to Learning and Studying. (Australian Council for Educational Research, 1987).
4. Bowen, J. A., Masters, G. N. & Ramsden, P. In The Learner in Higher Education: A Forgotten Species? (eds A.H. Miller & G. Sachse‐
Akerlind) pp. 397–407 (Higher Education Research and Development Society of Australasia, 1987).
5. Chan, J. Y. K. & Bauer, C. F. Learning and Studying Strategies Used by General Chemistry Students with Different Affective
Characteristics. Chem. Educ. Res. Pract. 17, 675 (2016).
6. Entwistle, N. in Reframing the Conceptual Change Approach in Learning and Instruction (eds S. Vosniadou, A. Baltas, & X.
Vamvakoussi) 123-143 (Elsevier, 2007).
7. Marton, F., Säljö, R., Marton, F., Hounsell, D. & Entwistle, N. The Experience of Learning: Implications for Teaching and Studying in
the Higher Education. (Scottish Academic Press, 1997).
8. Tait, H., Entwistle, N. J., McCune, V. & Rust, C. In Improving student learning: Improving students as learners (ed C. Rust) (The
Oxford Centre for Staff and Learning Development, 1998).
9. Meyer, J. H. F., Dart, B. & Boulton-Lewis, G. Teaching and Learning in Higher Education. (Australian Council for Educational
Research, 1998).
10. Felder, R. M. & Brent, R. Understanding Student Differences. Journal of Engineering Education 94, 57–72, https://doi.
org/10.1002/j.2168-9830.2005.tb00829.x (2005).
11. Coffield, F. et al. LSRC reference [vii], 77 p. (Learning & Skills Research Centre, London, 2004).
12. Pashler, H., McDaniel, M., Rohrer, D. & Bjork, R. Learning Styles:Concepts and Evidence. Psychological Science in the Public Interest
9, 105–119, https://doi.org/10.1111/j.1539-6053.2009.01038.x (2008).
13. Vermunt, J. D. The regulation of constructive learning processes. British Journal of Educational Psychology 68, 149–171, https://doi.
org/10.1111/j.2044-8279.1998.tb01281.x (1998).
14. Entwistle, N., Tait, H. & McCune, V. Patterns of response to an approaches to studying inventory across contrasting groups and
contexts. European Journal of Psychology of Education 15, 33, https://doi.org/10.1007/BF03173165 (2000).
15. West, R. F. A construct validity study of Kolb’s learning style types in medical educa tion. Journal of Medical Education 57, 794–796,
https://doi.org/10.1097/00001888-198210000-00009 (1982).
16. Fleming, N. D. & Mills, C. Helping Students Understand How They Learn. Vol. 7 (Magma Publications, 1992).
17. Zeegers, P. Approaches to learning in science: A longitudinal study. British Journal of Educational Psychology 71, 115–132, https://
doi.org/10.1348/000709901158424 (2001).
18. Blazhenkova, O. & Kozhevnikov, M. The new object-spatial-verbal cognitive style model: Theory and measurement. Applied
Cognitive Psychology 23, 638–663, https://doi.org/10.1002/acp.1473 (2009).
19. Entwistle, N. & Tait, H. Approaches and Study Skills Inventory for Students (ASSIST) (incorporating the Revised Approaches to
Studying Inventory - RASI). (2013).
20. Long, W. F. Dissonance Detected by Cluster Analysis of Responses to the Approaches and Study Skills Inventory for Students. Studies
in Higher Education 28, 21–35, https://doi.org/10.1080/03075070309303 (2003).
21. Dedos, S. G. & Fouskakis, D. The Greek version (with English translation) of the Approaches to Study Skills Inventory for Students.
figshare https://doi.org/10.6084/m9.figshare.13507341.v4 (2021).
22. Dedos, S. G. & Fouskakis, D. Responses to the Greek version of the Approaches to Study Skills Inventory for Students. figshare
https://doi.org/10.6084/m9.figshare.13507362.v4 (2021).
23. Lindblom-Ylänne, S., Parpala, A. & Postareff, L. What constitutes the surface approach to learning in the light of new empirical
evidence? Studies in Higher Education 44, 2183–2195, https://doi.org/10.1080/03075079.2018.1482267 (2019).
24. Meyer, J. H. F. Study orchestration: the manifestation, interpretation and consequences of contextualised approaches to studying.
Higher Education 22, 297–316, https://doi.org/10.1007/BF00132293 (1991).
25. Tait, H., Entwistle, N. & McCune, V. Improving Student Learning: Improving Students as Learners. Vol. null (1998).
26. Entwistle, N., Tait, H. & McCune, V. Scoring Key for Approaches to Studying Subscales within the Approaches and Study Skills
Inventory for Students. (1999).
27. Entwistle, N. J. The Approaches and Study Skills Inventory for Students (ASSIST). (1997).
28. Karagiannopoulou, E. & Christodoulides, P. The impact of Greek University students’ perceptions of their learning environment on
approaches to studying and academic outcomes. International Journal of Educational Research 43, 329–350, https://doi.org/10.1016/j.
ijer.2006.05.002 (2005).
29. Richardson, J. T. E. Students’ perceptions of academic quality and approaches to studying in distance education. British Educational
Research Journal 31, 7–27, https://doi.org/10.1080/0141192052000310001 (2005).
30. Tait, H. & Entwistle, N. Identifying students at risk through ineffective study strategies. Higher Education 31, 97–116, https://doi.
org/10.1007/BF00129109 (1996).
31. Dedos, S. G. & Fouskakis, D. Validation analysis of the responses to the Greek version of the Approaches to Study Skills Inventory
for Students. figshare https://doi.org/10.6084/m9.figshare.13507374.v2 (2021).
Scientific Data | (2021) 8:158 | https://doi.org/10.1038/s41597-021-00943-6 6www.nature.com/scientificdata/ www.nature.com/scientificdata
32. Dedos, S. G. & Fouskakis, D. Departmental profile. figshare https://doi.org/10.6084/m9.figshare.13507383.v2 (2021).
33. Diseth, Å. Validation of a Norwegian Version of the Approaches and Study Skills Inventory for Students (ASSIST): Application of
str uctural equation mo delling. Scandinav ian Jour nal of Educational Research 45, 381–394, https://doi.
org/10.1080/00313830120096789 (2001).
34. Ballantine, J. A., Duff, A. & McCourt Larres, P. Accounting and business students’ approaches to learning: A longitudinal study.
Journal of Accounting Education 26, 188–201, https://doi.org/10.1016/j.jaccedu.2009.03.001 (2008).
35. Valadas, S. C. A. T. S., Gonçalves, F. R. & Faísca, L. M. Approaches to studying in higher education Portuguese students: a Portuguese
version of the approaches and study skills inventory for students. Higher Education 59, 259–275, https://doi.org/10.1007/s10734-
009-9246-5 (2010).
36. Teixeira, C., Gomes, D. & Borges, J. The Approaches to Studying of Portuguese Students of Introductory Accounting. Accounting
Education 22, 193–210, https://doi.org/10.1080/09639284.2013.766426 (2013).
37. Byrne, M., Flood, B. & Willis, P. Validation of the approaches and study skills inventory for students (assist) using accounting
students in the USA and Ireland: a research note. Accounting Education 13, 449–459, https://doi.org/10.1080/0963928042000306792
(2004).
Acknowledgements
The authors would like to acknowledge the help of Mr. A. Bakalakis in data tabulation. The authors thank Mrs.
E.-N. Hamaoui, Head of the Data Processing Centre of the National and Kapodistrian University of Athens,
Greece, for her assistance to the study design. The authors thank Assoc. Prof. E. Karagiannopoulou for assistance
with the Greek version of the inventory. The authors thank all the students that participated in the survey and the
colleagues from the Department of Biology that enabled the collection of the data throughout the years that this
survey was conducted. The study complies with all relevant ethical regulations since all participants’ identities are
codified and anonymised.
Author contributions
S.G.D., study design; raw data collection; data integration and analysis; writing and editing the submitted
manuscript. F.D., data analysis; writing and editing the submitted manuscript.
Competing interests
The authors declare no competing interests.
Additional information
Correspondence and requests for materials should be addressed to S.G.D.
Reprints and permissions information is available at www.nature.com/reprints.
Publisher’s note Springer Nature remains neutral with regard to jurisdictional claims in published maps and
institutional affiliations.
Open Access This article is licensed under a Creative Commons Attribution 4.0 International
License, which permits use, sharing, adaptation, distribution and reproduction in any medium or
format, as long as you give appropriate credit to the original author(s) and the source, provide a link to the Cre-
ative Commons license, and indicate if changes were made. The images or other third party material in this
article are included in the article’s Creative Commons license, unless indicated otherwise in a credit line to the
material. If material is not included in the article’s Creative Commons license and your intended use is not per-
mitted by statutory regulation or exceeds the permitted use, you will need to obtain permission directly from the
copyright holder. To view a copy of this license, visit http://creativecommons.org/licenses/by/4.0/.
The Creative Commons Public Domain Dedication waiver http://creativecommons.org/publicdomain/zero/1.0/
applies to the metadata files associated with this article.
© The Author(s) 2021
Scientific Data | (2021) 8:158 | https://doi.org/10.1038/s41597-021-00943-6 7You can also read


