Initial insights from 2.5D hydraulic modeling of floods in Athabasca Valles, Mars
←
→
Page content transcription
If your browser does not render page correctly, please read the page content below
GEOPHYSICAL RESEARCH LETTERS, VOL. 34, L21206, doi:10.1029/2007GL031776, 2007
  Click
  Here
    for
 Full
Article

Initial insights from 2.5D hydraulic modeling of floods in Athabasca
Valles, Mars
L. P. Keszthelyi,1 R. P. Denlinger,2 D. R. H. O’Connell,3 and D. M. Burr4
Received 24 August 2007; revised 3 October 2007; accepted 15 October 2007; published 14 November 2007.
[1] We present the first application of a 2.5D hydraulic                   millions of years is considered more likely [Plescia, 2003;
model to catastrophic floods on Mars. This model simulates                 McEwen et al., 2005]. In any case, the estimated dates are in
flow over complex topography and incorporates flood                        the uppermost Amazonian Period.
dynamics that could not be modeled in the earlier 1D                         [3] It is important to note that Athabasca Valles, and the
models. We apply this model to Athabasca Valles, the                       Cerberus Palus basin that it empties into, are covered with
youngest outflow channel on Mars, investigating previous                   platy-ridged material that new images have shown to be
bank-full discharge estimates and utilizing the interpolated               lava [Jaeger et al., 2007]. All the features of potential
Mars Orbiter Laser Altimeter elevation map as input. We                    fluvial origin are draped by this vast lava flow. However,
confirm that the bank-full assumption does not fit the                     the thickness of this lava coating is only of order several
observed landforms. Instead, the channel appears more                      meters, so the larger morphologic features in the channel are
deeply incised near the source. Flow modeling also                         well preserved [Jaeger et al., 2007]. For example, a series
identifies several areas of special interest, including a dry              of streamlined forms surrounds surviving impact craters and
cataract that coincides with a region of predicted high                    knobs of older highlands terrain. Also, distributary channels
erosion. However, artifacts in the elevation data strongly                 cut across the wrinkle ridge in several locations. Other
impacted estimated stages and velocities in other areas.                   flood-related landforms that have been reported include
More extensive connection between the flood hydraulics                     subaqueous dunes, longitudinal grooves, and layered sedi-
and observed landforms awaits improved topographic data.                   ments [Burr et al., 2002a, 2004; Burr, 2005]. These intra-
Citation: Keszthelyi, L. P., R. P. Denlinger, D. R. H. O’Connell,          channel features provide compelling evidence for fluid
and D. M. Burr (2007), Initial insights from 2.5D hydraulic                erosion within Athabasca Valles.
modeling of floods in Athabasca Valles, Mars, Geophys. Res.                  [4] The floods through Athabasca Valles have been
Lett., 34, L21206, doi:10.1029/2007GL031776.                               previously modeled [Burr et al., 2002a, 2002b; Burr,
                                                                           2003] using the 1-D HEC-RAS model from U.S. Army
1. Introduction                                                            Corp of Engineers [Hydrologic Engineering Center, 2002].
                                                                           A water flux of 1 – 2  106 m3 s 1 was estimated for a
  [2] The role of past and present water is the current focus              channel roughness corresponding to a Manning coefficient
of the Mars Exploration Program. Athabasca Valles is                       of n = 0.04 and assuming bank-full flow. However, there are
widely considered to be the site of the most recent major                  a number of limitations of the HEC-RAS model and the
aqueous floods on Mars [e.g., Tanaka and Scott, 1986;                      assumptions used in the model runs. First, the earlier 1-D
Edgett and Rice, 1995; Berman and Hartmann, 2002; Burr                     modeling cannot properly take into account the real (com-
et al., 2002a; Plescia, 2003]. The channel system is located               plex) topography that the flood interacted with [e.g., Burr,
in the young equatorial lowlands of Elysium Planitia. The                  2003]. Second, the use of the Manning coefficient derived
main branch is a 10 to 30 km wide, 300 km long flat-floored                from empirical terrestrial data has been shown to be
valley that tracks the northwestern side of a wrinkle ridge                inappropriate for Mars [Wilson et al., 2004]. Third, the
(Figure 1). The source of the channel is a segment of the                  assumption of bank-full flow is unlikely to be realistic [e.g.,
Cerberus Fossae volcano-tectonic fissures, with two major                  Leask et al., 2007]. Finally, the floodwaters may have
loci of erosion visible in the northeastern corner of Figure 1.            carried enough sediment to affect the flow hydraulics
The average down-flow slope is only 0.05%. While it is                     [Komar, 1980] but only clean water has been modeled.
currently impossible to precisely date the valley carving
event, the floor can be dated using the density of impact
craters. Though some model ages from impact crater size-                   2. Description of the 2.5D Hydraulic Model
frequency distributions suggest the floor is as young as a                   [5] The new numerical model allows substantially better
few million years [Hartmann and Berman, 2000; Burr et                      simulation of floods. It was developed jointly by the U.S.
al., 2002a; Murray et al., 2005], an age of several tens of                Geological Survey and the U.S. Bureau of Reclamations
                                                                           over the past 5 years and constitutes the cutting edge in
   1
     Flagstaff Field Center, U.S. Geological Survey, Flagstaff, Arizona,   modeling terrestrial floods [Denlinger et al., 2002;
USA.
   2
                                                                           O’Connell et al., 2002; Ostenaa et al., 2002; Wallick et
     Cascades Volcano Observatory, U.S. Geological Survey, Vancouver,      al., 2003]. It solves the shallow-water flow equations over
Washington, USA.
   3
     William Lettis and Associates, Golden, Colorado, USA.                 rugged three-dimensional (3D) terrain. For each increment
   4
     Carl Sagan Center for the Study of Life in the Universe, Search for   in time, the flow calculation divides the domain of interest
Extraterrestrial Intelligence Institute, Mountain View, California, USA.   into finite volume cells, calculates the mass and momentum
                                                                           transfer between cells using Riemann methods, then sums
This paper is not subject to U.S. copyright.                               the changes to update the cell variables and proceeds to the
Published in 2007 by the American Geophysical Union.

                                                                    L21206                                                          1 of 5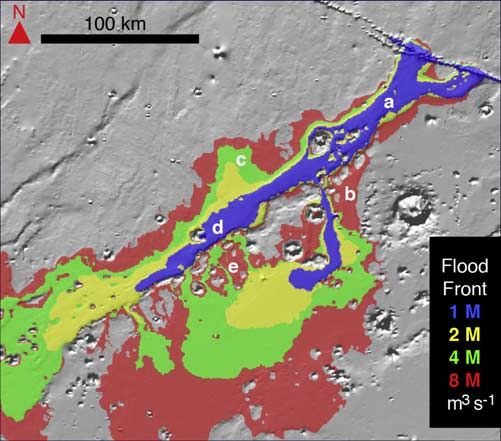
L21206 KESZTHELYI ET AL.: FLOODS IN ATHABASCA VALLES L21206
2.3. Unsteady Flow
[8] The model calculates changes in flow with time, and
has been used to demonstrate the effect of kinematic waves
on routing of the Missoula Floods. The interaction of
unsteady flood waves with 3D channel topography are
likely to be responsible for many of the high-water marks
inferred in Athabasca Valles.
2.4. Spatially Distributed Hydraulic Parameters
[9] The model outputs water surface elevation and
velocity across the computational grid. Combining this
information with surface roughness, we calculate stream
power per unit area, a measure of the erosive potential of the
flood. This information can be used to determine how
erosion and/or deposition will change with time and loca-
tion. The model output has been verified for a number of
historical floods, where field data are compared with pre-
dictions of simulated flow over 3D model terrain [e.g.,
Denlinger et al., 2002; O’Connell et al., 2002; Ostenaa et
al., 2002; Wallick et al., 2003].
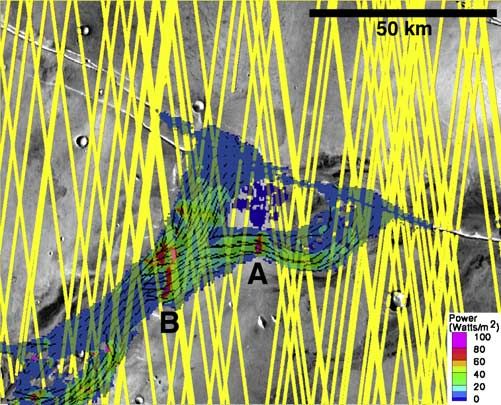
Figure 1. MOLA shaded relief view of Athabasca Valles 2.5. Model Inputs
with colors showing the extent of flood waters 30 hours into
the simulation for discharges of 1, 2, 4, and 8 million m3 s 1. [10] The model inputs are (1) the topography over which
Letters a –e denote areas discussed in more detail in the text. the flood will travel, (2) the discharge rate, (3) the fluid
Illumination is from the south. properties, and (4) the location of the discharge. The best
publicly available topographic data for Athabasca Valles is
provided by the Mars Orbiter Laser Altimeter (MOLA) as a
128 pixels/degree digital terrain model (DTM). It is impor-
next time increment. The method is naturally conservative, tant to note that the cross-track distance between MOLA
though care must be taken to properly conserve mass along shots at this near-equatorial location can be >10 km. We
the boundaries of the flow. A variety of fluids can be found that some interpolation methods can improve the
simulated, including water, mud, and lava. Changing grav- DTM in some areas, but they introduce other artifacts in
itational acceleration to Mars was the only adjustment of the other areas. In any case, no method can recreate features
numerical code required before running the model for that were entirely missed by MOLA. After some experi-
Athabasca Valles. We discuss some of the key improve- mentation, we decided to use the standard MOLA DTM.
ments over previous models below.
2.1. Chezy C Friction Factor
[6] This form of the friction factor is based upon the scale
of channel roughness and, unlike the Manning n, is not
affected by changes in gravity and is consistent with
measurements of fully turbulent flow and the ‘law of the
wall’ [Pope, 2000]. For Athabasca Valles, the model was
run with the same C values as used for the Pleistocene
Missoula Floods which formed the Channeled Scabland in
Montana, Idaho, Washington, and Oregon [Baker, 1973].
Those terrestrial floods cut through flood lavas covered by
loess – a geologic setting analogous to Athabasca Valles
[e.g., Jaeger et al., 2003].
2.2. Flow Over Complex Topography
[7] By explicitly accounting for non-hydrostatic flow
within a shallow water model, using the method presented
by Denlinger and Iverson [2004], the model accommodates
flow transitions over drops, through chutes and pools, and
across multiple current streams as flow occurs over rugged
3D terrain. Given an adequate topographic model, the
effects of in-channel obstacles and distributary flow can
be fully quantified. The accuracy of the model has been
demonstrated for a variety of historical terrestrial floods Figure 2. Plot of stream power and flow velocity 60 hours
[e.g., Denlinger et al., 2002; O’Connell et al., 2002; into the 1 106 m3 s 1 discharge run. Note how flow is
Ostenaa et al., 2002; Wallick et al., 2003]. accelerated through constrictions in the channel and the
peaks in stream power at steps in the channel topography.
2 of 5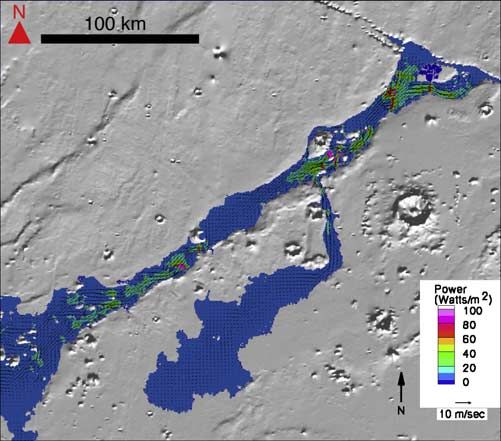
L21206                            KESZTHELYI ET AL.: FLOODS IN ATHABASCA VALLES                                         L21206

                                                                  1– 2  106 m3 s 1. The match to the earlier HEC-RAS runs
                                                                  in this area is very encouraging. However, this range of
                                                                  discharge cannot reach some of the topographically higher
                                                                  distributary channels or streamlined forms. Those locations
                                                                  are filled when discharge is increased to 8  106 m3 s 1.
                                                                  This is clearest in the area labeled ‘‘b’’ in Figure 1, but is
                                                                  also evident on the north side of the section labeled ‘‘a’’.
                                                                    [14] Farther down the channel, a discharge of 2 – 4
                                                                  106 m3 s 1 suffices to reach even the highest locations
                                                                  with visible water erosion. Interestingly, the 8  106 m3
                                                                  s 1 run reaches far above any high water marks (e.g., the
                                                                  areas labeled ‘‘c’’ and ‘‘e’’ in Figure 1). Therefore we find
                                                                  a factor of 2 decrease in the discharge required to run
                                                                  bank-full from the upper and lower reaches of Athabasca
                                                                  Valles. Some water must be lost during the roughly 1 day
                                                                  that it takes for the flow to traverse Athabasca Valles.
                                                                  However, neither evaporation nor infiltration can reason-
                                                                  ably account for 4 – 6  106 m3 s 1 of water loss [e.g.,
                                                                  Carr, 1996]. The more likely explanation is that the
Figure 3. Model results from the near-source region.              channel is more deeply incised near the source than in
Stream power at 60 hours for the 1  106 m3 s 1 run               the middle and distal reaches. This modeling confirms
overlaid on the THEMIS IR daytime mosaic. Yellow lines            earlier suspicions that the current channel was never filled
are MOLA tracks. There are two prominent areas with high          with water.
stream power where enhanced erosion is predicted. The one
labeled ‘‘A’’ is due to an interpolation artifact in the large
gap between MOLA tracks. The other, labeled ‘‘B,’’ is
found to correspond to a series of dry cataracts. Illumination
is from the west.

  [11] Typically the model is run to simulate dam-breaks
and starts with a finite body of water that is catastrophically
released. For Athabasca Valles, a fixed discharge was placed
in the bottom of the Cerberus Fossae. As the fissures filled,
the water then simply flowed out at the lowest low points
along the rim. For this study, discharges of one, two, four,
and eight million cubic meters per second were used, guided
by the 1– 2  106 m3/s estimate from the earlier studies
[e.g., Burr et al., 2002a, 2002b, 2004; Burr, 2003]. We also
only simulated clean water in this initial study.

3. Results
   [12] The model output was visualized as a series of plots
at select time steps showing water depth or stream power
with flow velocity vectors overlain. Figure 2 is an example
of one of these plots. In the model, it takes 1 – 10 hours to
fill the local segment of the Cerberus Fossae, as if the
fissures had a volume of 36 km3. However, this is an
overestimate because the interpolation in the MOLA DEM
smoothes the near-vertical walls of the Cerberus Fossae.
Once it is flowing down the channel, the modeled flood
behaves as expected. It enters distributary channels that cut
over the wrinkle ridge and courses between the flood-
formed features on the channel floor discussed by Burr et
al. [2002a, 2002b].
   [13] The previously published bank-full discharge esti-        Figure 4. Portion of MOC image S11-03177 showing a
mates were derived from the upper reach of the main               section of the series of dry cataracts found in the area
channel (labeled ‘‘a’’ in Figure 1). The simple geometry          labeled ‘‘B’’ in Figure 3. Image is centered at 9.86N,
of this section was the most appropriate for the 1D HEC-          156.69E and sinusoidally projected at 3.12 m/pixel. North is
RAS model [Burr, 2003]. The new simulations best fit the          to the top, illumination is from the southwest, and overall
main topographic channel in this section with a discharge of      flow was from east to west.

                                                             3 of 5
L21206 KESZTHELYI ET AL.: FLOODS IN ATHABASCA VALLES L21206
[15] The model also shows physically reasonable inter- Such future studies should include examining the effect of
actions with more complex topography (Figure 2). Water sediment in the water and time-varying discharge.
fills and stagnates within breached impact craters. The
highest stream power is found where the flow is accelerated [19] Acknowledgment. This work was funded by the NASA Mars
through constrictions concurrent with a step in topography. Data Analysis Program.
Superelevation is observed where the momentum of the
flow carries water up the side of topographic obstacles.
References
Baker, V. R. (1973), Paleohydrology and sedimentology of Lake Missoula
These results can be compared to the observed geomor- flooding in eastern Washington, Spec. Pap. Geol. Soc., 144.
phology. For example, the large apparently breached crater Berman, D. C., and W. K. Hartmann (2002), Recent fluvial, volcanic, and
near the middle of the main channel (labeled ‘‘d’’ in Figure 1) tectonic activity on the Cerberus plains of Mars, Icarus, 159, 1 – 17.
would be an ideal location for slackwater sedimentation. Burr, D. M. (2003), Hydraulic modelling of Athabasca Vallis, Mars, Hydrol.
Sci. J., 48, 655 – 664.
The superelevation suggests that high-water marks will be Burr, D. M. (2005), Clustered streamlined forms in Athabasca Valles, Mars:
higher on the stoss side than on the lee side of some Evidence for sediment deposition during floodwater ponding, Geomor-
obstacles. And high shear stress areas near the source are phology, 69, 242 – 252.
Burr, D. M., J. A. Grier, A. S. McEwen, and L. P. Keszthelyi (2002a),
likely localities for potholes and other erosional features. Repeated aqueous flooding from the Cerberus Fossae: Evidence for very
Unfortunately, when we do examine the areas the model recently extant, deep groundwater on Mars, Icarus, 159, 53 – 73.
highlights, we find that many are artifacts in the MOLA Burr, D. M., A. S. McEwen, and S. E. H. Sakimoto (2002b), Recent aqu-
eous floods from the Cerberus Fossae, Mars, Geophys. Res. Lett., 29(1),
DEM. For example, the breached crater near the center of the 1013, doi:10.1029/2001GL013345.
main channel is seen in image data to actually be a complete Burr, D. M., P. A. Carling, R. A. Beyer, and N. Lancaster (2004), Flood-
crater with no breach. The MOLA shot points missed the formed dunes in Athabasca Valles, Mars: Morphology, modeling, and
eastern rim, so the interpolated DEM shows a breach. implications, Icarus, 171, 68 – 83.
Carr, M. H. (1996), Water on Mars, 229 pp., Oxford Univ. Press, Oxford,
[16] Figure 3 highlights more interesting results from U. K.
near the source area. One prominent location (labeled Denlinger, R. P., and R. M. Iverson (2004), Granular avalanches across
‘‘A’’ in Figure 3) where the model shows high stream power irregular three-dimensional terrain: 1. Theory and computation, J. Geo-
phys. Res., 109, F01014, doi:10.1029/2003JF000085.
falls in a wide gap between MOLA shot points. It turns out Denlinger, R. P., D. R. H. O’Connell, and P. K. House (2002), Robust
that the DEM interpolation algorithm inserted a step in the determination of stage and discharge: An example from an extreme flood
middle of this gap, which produces a fictional cataract in the on the Verde River, Arizona, in Ancient Floods, Modern Hazards: Prin-
ciples and Applications of Paleoflood Hydrology, Water Sci. Appl. Ser.,
channel floor. However, at the location labeled ‘‘B’’ vol. 5, edited by P. K. House et al., pp. 127 – 146, AGU, Washington,
the MOLA data is denser and the model indication of high D. C.
stream power should be correct. Upon examination of the Edgett, K. S., and J. W. Rice (1995), Very young volcanic, lacustrine, and
Mars Orbiter Camera (MOC) images of the area, we fluvial features of the Cerberus and Elysium basin region, Mars: Where to
send the 1999 Mars Surveyor Lander, Lunar Planet. Sci. Conf., 26, 357 –
discovered a corresponding series of dry cataracts that have 358.
not been previously reported (Figure 4). Hartmann, W. K., and D. C. Berman (2000), Elysium Planitia lava flows:
[17] We were particularly interested in determining the Crater count chronology and geological implications, J. Geophys. Res.,
105, 15,011 – 15,026.
flow behavior around a concentration of streamlined forms Hydrologic Engineering Center (2002), HEC-RAS hydraulic reference
between which the only reported subaqueous dunes on Mars manual, version 3.1, 350 pp., U.S. Army Corps of Eng. Hydrol. Eng.
can be found [Burr et al., 2004]. However, the MOLA DEM Cent., Davis, Calif.
does not resolve these kilometer-scale features and thus the Jaeger, W. L., L. P. Keszthelyi, D. M. Burr, A. S. McEwen, V. R.
Baker, H. Miyamoto, and R. A. Beyer (2003), Ring dike structures in the
estimated local flow not reliable. This same issue precludes Channeled Scabland as analogs for circular features in Athabasca Valles,
our ability to confirm or refute superelevation around Mars, Lunar Planet. Sci. Conf., 34, Abstract 2045.
in-channel obstacles. Jaeger, W. L., L. P. Keszthelyi, A. S. McEwen, C. M. Dundas, and P. S.
Russell (2007), Athabasca Valles, Mars: A lava-draped channel system,
Science, 317, 1709 – 1711.
4. Conclusions Komar, P. D. (1980), Modes of sediment transport in channelized water
flows with ramifications to the erosion of the Martian outflow channels,
[18] The concurrence of the new 2.5D and the previous Icarus, 42, 317 – 329.
Leask, H. J., L. Wilson, and K. L. Mitchell (2007), Formation of Mangala
1D modeling (where both are valid) confirms that the new Valles outflow channel, Mars: Morphological development and water
model has been properly modified for Mars simulations. discharge and duration estimates, J. Geophys. Res., 112, E08003,
However, these discharges must be considered upper limits doi:10.1029/2006JE002851.
McEwen, A. S., B. S. Preblich, E. P. Turtle, N. A. Artemieva, M. P.
because they neglect that fact that the channel was incised Golombek, M. Hurst, R. L. Kirk, D. M. Burr, and P. R. Christensen
by the flood and therefore the current topography probably (2005), The rayed crater Zunil and interpretations of small impact craters
never ran bank-full. Instead, it appears that the upper on Mars, Icarus, 176, 351 – 381.
reaches of the channel system are much more deeply eroded Murray, J. B., et al. (2005), Evidence from the Mars Express High Resolu-
tion Stereo Camera for a frozen sea close to Mars’ equator, Nature, 434,
than the distal parts. The flow model demonstrated its 256 – 352.
potential to predict the distribution of erosional and depo- O’Connell, D. R. H., D. A. Ostenaa, D. R. Levish, and R. E. Klinger
sitional landforms with the discovery of a dry cataract. (2002), Bayesian flood frequency analysis with paleohydrologic bound
data, Water Resour. Res., 38(5), 1058, doi:10.1029/2000WR000028.
However, in order to realize the full synergism between the Ostenaa, D. A., D. R. H. O’Connell, R. A. Walters, and R. J. Creed (2002),
modeling and the observed geomorphology, better topo- Holocene paleoflood hydrology of the Big Lost River, western Idaho
graphic data is required. Improving the MOLA elevation Engineering and Environmental Laboratory, Idaho, Spec. Pap. Geol.
Soc. Am., 353, 91 – 110.
model by incorporating Mars Express HRSC and Mars Plescia, J. B. (2003), Cerberus Fossae, Elysium, Mars: A source for lava
Reconnaissance Orbiter CTX stereo data should produce and water, Icarus, 164, 79 – 95.
accurate DTMs at the appropriate scale for future studies. Pope, S. B. (2000), Turbulent Flows, 806 pp., Cambridge Univ. Press, New
York.
4 of 5L21206 KESZTHELYI ET AL.: FLOODS IN ATHABASCA VALLES L21206
Tanaka, K. L., and D. H. Scott (1986), The youngest channel system on from water depths, regional slopes, and channel floor properties, J. Geo-
Mars, Lunar Planet. Sci. Conf., 17, 865 – 866. phys. Res., 109, E09003, doi:10.1029/2004JE002281.
Wallick, J. R., R. Denlinger, S. Lancaster, and J. Bolte (2003), Assessing
the role of floods, land conversion and bank materials in determining
channel change along the Willamette River, Eos Trans. AGU, 84(46), D. M. Burr, Carl Sagan Center for the Study of Life in the Universe, SETI
Fall. Meet. Suppl., Abstract H42E-1121. Institute, 515 N. Whisman Road, Mountain View, CA 94043-2172, USA.
Wilson, L., G. J. Ghatan, J. W. Head III, and K. L. Mitchell (2004), Mars R. P. Denlinger, Cascades Volcano Observatory, U.S. Geological Survey,
outflow channels: A reappraisal of the estimation of water flow velocities 1300 SE Cardinal Court, Building 10, Suite 100, Vancouver, WA 98683-
9589, USA.
L. P. Keszthelyi, Flagstaff Field Center, U.S. Geological Survey, 2255 N.
Gemini Drive, Flagstaff, AZ 86001, USA. (laz@usgs.gov)
D. R. H. O’Connell, William Lettis and Associates, 433 Park Point Drive,
Golden, CO 80401, USA.
5 of 5You can also read